| Param | Original file | Final file |
|---|---|---|
| Filename | modeM0/AS1A10_097T03_9000004336_30140cztM0_level2.evt | modeM0/AS1A10_097T03_9000004336_30140cztM0_level2_quad_clean.evt |
| Size (bytes) | 785,410,560 | 90,048,960 |
| Size | 749.0 MB | 85.9 MB |
| Events in quadrant A | 3,743,712 | 584,961 |
| Events in quadrant B | 5,074,207 | 589,968 |
| Events in quadrant C | 10,650,696 | 509,953 |
| Events in quadrant D | 3,864,408 | 573,167 |
| Mode M9 | |||
|---|---|---|---|
| Quadrant | BADHDUFLAG | Total packets | Discarded packets |
| A | 0 | 6 | 0 |
| B | 0 | 6 | 0 |
| C | 0 | 6 | 0 |
| D | 0 | 6 | 0 |
| Mode SS | |||
|---|---|---|---|
| Quadrant | BADHDUFLAG | Total packets | Discarded packets |
| A | 0 | 136 | 0 |
| B | 0 | 136 | 0 |
| C | 0 | 136 | 0 |
| D | 0 | 136 | 0 |
| Mode M0 | |||
|---|---|---|---|
| Quadrant | BADHDUFLAG | Total packets | Discarded packets |
| A | 0 | 15419 | 1 |
| B | 0 | 20223 | 1 |
| C | 0 | 36357 | 1 |
| D | 0 | 15611 | 1 |
| Quadrant | Total seconds | Saturated seconds | Saturation percentage |
|---|---|---|---|
| A | 6717 | 201 | 2.992407% |
| B | 6717 | 105 | 1.563198% |
| C | 6717 | 2675 | 39.824326% |
| D | 6717 | 122 | 1.816287% |
Noise dominated data is calculated using 1-second bins in cleaned event files. If a bin has >2000 counts, and if more than 50% of those come from <1% of pixels, then it is considered to be noise-dominated and hence unusable.
| Quadrant | # 1 sec bins | Bins with >0 counts | Bins with >2000 counts | High rate bins dominated by noise | Noise dominated (total time) | Noise dominated (detector-on time) | Marked lightcurve |
|---|---|---|---|---|---|---|---|
| A | 7302 | 6718 | 88 | 88 | 1.21% | 1.31% | 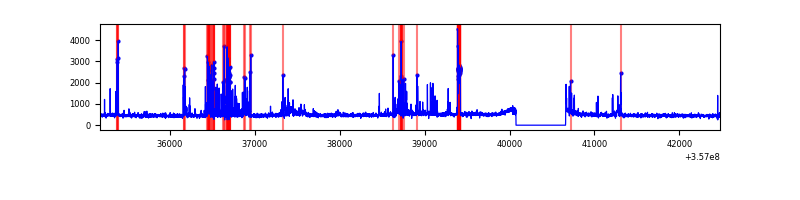 |
| B | 7302 | 6718 | 0 | 0 | 0.00% | 0.00% | 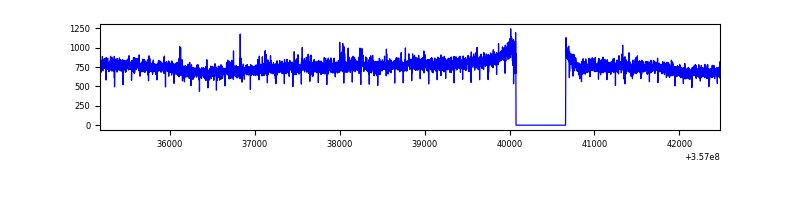 |
| C | 7302 | 6718 | 1717 | 1717 | 23.51% | 25.56% | 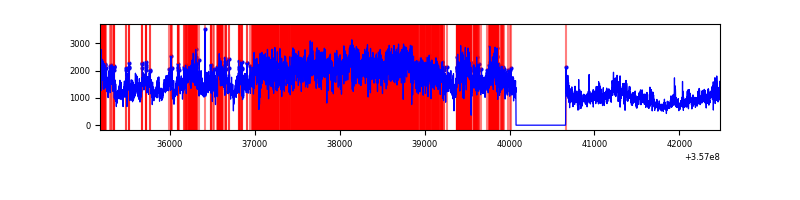 |
| D | 7302 | 6718 | 65 | 65 | 0.89% | 0.97% | 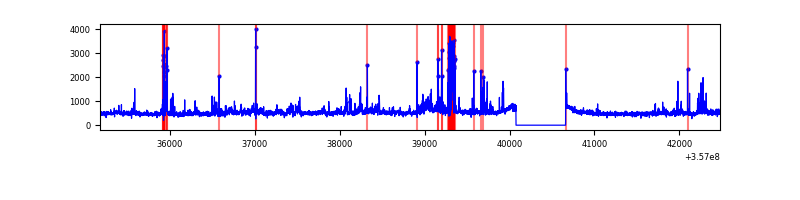 |
Top three noisy pixels from each quadrant. If the there are fewer than three noisy pixels in the level2.evt file, extra rows are filled as -1
| Pixel properties | Quadrant properties | ||||||
|---|---|---|---|---|---|---|---|
| Quadrant | DetID | PixID | Counts | Sigma | Mean | Median | Sigma |
| A | 0 | 13 | 596954 | 3682.83 | 811 | 794 | 161.9 |
| A | 13 | 254 | 12405 | 71.73 | 811 | 794 | 161.9 |
| A | 8 | 192 | 11466 | 65.93 | 811 | 794 | 161.9 |
| B | 6 | 159 | 1908404 | 12313.59 | 802 | 779 | 154.9 |
| B | 12 | 111 | 19321 | 119.69 | 802 | 779 | 154.9 |
| B | 11 | 111 | 17269 | 106.44 | 802 | 779 | 154.9 |
| C | 3 | 233 | 7674502 | 46052.91 | 714 | 718 | 166.6 |
| C | 14 | 238 | 138939 | 829.51 | 714 | 718 | 166.6 |
| C | 14 | 254 | 36607 | 215.38 | 714 | 718 | 166.6 |
| D | 13 | 168 | 369379 | 1883.51 | 799 | 781 | 195.7 |
| D | 8 | 195 | 152695 | 776.27 | 799 | 781 | 195.7 |
| D | 1 | 52 | 106325 | 539.32 | 799 | 781 | 195.7 |
Histogram calculated using DETX and DETY for each event in the final _common_clean file
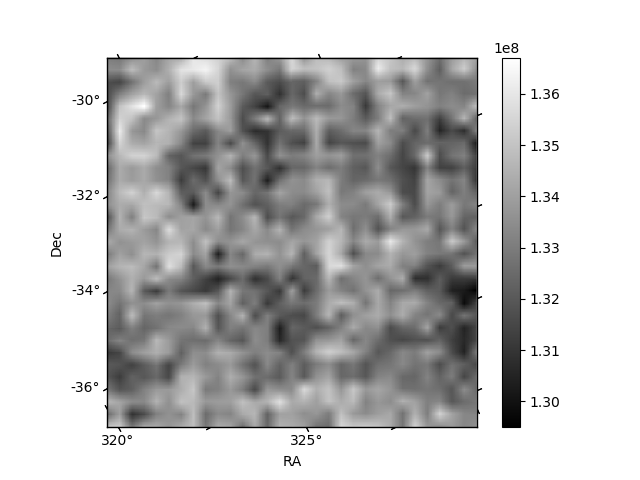
| Quadrant A | 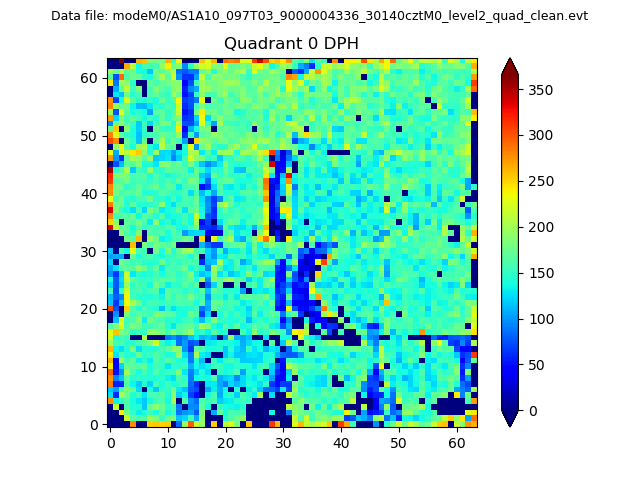 |
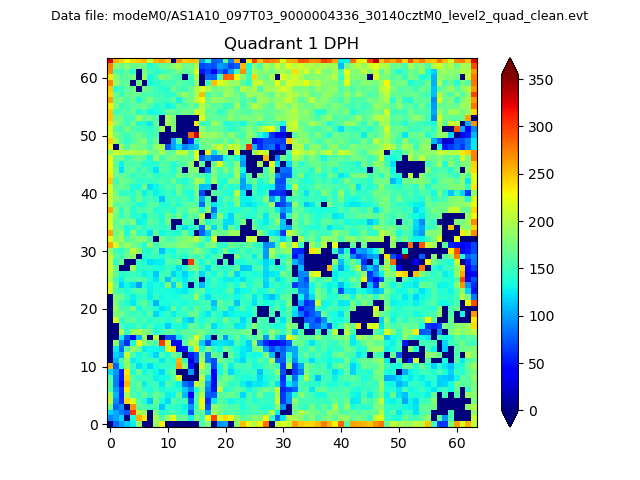 |
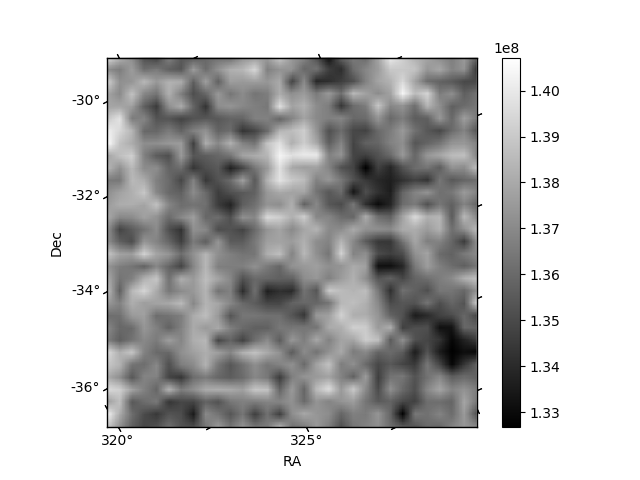
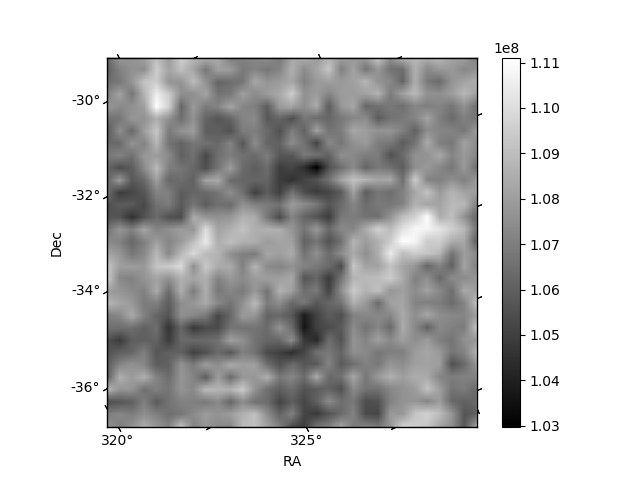
Quadrant B |
|---|---|---|---|
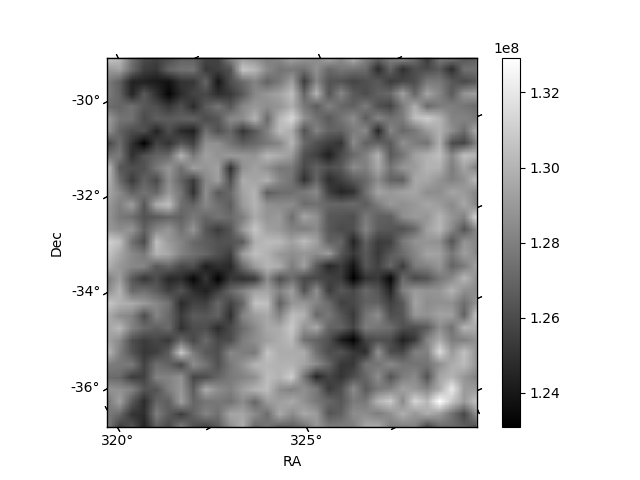
| Quadrant D |  |
 |
Quadrant C |
| Plot type | Count rate plots | Images |
|---|---|---|
| Comparison with Poisson distribution Blue bars denote a histogram of data divided into 1 sec bins. Red curve is a Poisson curve with rate = median count rate of data. |
 |
 |
| Quadrant-wise count rates Data is divided into 100 sec bins |
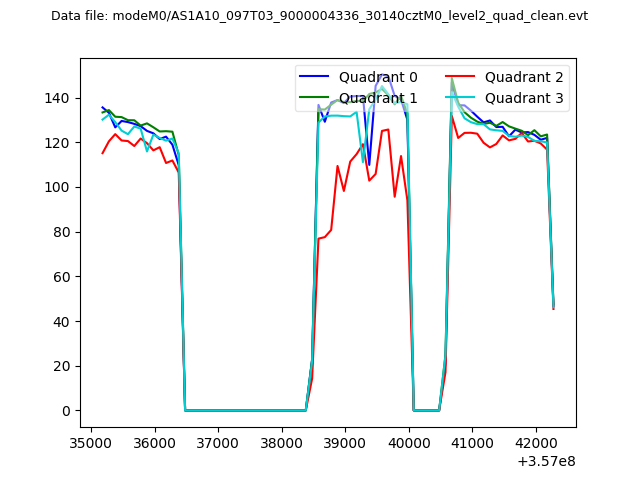 |
|
| Module-wise count rates for Quadrant A Data is divided into 100 sec bins |
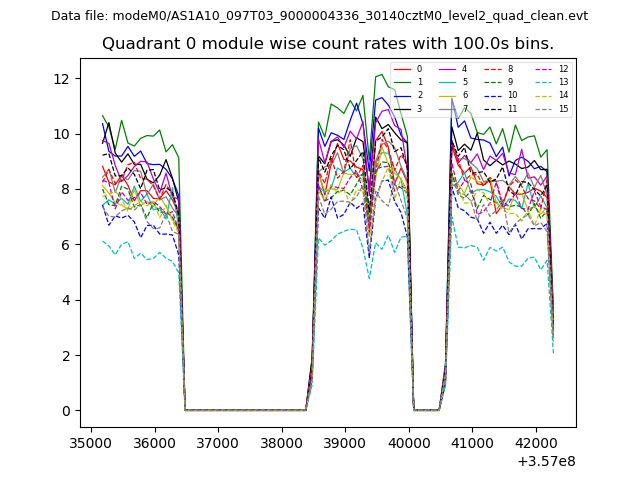 |
 |
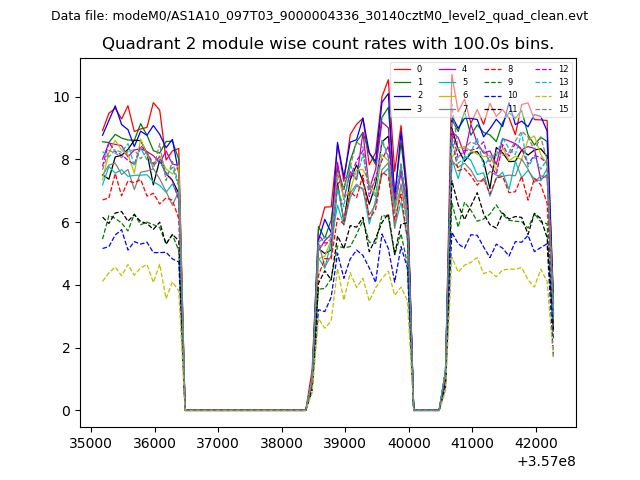
| Module-wise count rates for Quadrant B Data is divided into 100 sec bins |
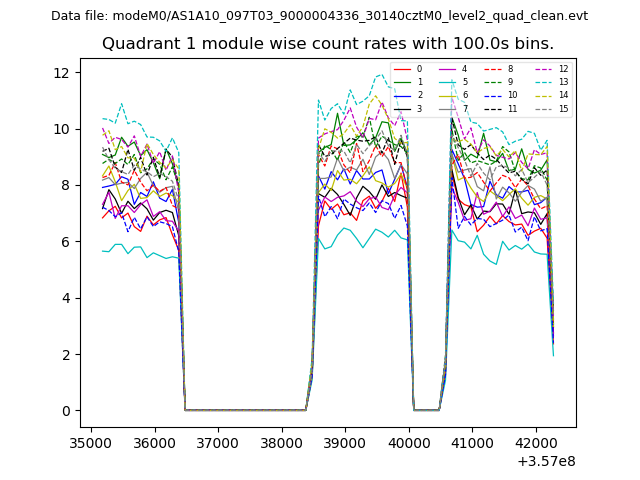 |
 |
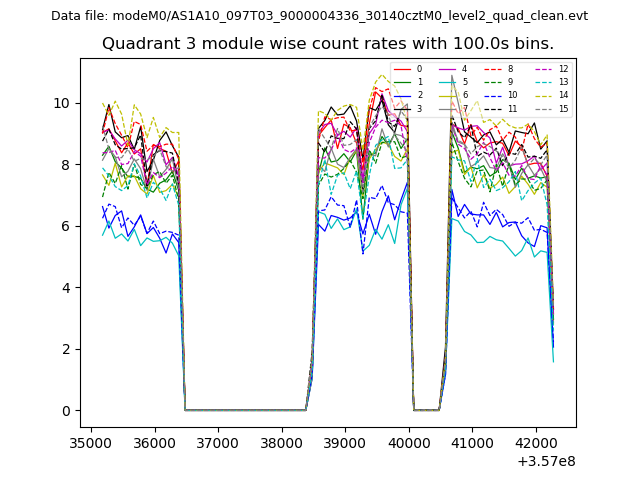
| Module-wise count rates for Quadrant C Data is divided into 100 sec bins |
 |
 |
| Module-wise count rates for Quadrant D Data is divided into 100 sec bins |
 |
 |
| Parameter | Plot |
|---|---|
| CZT HV Monitor | 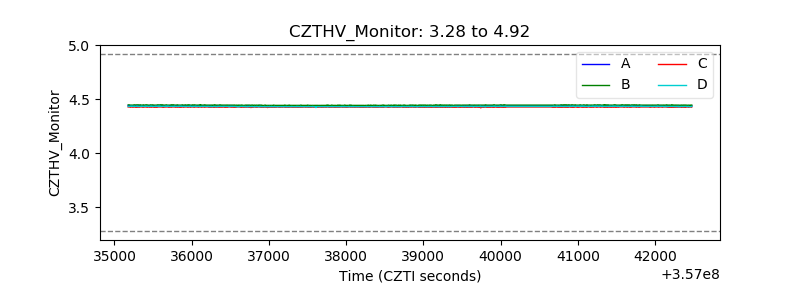 |
| D_VDD | 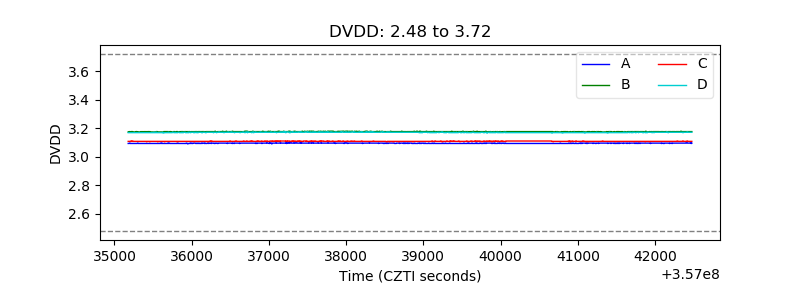 |
| Temperature 1 |  |
| Veto HV Monitor | 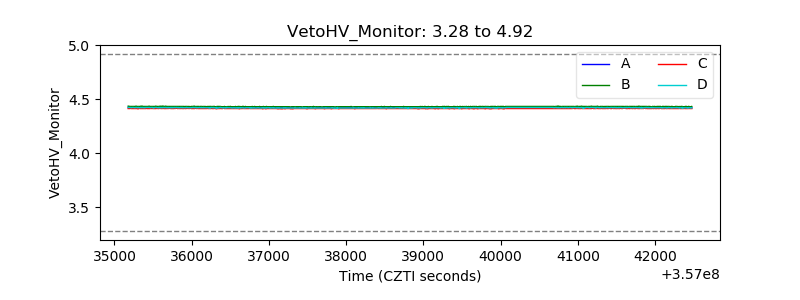 |
| Veto LLD | 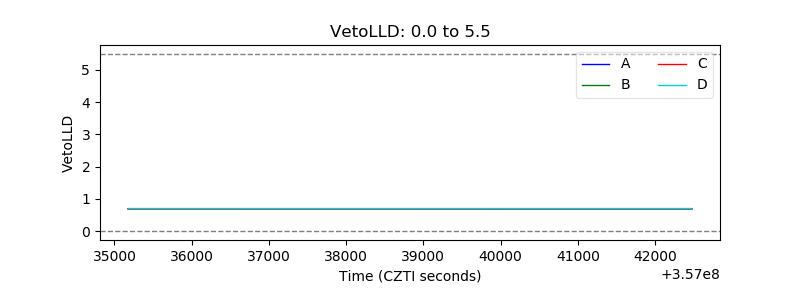 |
| Alpha Counter | 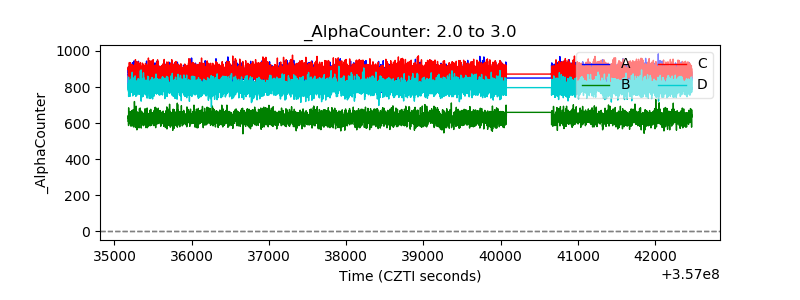 |
| _CPM_Rate | 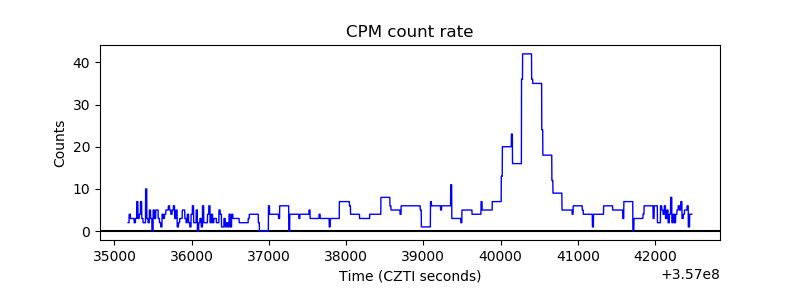 |
| CZT Counter |  |
| +2.5 Volts monitor |  |
| +5 Volts monitor |  |
| _ROLL_ROT | 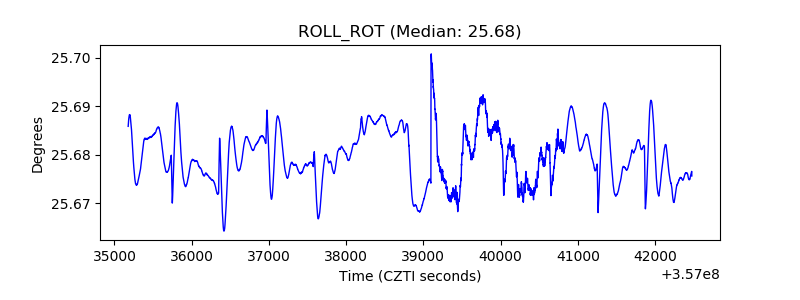 |
| _Roll_DEC | 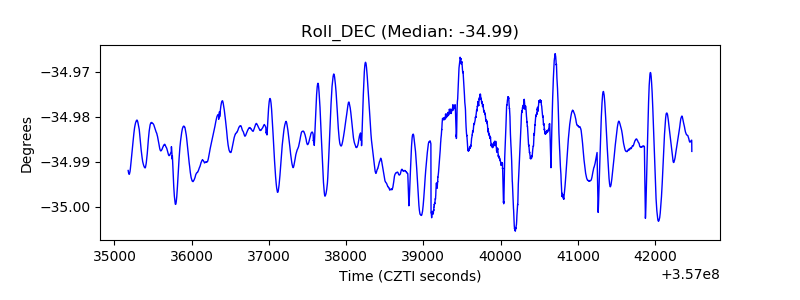 |
| _Roll_RA | 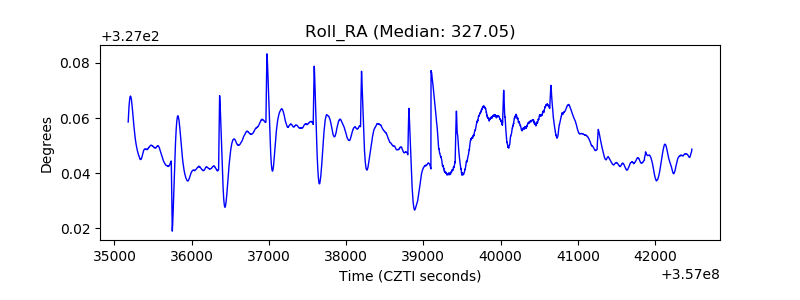 |
| Veto Counter | 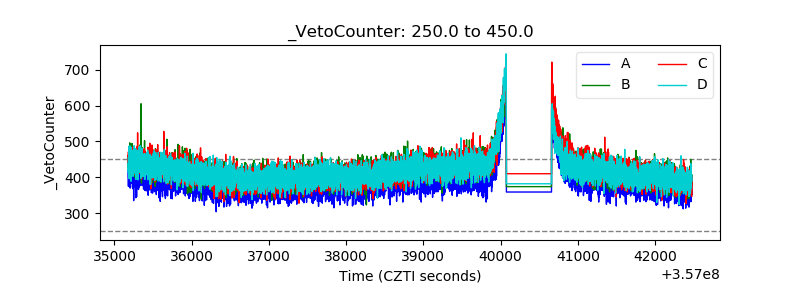 |