| Param | Original file | Final file |
|---|---|---|
| Filename | modeM0/AS1A10_097T03_9000004336_30141cztM0_level2.evt | modeM0/AS1A10_097T03_9000004336_30141cztM0_level2_quad_clean.evt |
| Size (bytes) | 665,547,840 | 98,608,320 |
| Size | 634.7 MB | 94.0 MB |
| Events in quadrant A | 3,722,103 | 629,737 |
| Events in quadrant B | 5,689,680 | 626,527 |
| Events in quadrant C | 5,862,317 | 601,186 |
| Events in quadrant D | 4,382,617 | 614,461 |
| Mode SS | |||
|---|---|---|---|
| Quadrant | BADHDUFLAG | Total packets | Discarded packets |
| A | 0 | 148 | 0 |
| B | 0 | 148 | 0 |
| C | 0 | 148 | 0 |
| D | 0 | 148 | 0 |
| Mode M0 | |||
|---|---|---|---|
| Quadrant | BADHDUFLAG | Total packets | Discarded packets |
| A | 0 | 15818 | 1 |
| B | 0 | 22568 | 1 |
| C | 0 | 22869 | 4 |
| D | 0 | 17593 | 1 |
| Quadrant | Total seconds | Saturated seconds | Saturation percentage |
|---|---|---|---|
| A | 7384 | 283 | 3.832611% |
| B | 7384 | 371 | 5.024377% |
| C | 7383 | 540 | 7.314100% |
| D | 7383 | 249 | 3.372613% |
Noise dominated data is calculated using 1-second bins in cleaned event files. If a bin has >2000 counts, and if more than 50% of those come from <1% of pixels, then it is considered to be noise-dominated and hence unusable.
| Quadrant | # 1 sec bins | Bins with >0 counts | Bins with >2000 counts | High rate bins dominated by noise | Noise dominated (total time) | Noise dominated (detector-on time) | Marked lightcurve |
|---|---|---|---|---|---|---|---|
| A | 7399 | 7385 | 18 | 18 | 0.24% | 0.24% | 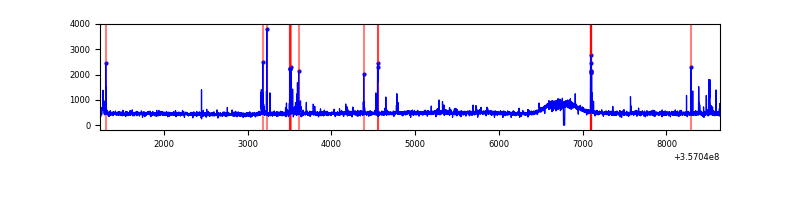 |
| B | 7399 | 7385 | 8 | 8 | 0.11% | 0.11% | 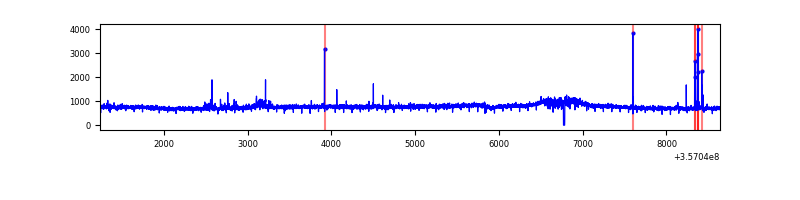 |
| C | 7398 | 7384 | 70 | 70 | 0.95% | 0.95% | 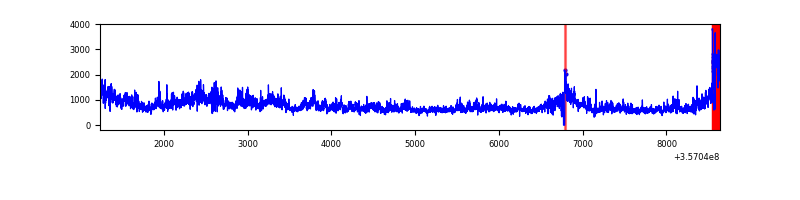 |
| D | 7398 | 7384 | 48 | 48 | 0.65% | 0.65% | 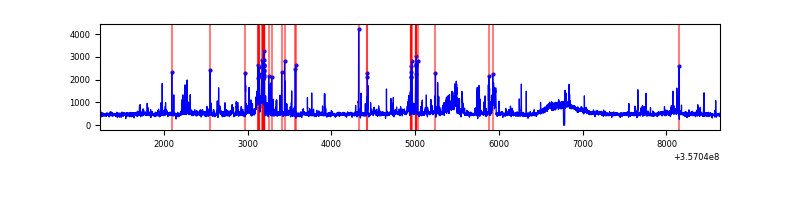 |
Top three noisy pixels from each quadrant. If the there are fewer than three noisy pixels in the level2.evt file, extra rows are filled as -1
| Pixel properties | Quadrant properties | ||||||
|---|---|---|---|---|---|---|---|
| Quadrant | DetID | PixID | Counts | Sigma | Mean | Median | Sigma |
| A | 0 | 13 | 188736 | 1005.8 | 915 | 894 | 186.8 |
| A | 13 | 254 | 14016 | 70.26 | 915 | 894 | 186.8 |
| A | 3 | 137 | 9591 | 46.57 | 915 | 894 | 186.8 |
| B | 6 | 159 | 2088276 | 12002.55 | 895 | 870 | 173.9 |
| B | 0 | 229 | 30956 | 172.99 | 895 | 870 | 173.9 |
| B | 10 | 247 | 28455 | 158.61 | 895 | 870 | 173.9 |
| C | 3 | 233 | 2261021 | 11178.33 | 862 | 866 | 202.2 |
| C | 14 | 238 | 173950 | 856.04 | 862 | 866 | 202.2 |
| C | 14 | 254 | 51323 | 249.55 | 862 | 866 | 202.2 |
| D | 13 | 168 | 264522 | 1231.83 | 897 | 874 | 214.0 |
| D | 13 | 104 | 249348 | 1160.94 | 897 | 874 | 214.0 |
| D | 8 | 195 | 221387 | 1030.3 | 897 | 874 | 214.0 |
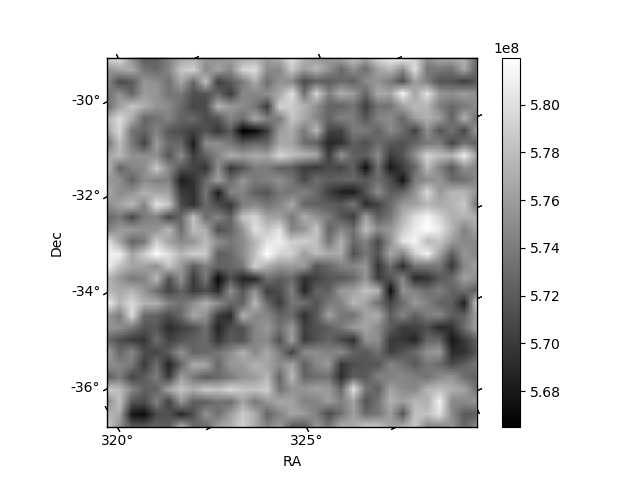
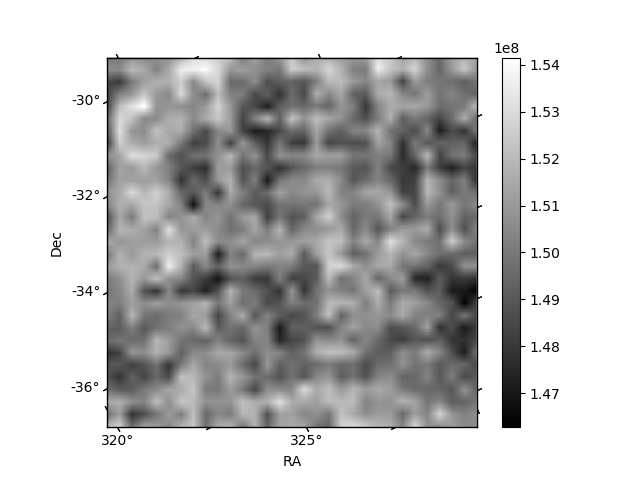
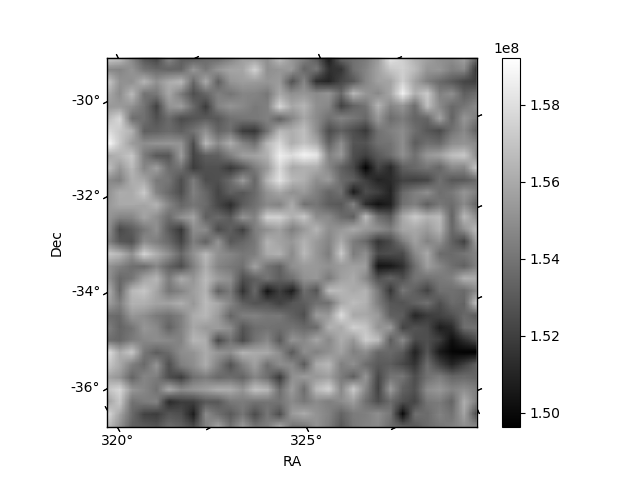
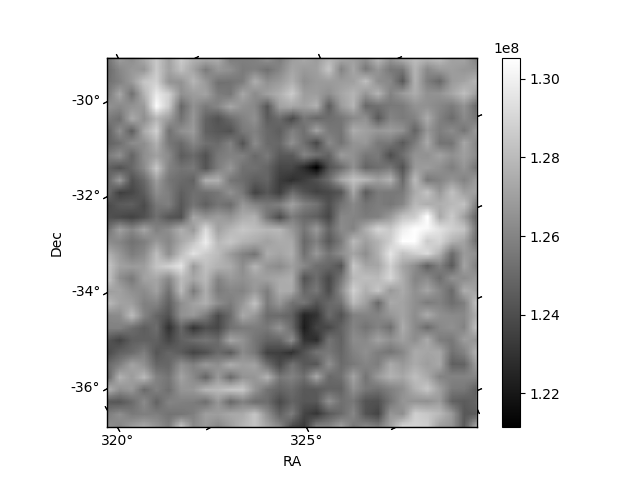
Histogram calculated using DETX and DETY for each event in the final _common_clean file
| Quadrant A | 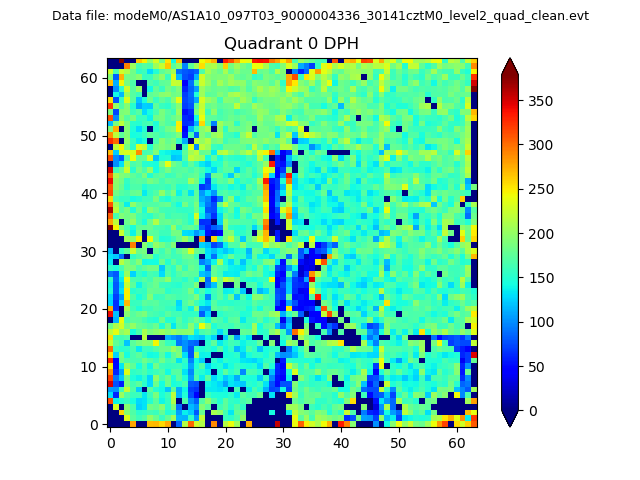 |
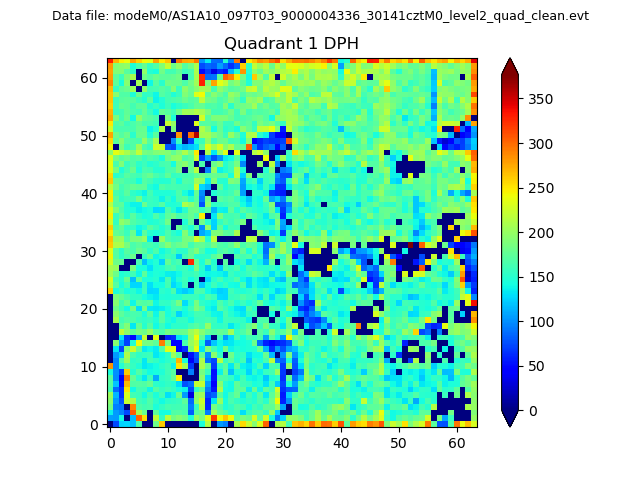 |
Quadrant B |
|---|---|---|---|
| Quadrant D | 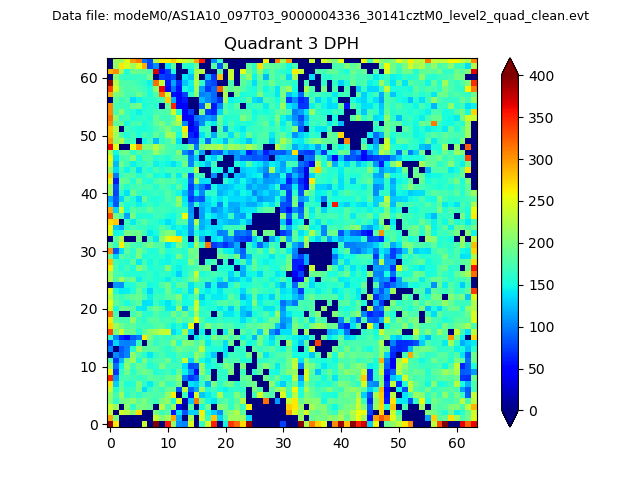 |
 |
Quadrant C |
| Plot type | Count rate plots | Images |
|---|---|---|
| Comparison with Poisson distribution Blue bars denote a histogram of data divided into 1 sec bins. Red curve is a Poisson curve with rate = median count rate of data. |
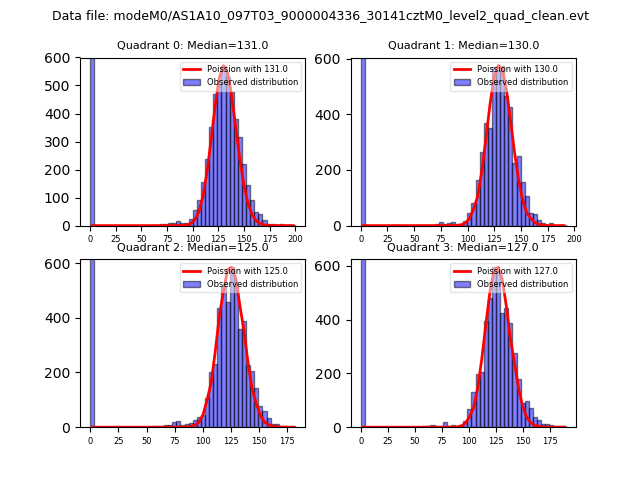 |
 |
| Quadrant-wise count rates Data is divided into 100 sec bins |
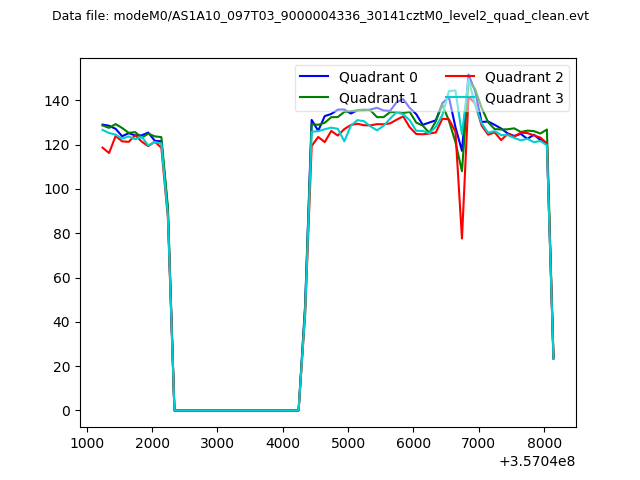 |
|
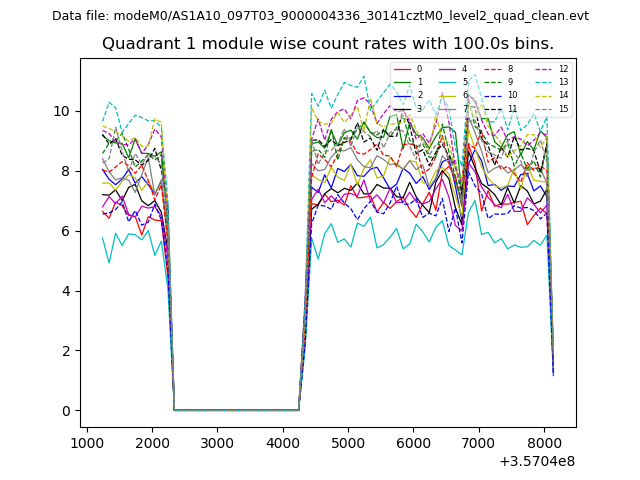
| Module-wise count rates for Quadrant A Data is divided into 100 sec bins |
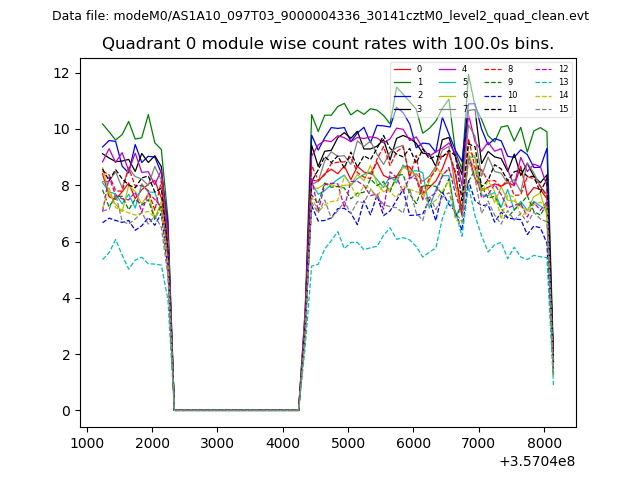 |
 |
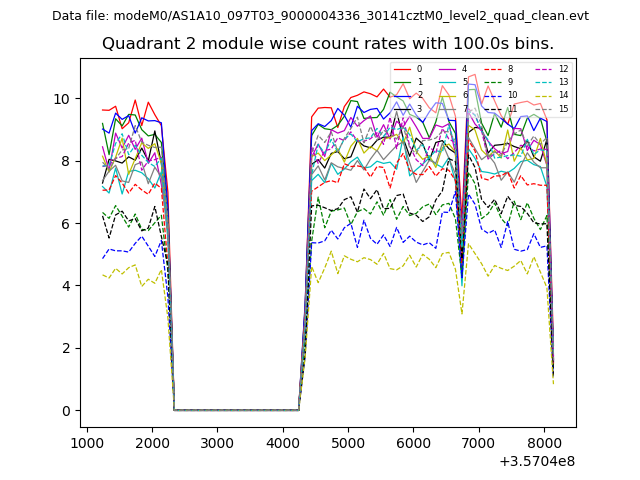
| Module-wise count rates for Quadrant B Data is divided into 100 sec bins |
 |
 |
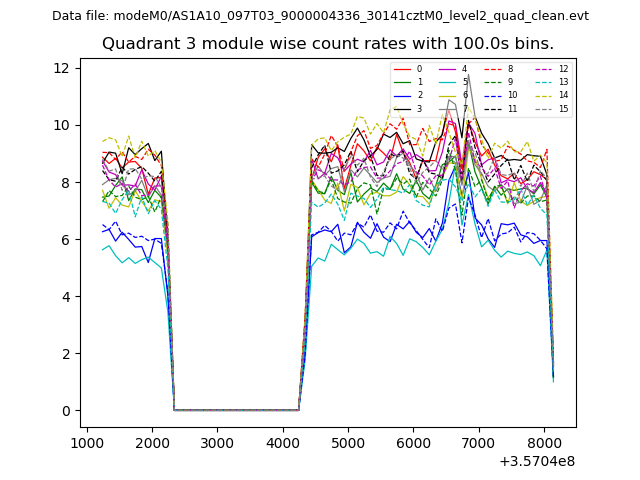
| Module-wise count rates for Quadrant C Data is divided into 100 sec bins |
 |
 |
| Module-wise count rates for Quadrant D Data is divided into 100 sec bins |
 |
 |
| Parameter | Plot |
|---|---|
| CZT HV Monitor | 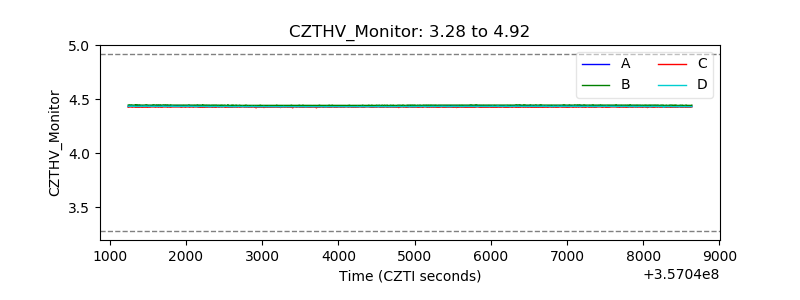 |
| D_VDD | 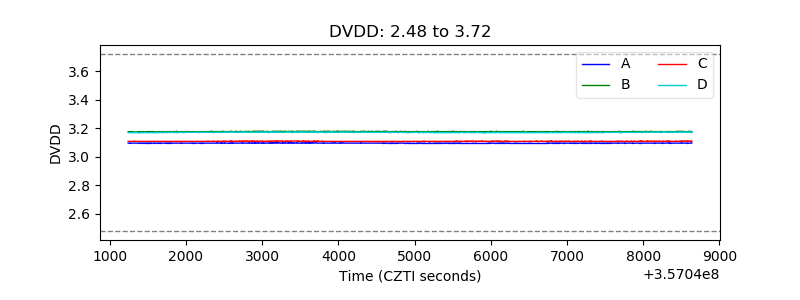 |
| Temperature 1 | 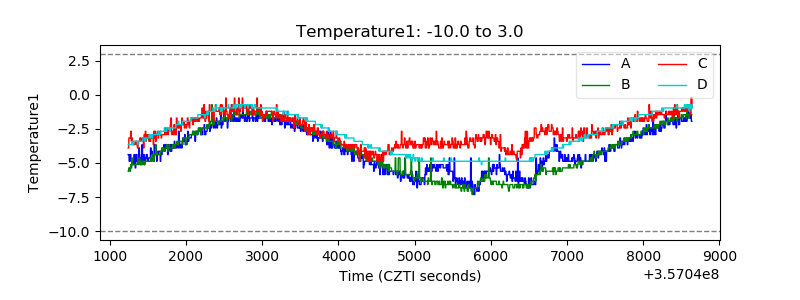 |
| Veto HV Monitor | 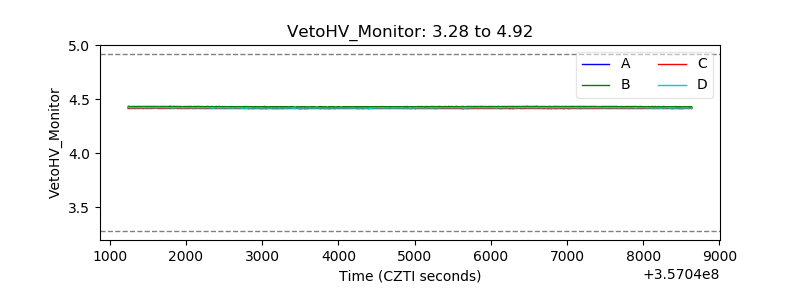 |
| Veto LLD | 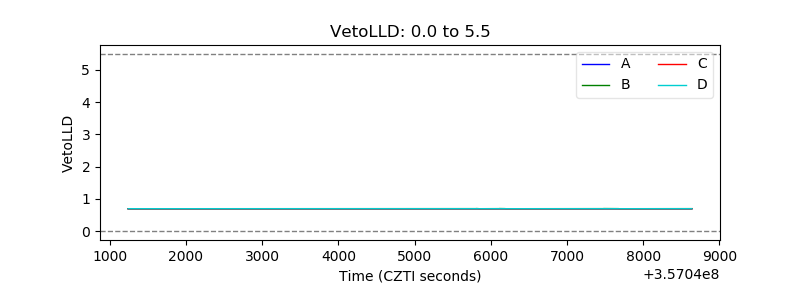 |
| Alpha Counter | 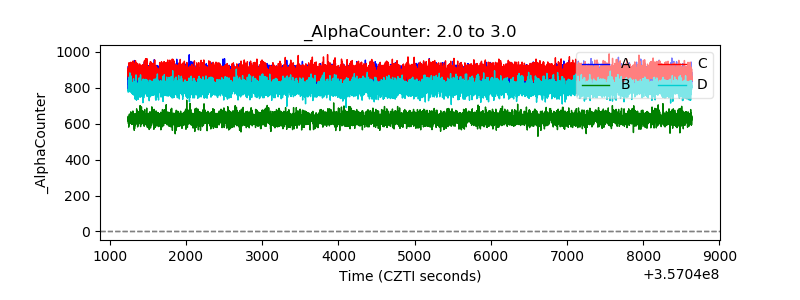 |
| _CPM_Rate | 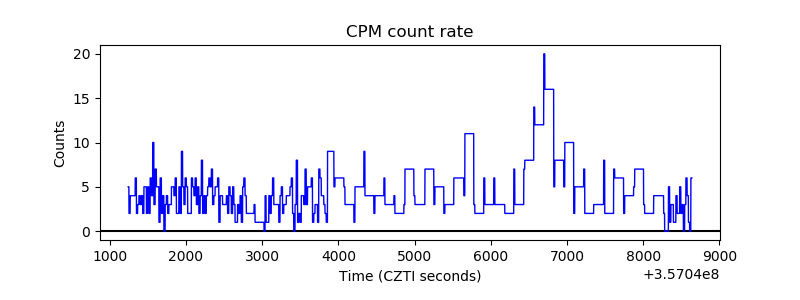 |
| CZT Counter | 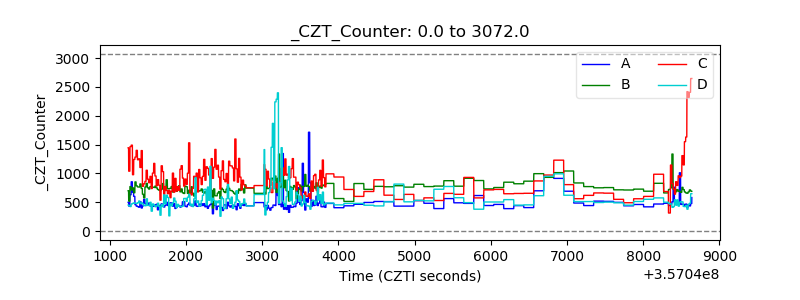 |
| +2.5 Volts monitor |  |
| +5 Volts monitor |  |
| _ROLL_ROT | 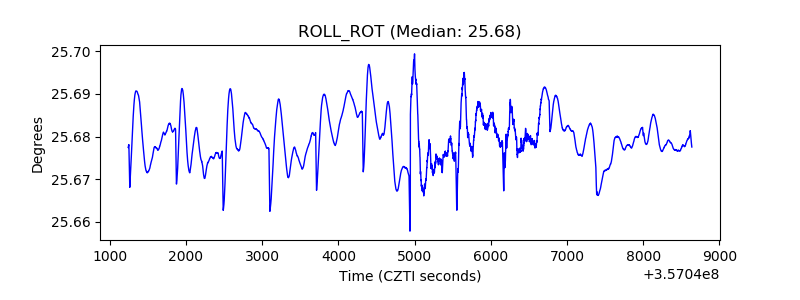 |
| _Roll_DEC | 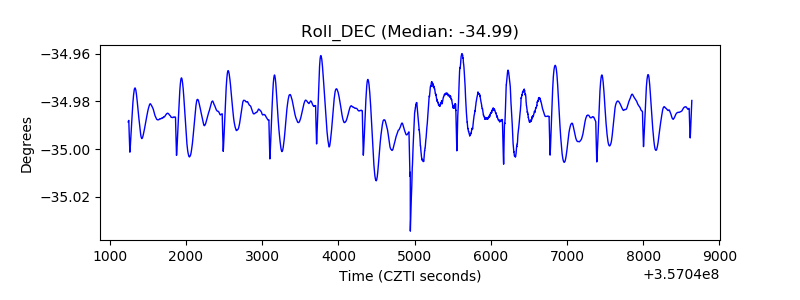 |
| _Roll_RA | 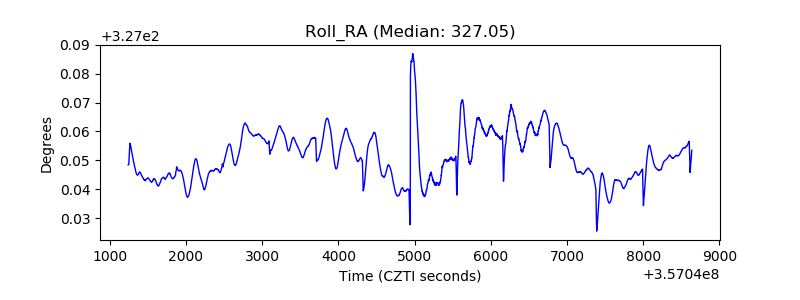 |
| Veto Counter | 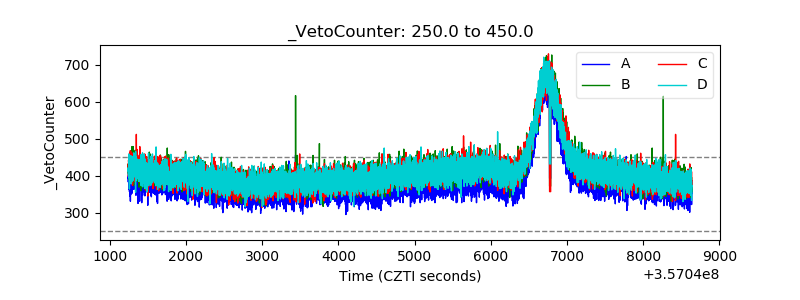 |