| Param | Original file | Final file |
|---|---|---|
| Filename | modeM0/AS1A10_097T03_9000004336_30142cztM0_level2.evt | modeM0/AS1A10_097T03_9000004336_30142cztM0_level2_quad_clean.evt |
| Size (bytes) | 730,874,880 | 90,308,160 |
| Size | 697.0 MB | 86.1 MB |
| Events in quadrant A | 3,803,864 | 567,828 |
| Events in quadrant B | 5,710,818 | 567,962 |
| Events in quadrant C | 8,330,149 | 527,187 |
| Events in quadrant D | 3,793,195 | 559,845 |
| Mode SS | |||
|---|---|---|---|
| Quadrant | BADHDUFLAG | Total packets | Discarded packets |
| A | 0 | 148 | 0 |
| B | 0 | 148 | 0 |
| C | 0 | 148 | 0 |
| D | 0 | 148 | 0 |
| Mode M0 | |||
|---|---|---|---|
| Quadrant | BADHDUFLAG | Total packets | Discarded packets |
| A | 0 | 16059 | 1 |
| B | 0 | 22648 | 1 |
| C | 0 | 30011 | 1 |
| D | 0 | 15812 | 1 |
| Quadrant | Total seconds | Saturated seconds | Saturation percentage |
|---|---|---|---|
| A | 7343 | 303 | 4.126379% |
| B | 7344 | 388 | 5.283224% |
| C | 7344 | 1488 | 20.261438% |
| D | 7344 | 186 | 2.532680% |
Noise dominated data is calculated using 1-second bins in cleaned event files. If a bin has >2000 counts, and if more than 50% of those come from <1% of pixels, then it is considered to be noise-dominated and hence unusable.
| Quadrant | # 1 sec bins | Bins with >0 counts | Bins with >2000 counts | High rate bins dominated by noise | Noise dominated (total time) | Noise dominated (detector-on time) | Marked lightcurve |
|---|---|---|---|---|---|---|---|
| A | 7373 | 7344 | 29 | 29 | 0.39% | 0.39% | 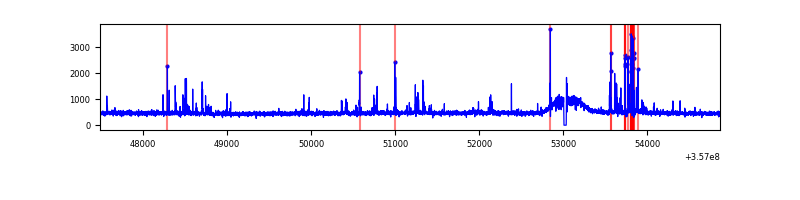 |
| B | 7374 | 7345 | 28 | 28 | 0.38% | 0.38% | 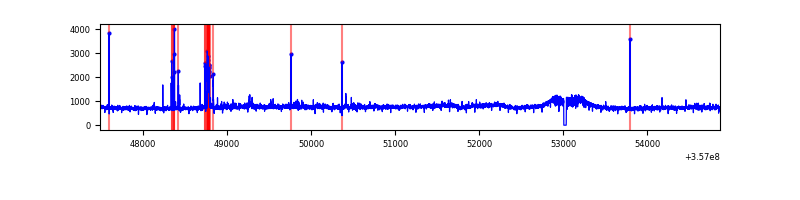 |
| C | 7374 | 7345 | 673 | 673 | 9.13% | 9.16% | 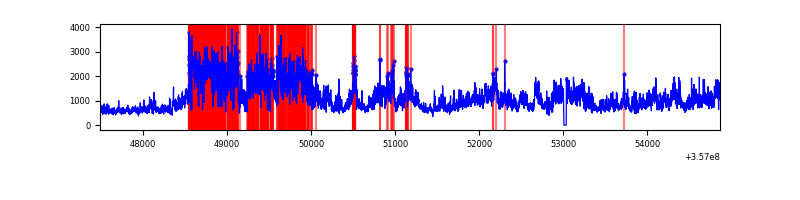 |
| D | 7374 | 7345 | 12 | 12 | 0.16% | 0.16% | 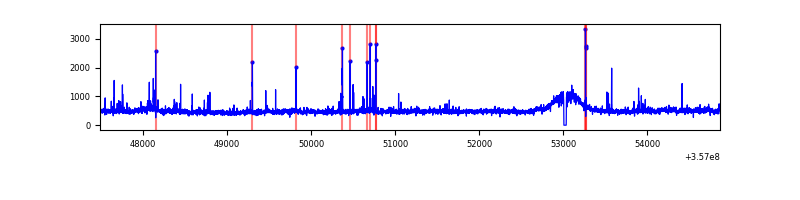 |
Top three noisy pixels from each quadrant. If the there are fewer than three noisy pixels in the level2.evt file, extra rows are filled as -1
| Pixel properties | Quadrant properties | ||||||
|---|---|---|---|---|---|---|---|
| Quadrant | DetID | PixID | Counts | Sigma | Mean | Median | Sigma |
| A | 0 | 13 | 279411 | 1508.63 | 913 | 889 | 184.6 |
| A | 13 | 254 | 14082 | 71.46 | 913 | 889 | 184.6 |
| A | 3 | 137 | 9475 | 46.51 | 913 | 889 | 184.6 |
| B | 6 | 159 | 2038165 | 11666.73 | 891 | 867 | 174.6 |
| B | 0 | 156 | 73810 | 417.71 | 891 | 867 | 174.6 |
| B | 10 | 247 | 29191 | 162.2 | 891 | 867 | 174.6 |
| C | 3 | 233 | 4863125 | 24971.64 | 822 | 827 | 194.7 |
| C | 14 | 238 | 176719 | 903.34 | 822 | 827 | 194.7 |
| C | 14 | 254 | 67116 | 340.44 | 822 | 827 | 194.7 |
| D | 8 | 195 | 217096 | 992.7 | 895 | 874 | 217.8 |
| D | 2 | 250 | 64746 | 293.24 | 895 | 874 | 217.8 |
| D | 2 | 234 | 37953 | 170.23 | 895 | 874 | 217.8 |
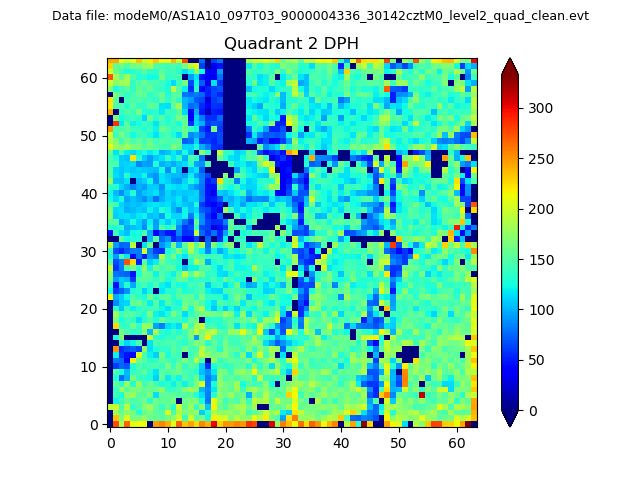
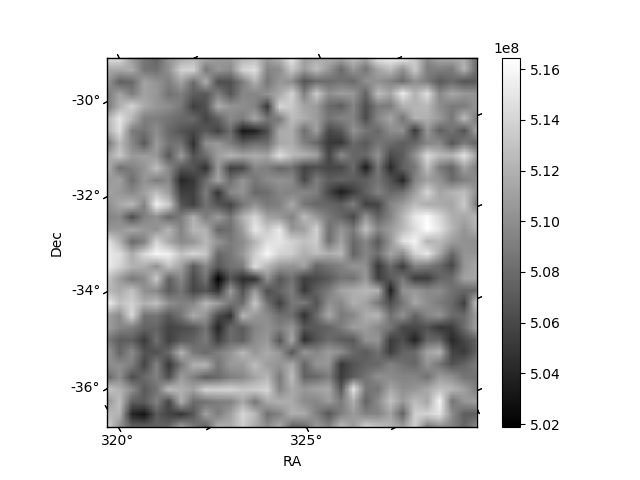
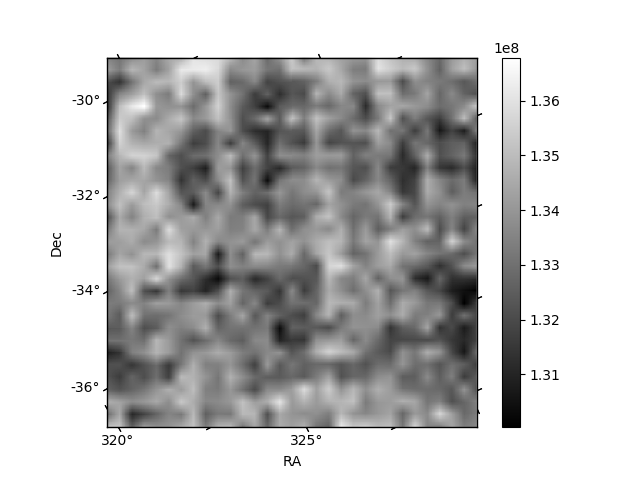
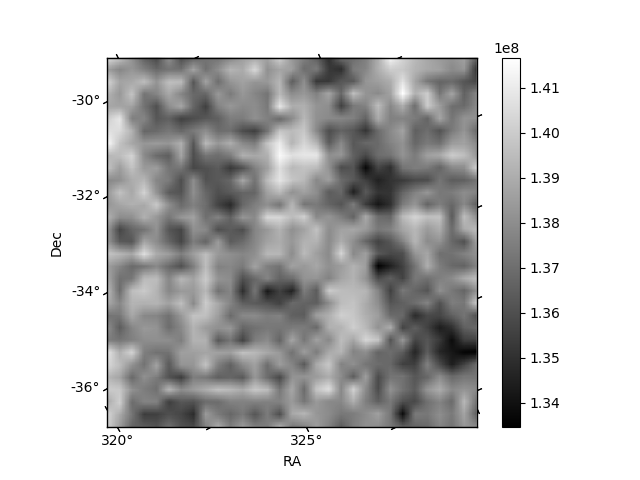
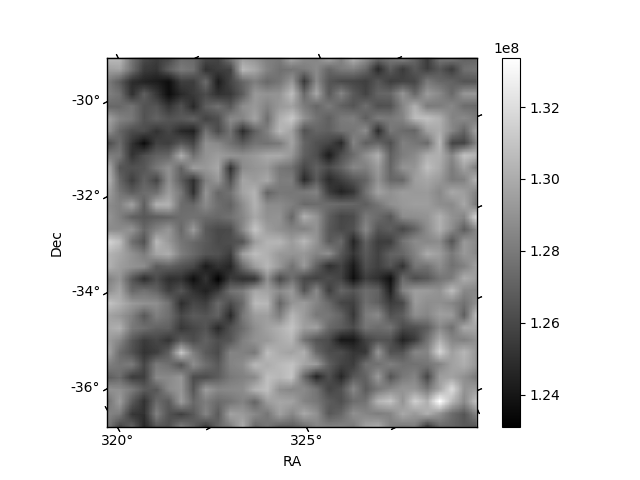
Histogram calculated using DETX and DETY for each event in the final _common_clean file
| Quadrant A | 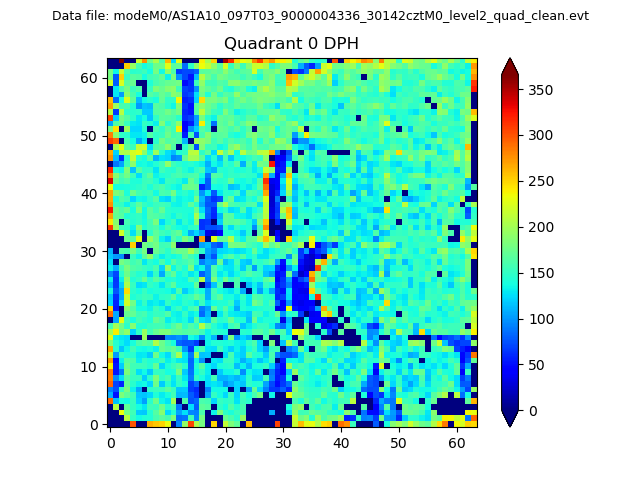 |
 |
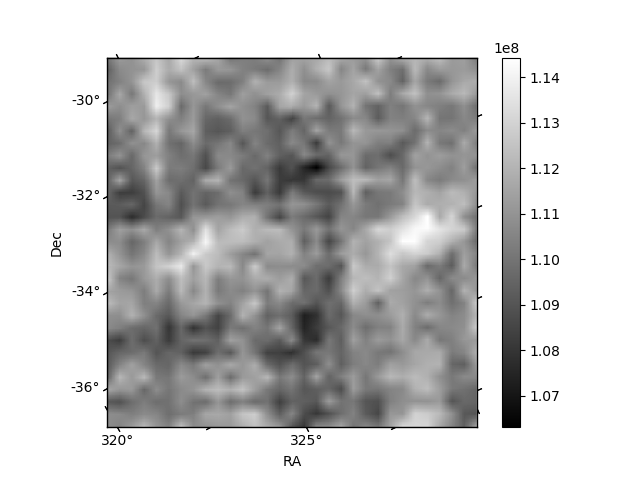
Quadrant B |
|---|---|---|---|
| Quadrant D | 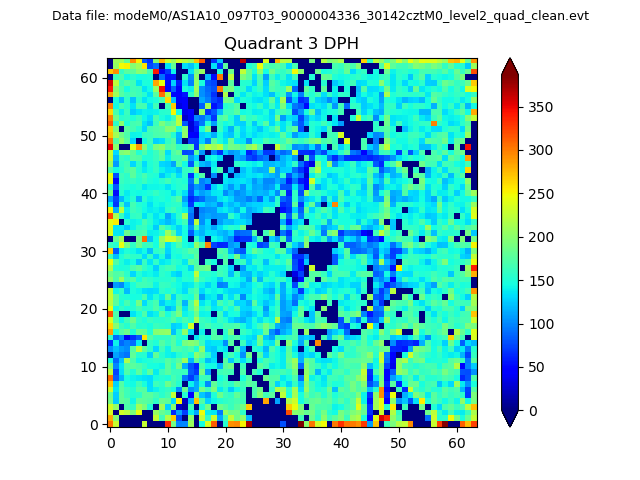 |
 |
Quadrant C |
| Plot type | Count rate plots | Images |
|---|---|---|
| Comparison with Poisson distribution Blue bars denote a histogram of data divided into 1 sec bins. Red curve is a Poisson curve with rate = median count rate of data. |
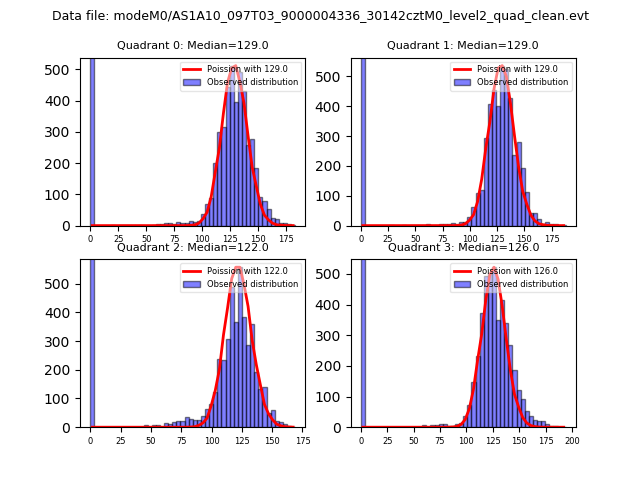 |
 |
| Quadrant-wise count rates Data is divided into 100 sec bins |
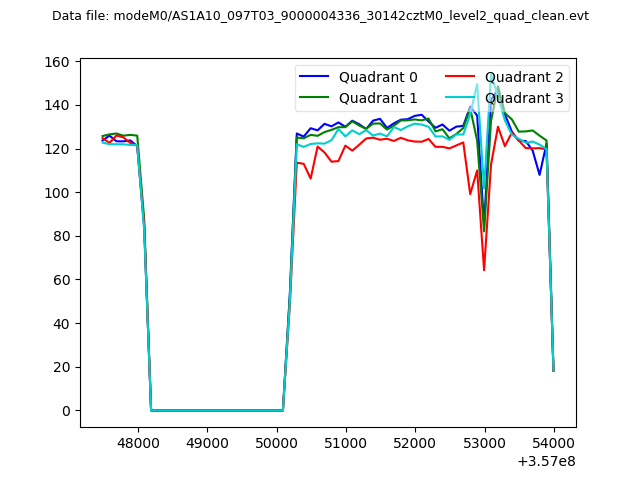 |
|
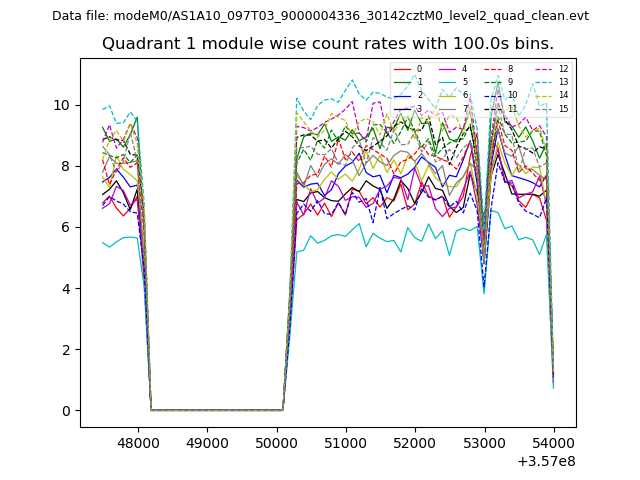
| Module-wise count rates for Quadrant A Data is divided into 100 sec bins |
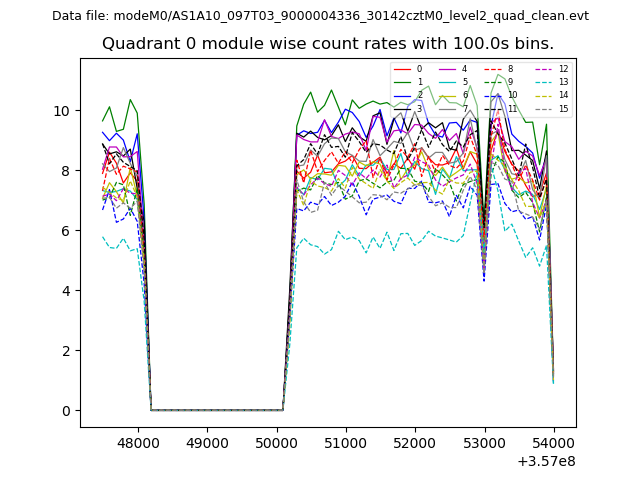 |
 |
| Module-wise count rates for Quadrant B Data is divided into 100 sec bins |
 |
 |
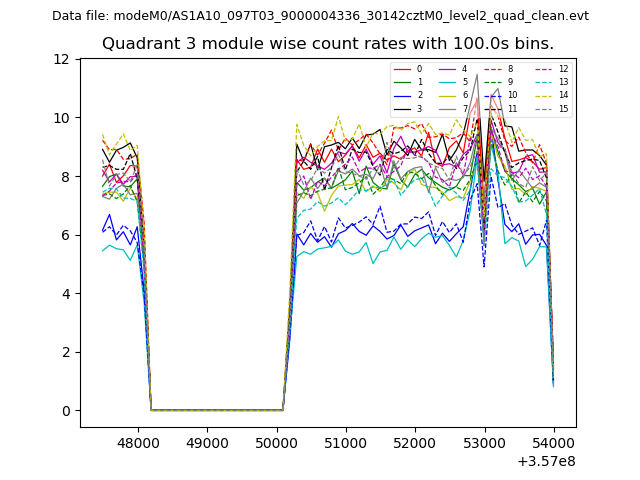
| Module-wise count rates for Quadrant C Data is divided into 100 sec bins |
 |
 |
| Module-wise count rates for Quadrant D Data is divided into 100 sec bins |
 |
 |
| Parameter | Plot |
|---|---|
| CZT HV Monitor |  |
| D_VDD | 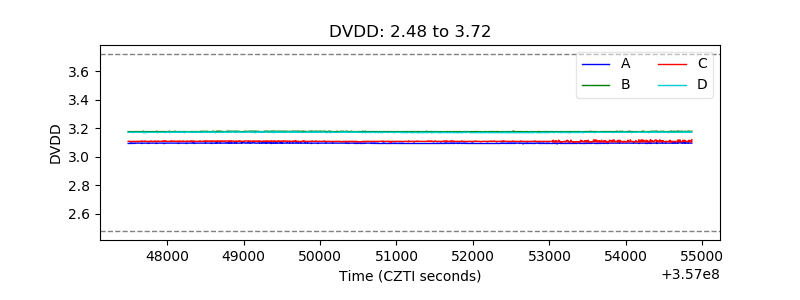 |
| Temperature 1 | 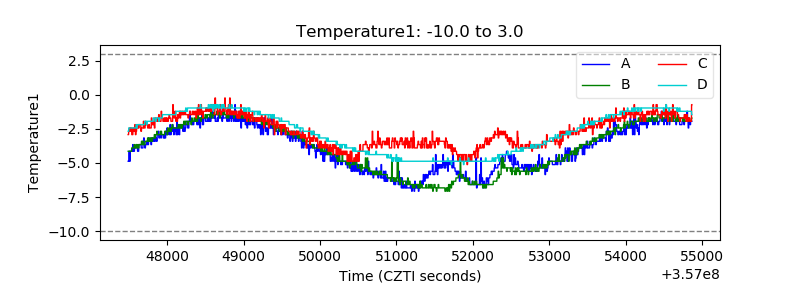 |
| Veto HV Monitor | 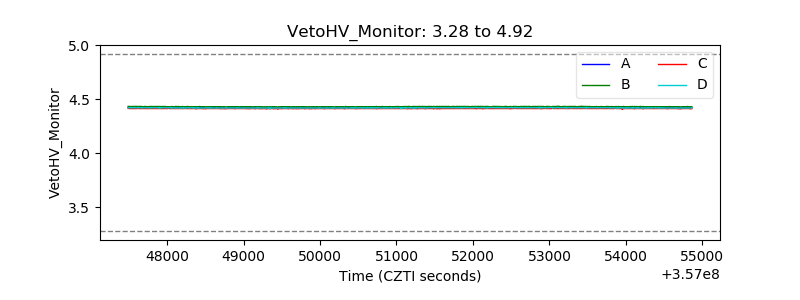 |
| Veto LLD | 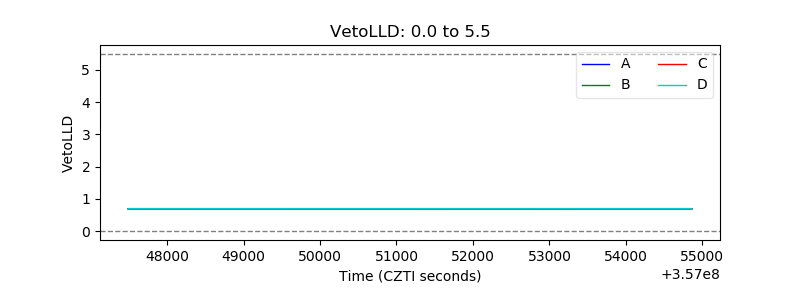 |
| Alpha Counter | 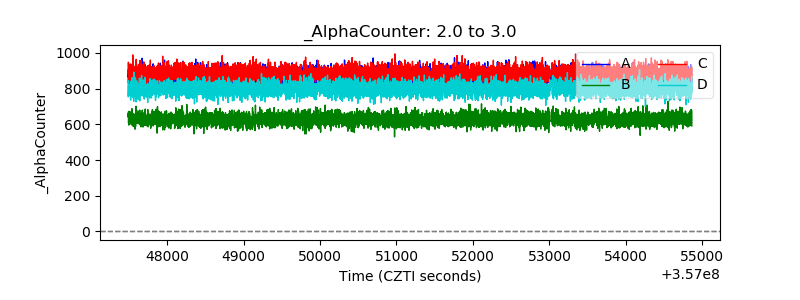 |
| _CPM_Rate | 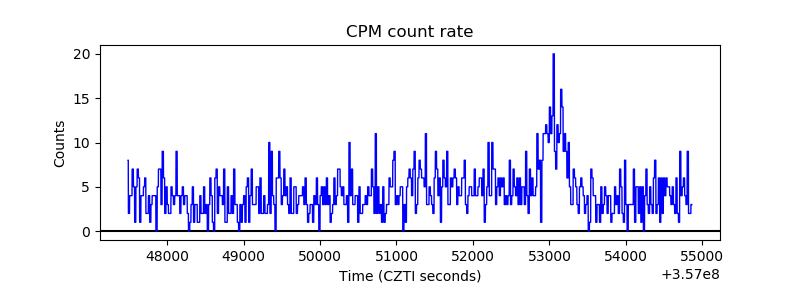 |
| CZT Counter | 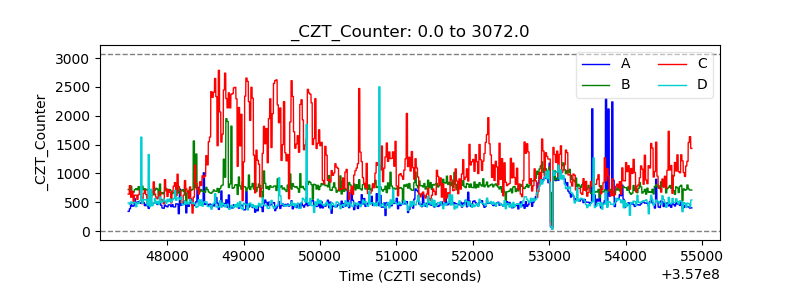 |
| +2.5 Volts monitor |  |
| +5 Volts monitor | 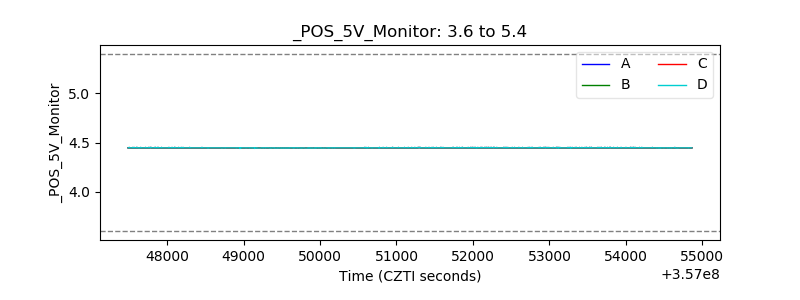 |
| _ROLL_ROT | 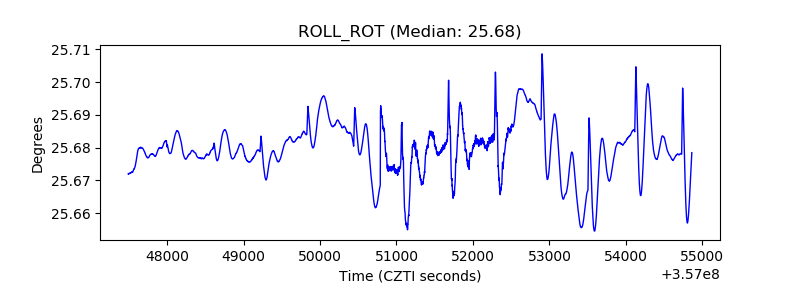 |
| _Roll_DEC | 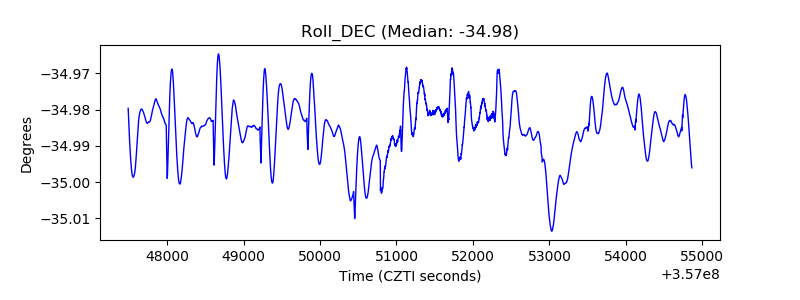 |
| _Roll_RA | 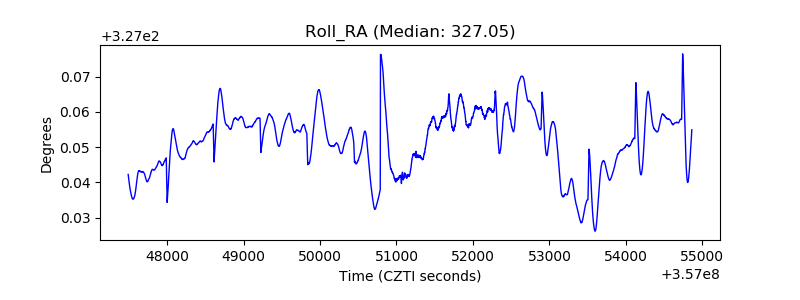 |
| Veto Counter | 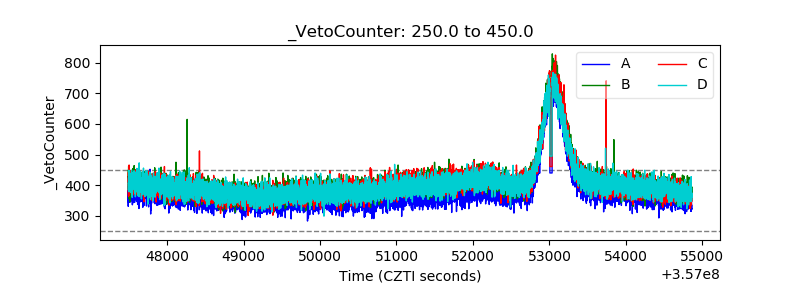 |