| Param | Original file | Final file |
|---|---|---|
| Filename | modeM0/AS1A10_097T03_9000004336_30143cztM0_level2.evt | modeM0/AS1A10_097T03_9000004336_30143cztM0_level2_quad_clean.evt |
| Size (bytes) | 703,972,800 | 76,426,560 |
| Size | 671.4 MB | 72.9 MB |
| Events in quadrant A | 3,582,610 | 473,125 |
| Events in quadrant B | 5,347,450 | 472,330 |
| Events in quadrant C | 7,772,207 | 416,871 |
| Events in quadrant D | 4,141,359 | 460,350 |
| Mode M9 | |||
|---|---|---|---|
| Quadrant | BADHDUFLAG | Total packets | Discarded packets |
| A | 0 | 4 | 0 |
| B | 0 | 4 | 0 |
| C | 0 | 4 | 0 |
| D | 0 | 4 | 0 |
| Mode SS | |||
|---|---|---|---|
| Quadrant | BADHDUFLAG | Total packets | Discarded packets |
| A | 0 | 142 | 0 |
| B | 0 | 142 | 0 |
| C | 0 | 142 | 0 |
| D | 0 | 142 | 0 |
| Mode M0 | |||
|---|---|---|---|
| Quadrant | BADHDUFLAG | Total packets | Discarded packets |
| A | 0 | 15190 | 1 |
| B | 0 | 21302 | 1 |
| C | 0 | 28164 | 1 |
| D | 0 | 16511 | 1 |
| Quadrant | Total seconds | Saturated seconds | Saturation percentage |
|---|---|---|---|
| A | 7055 | 148 | 2.097803% |
| B | 7055 | 119 | 1.686747% |
| C | 7055 | 1167 | 16.541460% |
| D | 7056 | 213 | 3.018707% |
Noise dominated data is calculated using 1-second bins in cleaned event files. If a bin has >2000 counts, and if more than 50% of those come from <1% of pixels, then it is considered to be noise-dominated and hence unusable.
| Quadrant | # 1 sec bins | Bins with >0 counts | Bins with >2000 counts | High rate bins dominated by noise | Noise dominated (total time) | Noise dominated (detector-on time) | Marked lightcurve |
|---|---|---|---|---|---|---|---|
| A | 7455 | 7056 | 46 | 46 | 0.62% | 0.65% | 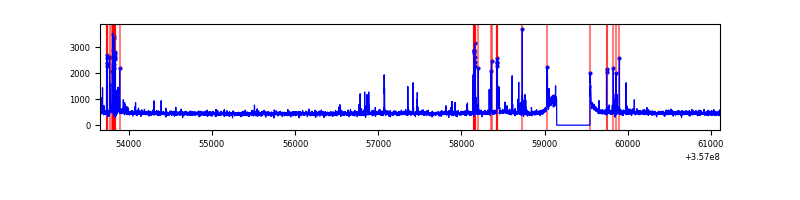 |
| B | 7455 | 7055 | 1 | 1 | 0.01% | 0.01% | 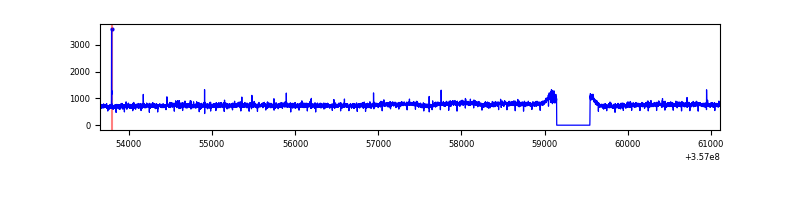 |
| C | 7455 | 7055 | 144 | 144 | 1.93% | 2.04% | 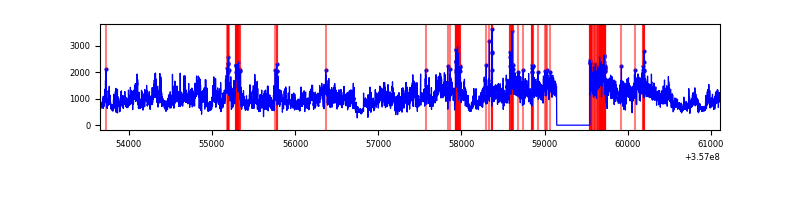 |
| D | 7456 | 7057 | 133 | 133 | 1.78% | 1.88% | 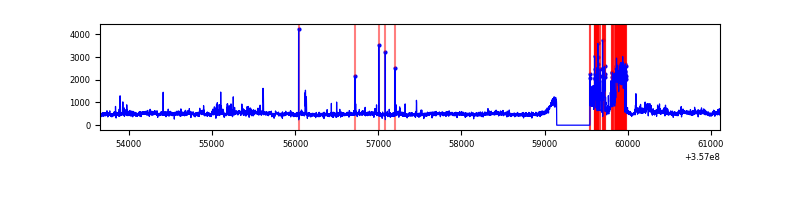 |
Top three noisy pixels from each quadrant. If the there are fewer than three noisy pixels in the level2.evt file, extra rows are filled as -1
| Pixel properties | Quadrant properties | ||||||
|---|---|---|---|---|---|---|---|
| Quadrant | DetID | PixID | Counts | Sigma | Mean | Median | Sigma |
| A | 0 | 13 | 284883 | 1651.08 | 851 | 832 | 172.0 |
| A | 13 | 254 | 13351 | 72.77 | 851 | 832 | 172.0 |
| A | 8 | 192 | 11833 | 63.94 | 851 | 832 | 172.0 |
| B | 6 | 159 | 2026613 | 12604.93 | 838 | 817 | 160.7 |
| B | 12 | 111 | 20100 | 119.98 | 838 | 817 | 160.7 |
| B | 11 | 111 | 18380 | 109.28 | 838 | 817 | 160.7 |
| C | 3 | 233 | 4294677 | 23525.02 | 770 | 774 | 182.5 |
| C | 14 | 238 | 260149 | 1421.04 | 770 | 774 | 182.5 |
| C | 14 | 254 | 184464 | 1006.38 | 770 | 774 | 182.5 |
| D | 13 | 104 | 382722 | 1863.05 | 822 | 801 | 205.0 |
| D | 8 | 195 | 358426 | 1744.53 | 822 | 801 | 205.0 |
| D | 12 | 33 | 59757 | 287.59 | 822 | 801 | 205.0 |
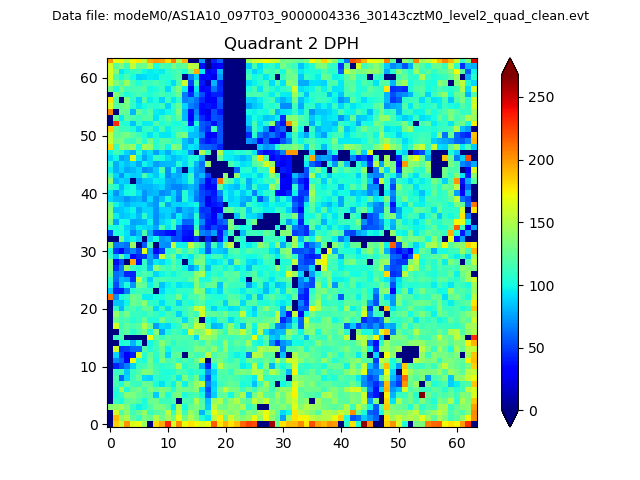
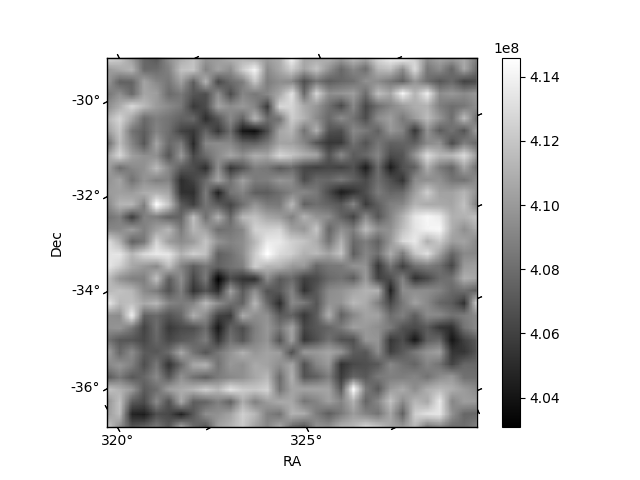
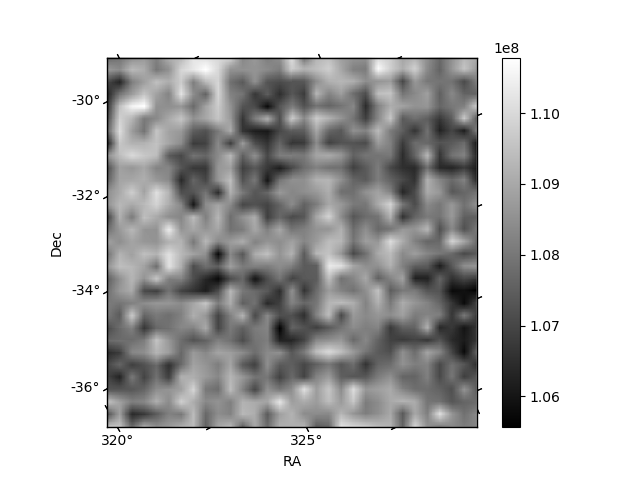
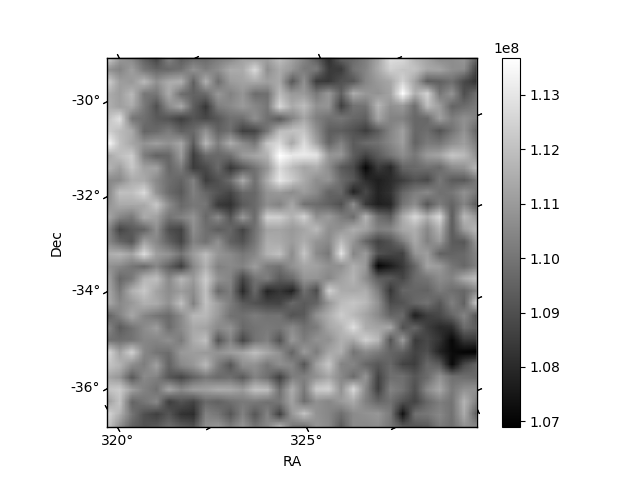
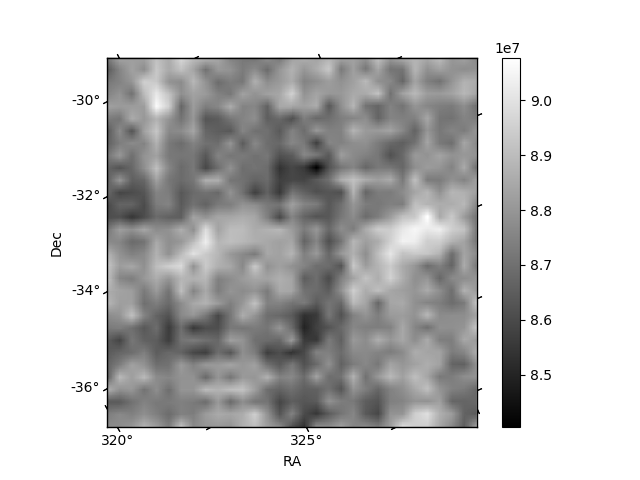
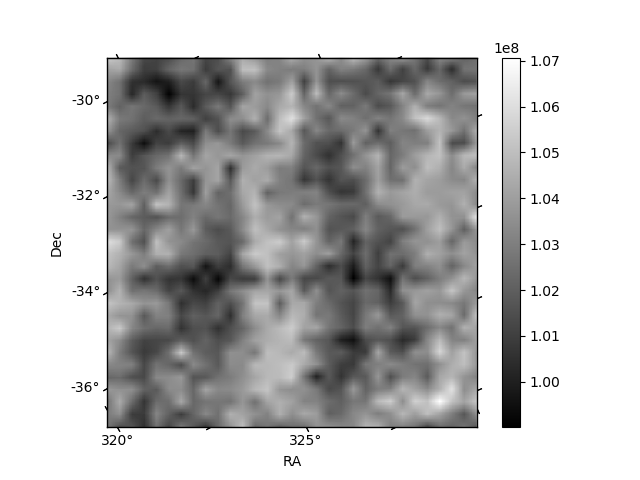
Histogram calculated using DETX and DETY for each event in the final _common_clean file
| Quadrant A | 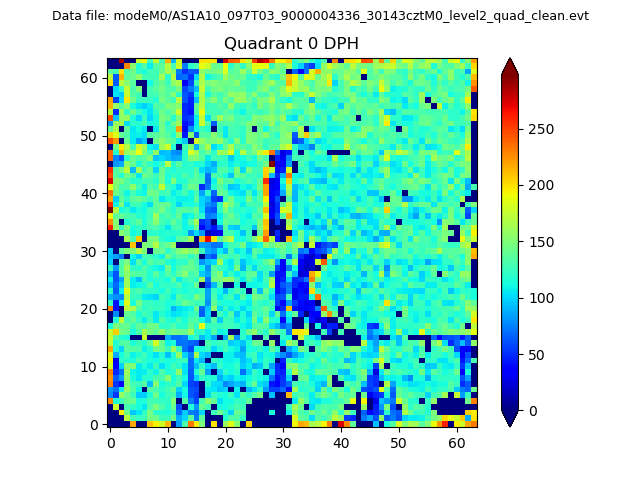 |
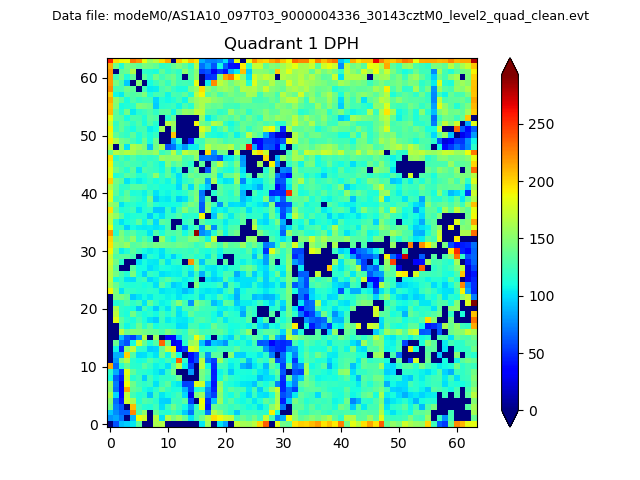 |
Quadrant B |
|---|---|---|---|
| Quadrant D | 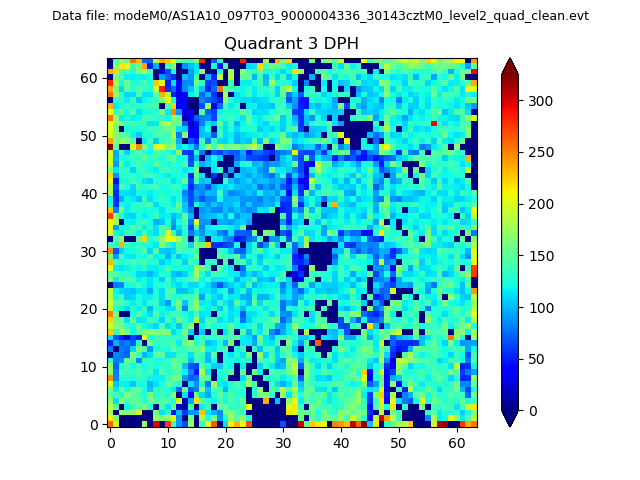 |
 |
Quadrant C |
| Plot type | Count rate plots | Images |
|---|---|---|
| Comparison with Poisson distribution Blue bars denote a histogram of data divided into 1 sec bins. Red curve is a Poisson curve with rate = median count rate of data. |
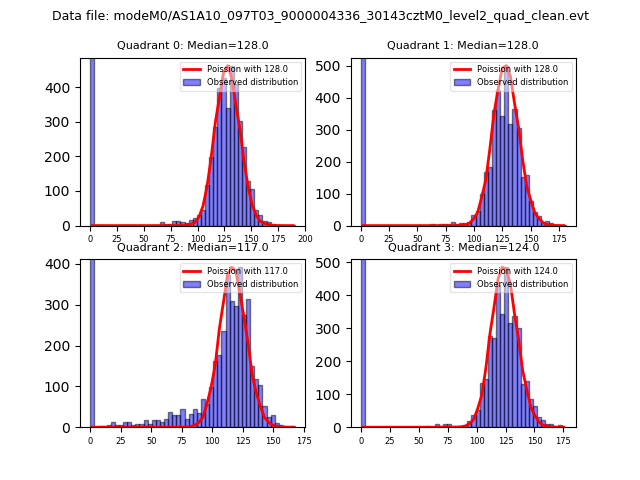 |
 |
| Quadrant-wise count rates Data is divided into 100 sec bins |
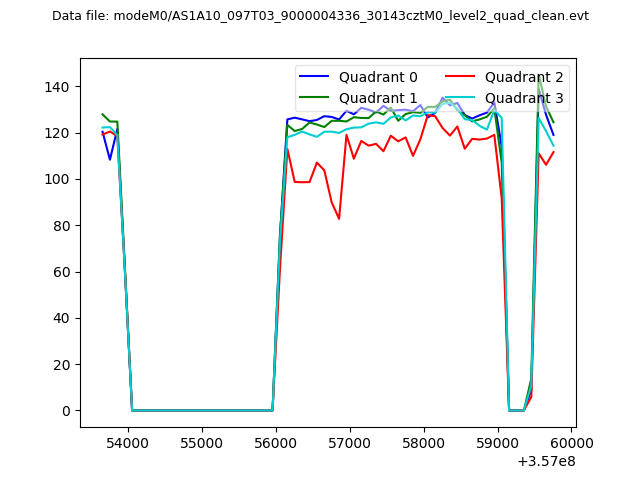 |
|
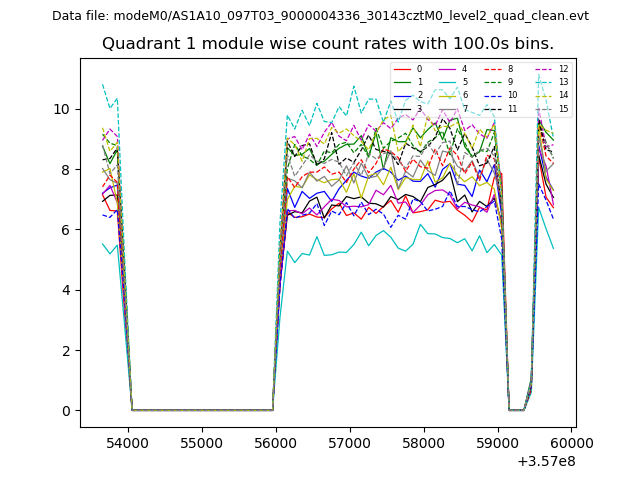
| Module-wise count rates for Quadrant A Data is divided into 100 sec bins |
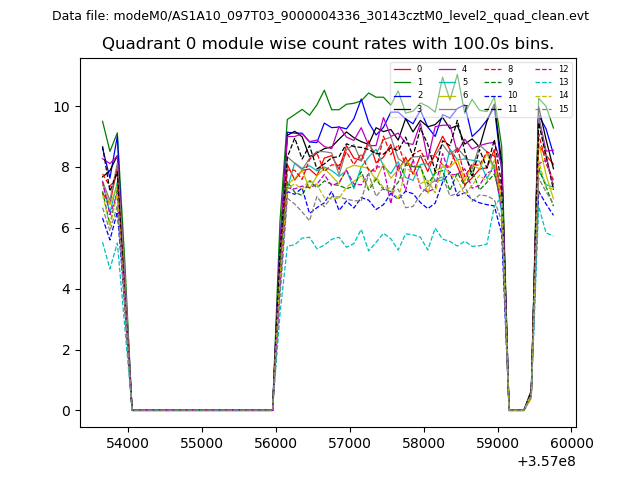 |
 |
| Module-wise count rates for Quadrant B Data is divided into 100 sec bins |
 |
 |
| Module-wise count rates for Quadrant C Data is divided into 100 sec bins |
 |
 |
| Module-wise count rates for Quadrant D Data is divided into 100 sec bins |
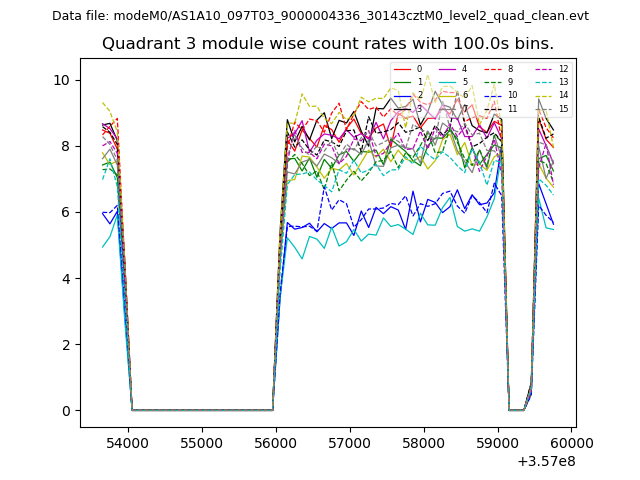 |
 |
| Parameter | Plot |
|---|---|
| CZT HV Monitor | 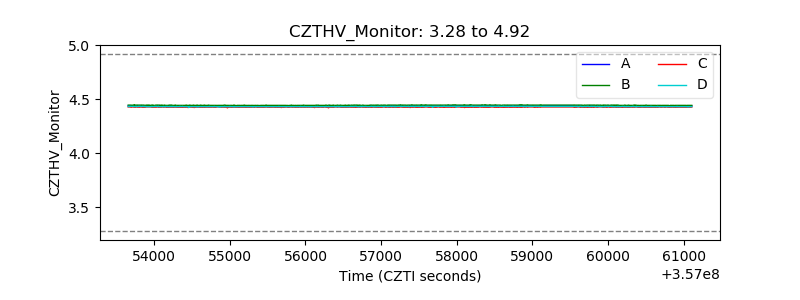 |
| D_VDD | 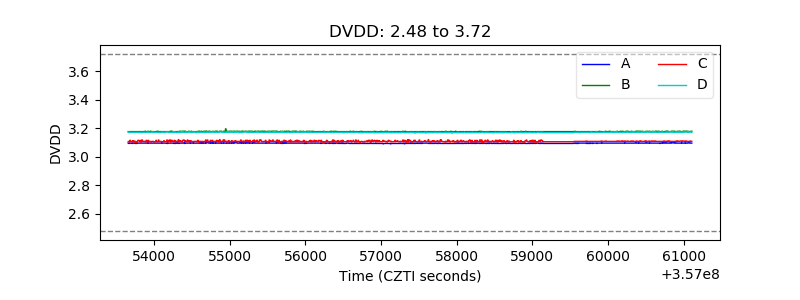 |
| Temperature 1 | 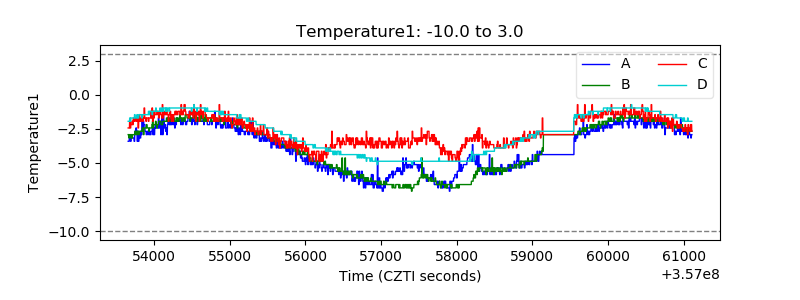 |
| Veto HV Monitor | 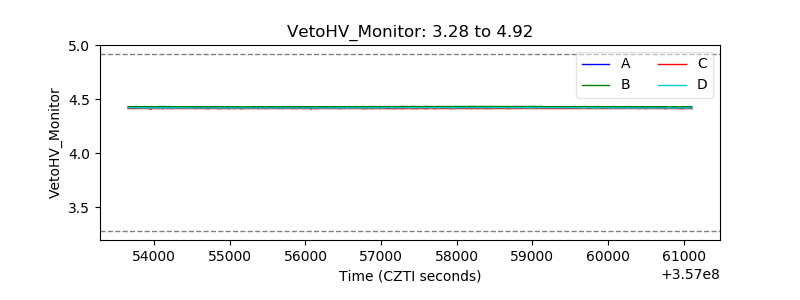 |
| Veto LLD | 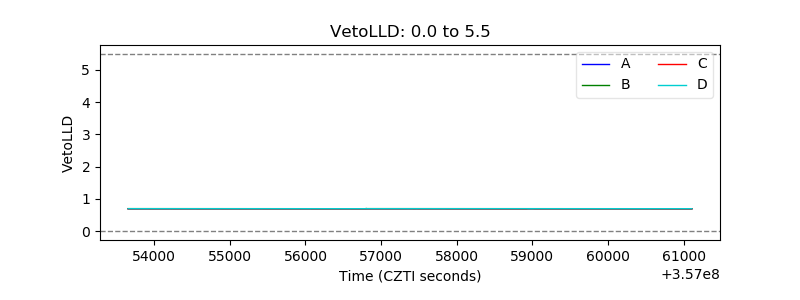 |
| Alpha Counter | 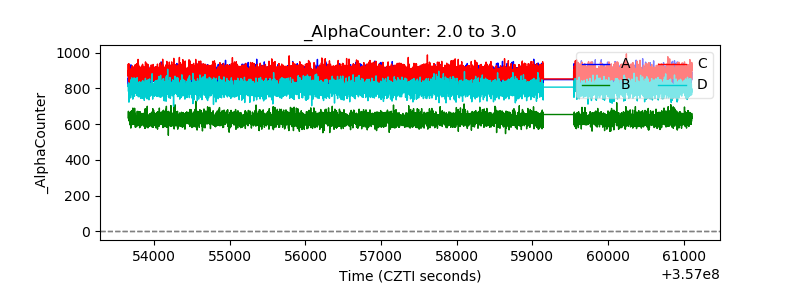 |
| _CPM_Rate | 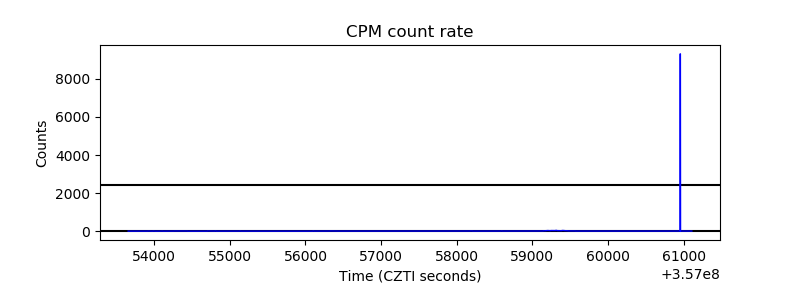 |
| CZT Counter | 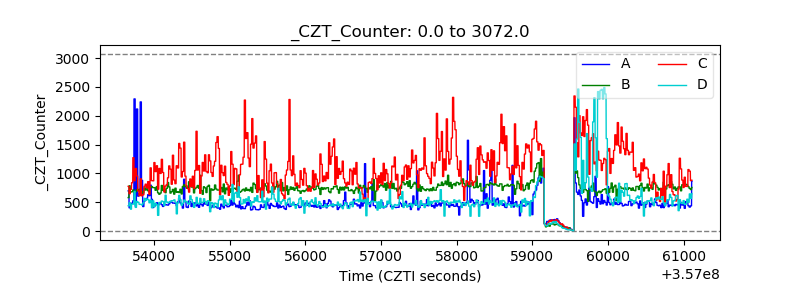 |
| +2.5 Volts monitor |  |
| +5 Volts monitor |  |
| _ROLL_ROT | 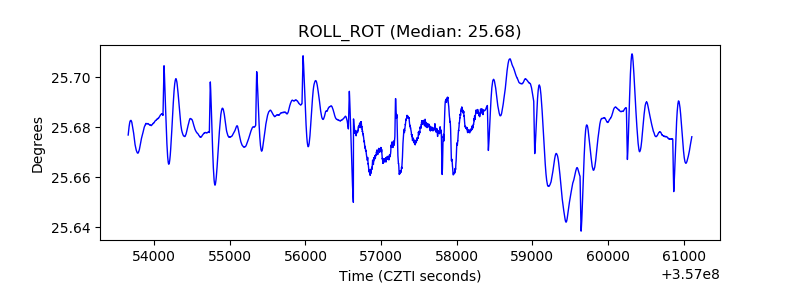 |
| _Roll_DEC | 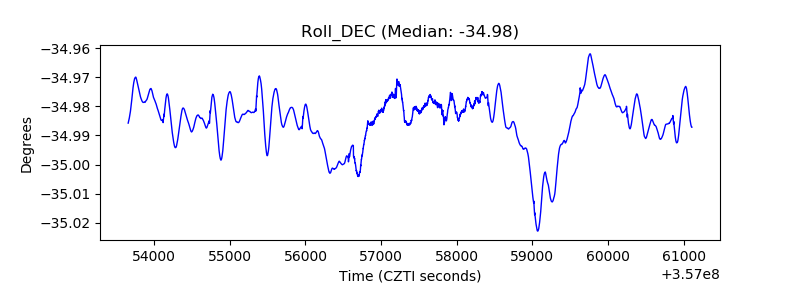 |
| _Roll_RA | 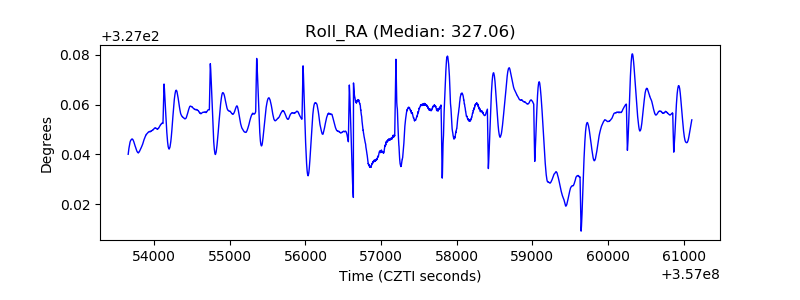 |
| Veto Counter | 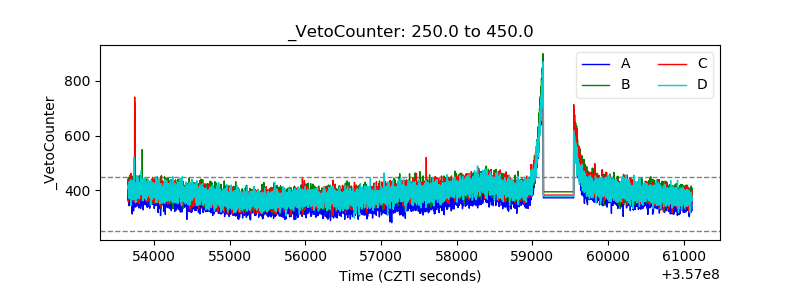 |