| Param | Original file | Final file |
|---|---|---|
| Filename | modeM0/AS1A10_097T03_9000004336_30145cztM0_level2.evt | modeM0/AS1A10_097T03_9000004336_30145cztM0_level2_quad_clean.evt |
| Size (bytes) | 1,245,240,000 | 138,720,960 |
| Size | 1.2 GB | 132.3 MB |
| Events in quadrant A | 6,155,549 | 883,715 |
| Events in quadrant B | 9,435,214 | 872,305 |
| Events in quadrant C | 15,030,395 | 744,547 |
| Events in quadrant D | 6,268,570 | 855,801 |
| Mode M9 | |||
|---|---|---|---|
| Quadrant | BADHDUFLAG | Total packets | Discarded packets |
| A | 0 | 14 | 0 |
| B | 0 | 14 | 0 |
| C | 0 | 14 | 0 |
| D | 0 | 14 | 0 |
| Mode SS | |||
|---|---|---|---|
| Quadrant | BADHDUFLAG | Total packets | Discarded packets |
| A | 0 | 246 | 0 |
| B | 0 | 246 | 0 |
| C | 0 | 246 | 0 |
| D | 0 | 246 | 0 |
| Mode M0 | |||
|---|---|---|---|
| Quadrant | BADHDUFLAG | Total packets | Discarded packets |
| A | 0 | 26152 | 2 |
| B | 0 | 37001 | 2 |
| C | 0 | 53087 | 2 |
| D | 0 | 26219 | 2 |
| Quadrant | Total seconds | Saturated seconds | Saturation percentage |
|---|---|---|---|
| A | 12207 | 206 | 1.687556% |
| B | 12208 | 187 | 1.531782% |
| C | 12208 | 3900 | 31.946265% |
| D | 12208 | 93 | 0.761796% |
Noise dominated data is calculated using 1-second bins in cleaned event files. If a bin has >2000 counts, and if more than 50% of those come from <1% of pixels, then it is considered to be noise-dominated and hence unusable.
| Quadrant | # 1 sec bins | Bins with >0 counts | Bins with >2000 counts | High rate bins dominated by noise | Noise dominated (total time) | Noise dominated (detector-on time) | Marked lightcurve |
|---|---|---|---|---|---|---|---|
| A | 13562 | 12207 | 76 | 76 | 0.56% | 0.62% | 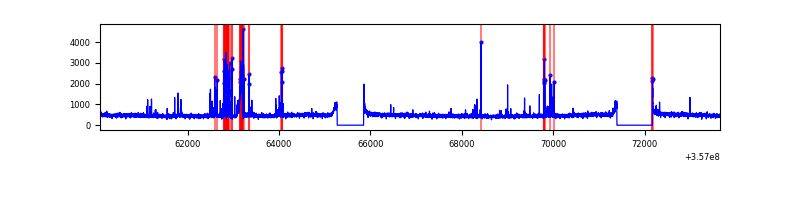 |
| B | 13563 | 12209 | 2 | 2 | 0.01% | 0.02% | 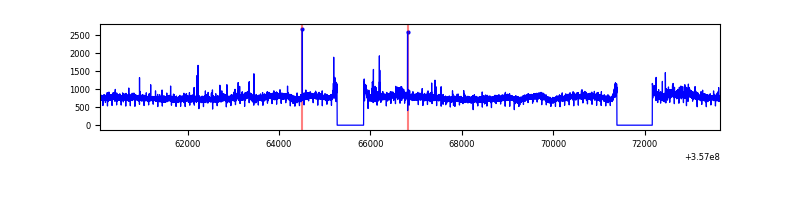 |
| C | 13563 | 12208 | 1209 | 1209 | 8.91% | 9.90% | 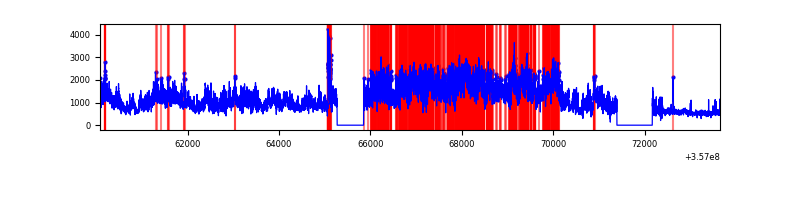 |
| D | 13563 | 12210 | 16 | 16 | 0.12% | 0.13% | 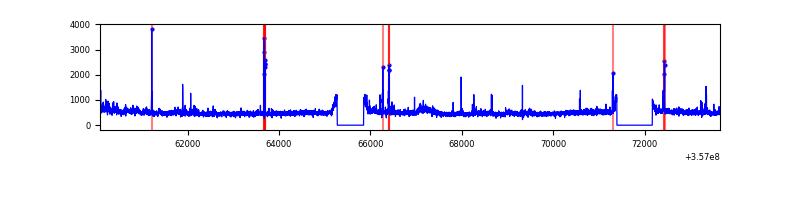 |
Top three noisy pixels from each quadrant. If the there are fewer than three noisy pixels in the level2.evt file, extra rows are filled as -1
| Pixel properties | Quadrant properties | ||||||
|---|---|---|---|---|---|---|---|
| Quadrant | DetID | PixID | Counts | Sigma | Mean | Median | Sigma |
| A | 0 | 13 | 455331 | 1531.63 | 1471 | 1440 | 296.3 |
| A | 8 | 192 | 23494 | 74.42 | 1471 | 1440 | 296.3 |
| A | 13 | 254 | 23289 | 73.73 | 1471 | 1440 | 296.3 |
| B | 6 | 159 | 3600126 | 12848.77 | 1452 | 1414 | 280.1 |
| B | 0 | 190 | 58132 | 202.5 | 1452 | 1414 | 280.1 |
| B | 12 | 111 | 34936 | 119.69 | 1452 | 1414 | 280.1 |
| C | 3 | 233 | 9012159 | 30638.78 | 1263 | 1271 | 294.1 |
| C | 14 | 238 | 516796 | 1752.89 | 1263 | 1271 | 294.1 |
| C | 14 | 254 | 443933 | 1505.14 | 1263 | 1271 | 294.1 |
| D | 8 | 195 | 428078 | 1213.24 | 1429 | 1397 | 351.7 |
| D | 12 | 227 | 109055 | 306.12 | 1429 | 1397 | 351.7 |
| D | 13 | 168 | 86561 | 242.16 | 1429 | 1397 | 351.7 |
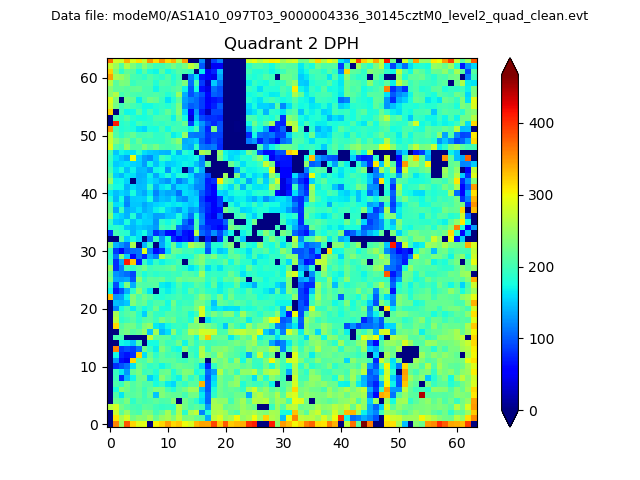
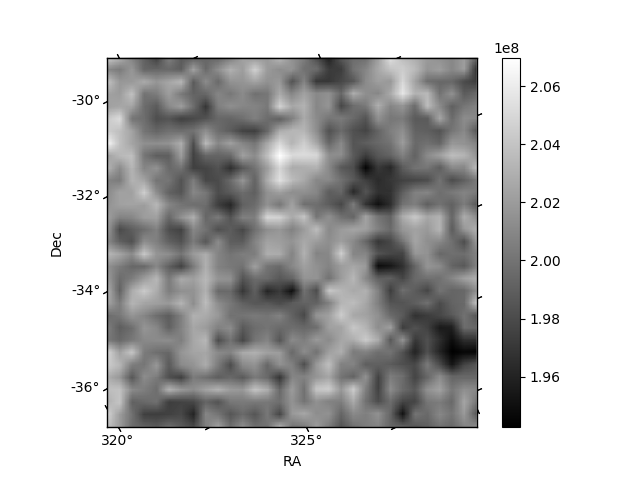
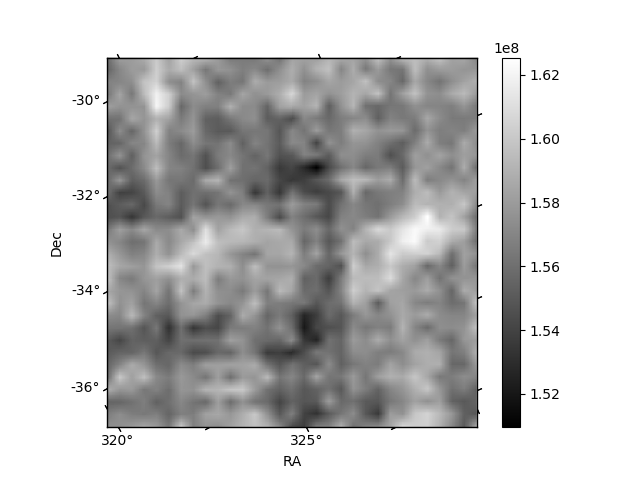
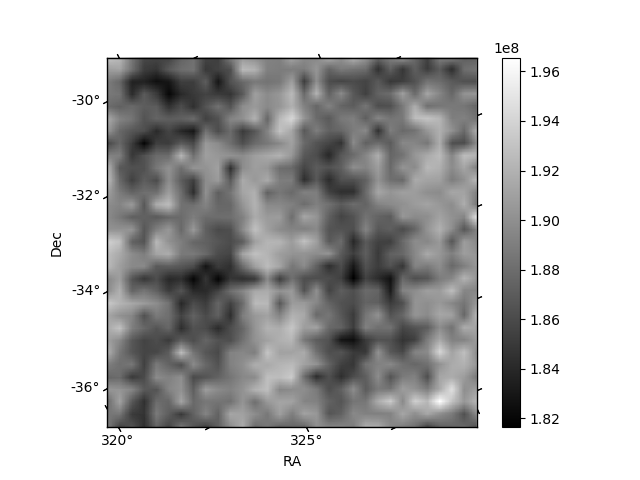
Histogram calculated using DETX and DETY for each event in the final _common_clean file
| Quadrant A | 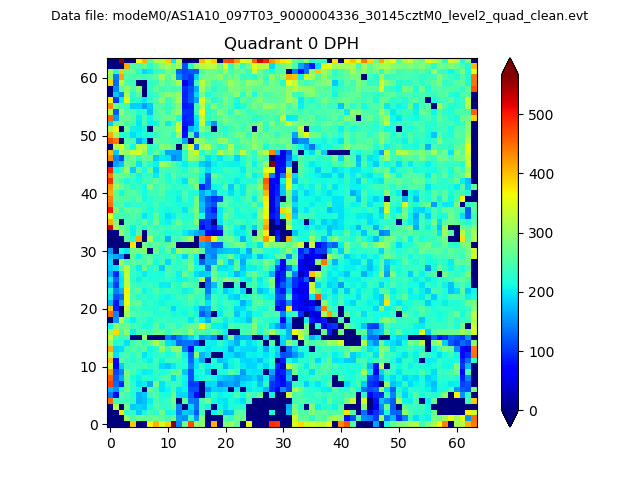 |
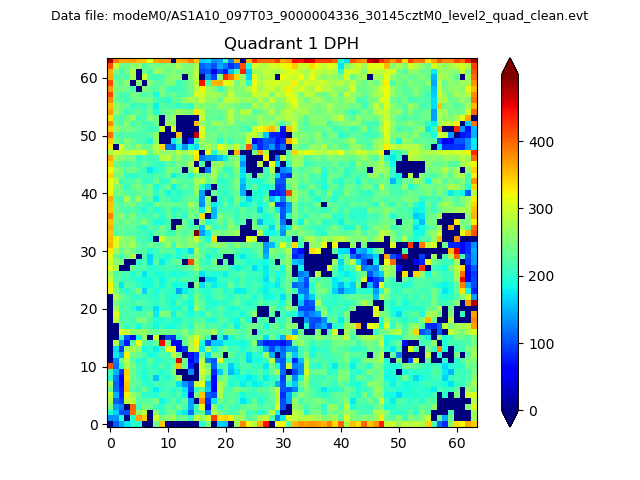 |
Quadrant B |
|---|---|---|---|
| Quadrant D | 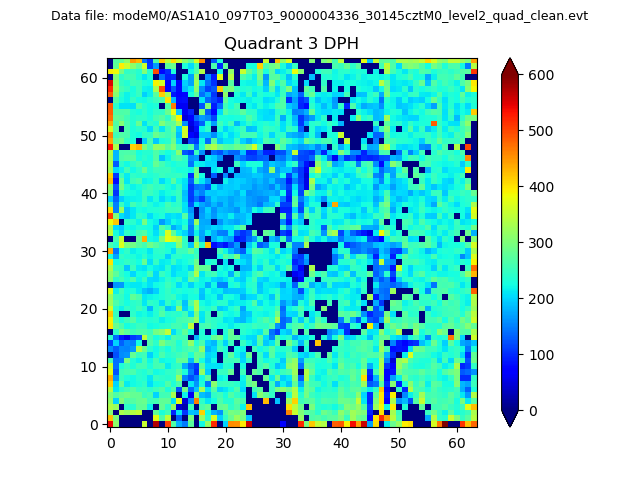 |
 |
Quadrant C |
| Plot type | Count rate plots | Images |
|---|---|---|
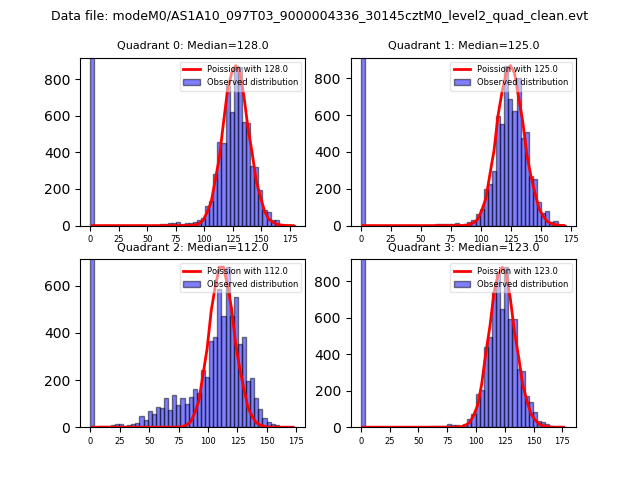
| Comparison with Poisson distribution Blue bars denote a histogram of data divided into 1 sec bins. Red curve is a Poisson curve with rate = median count rate of data. |
 |
 |
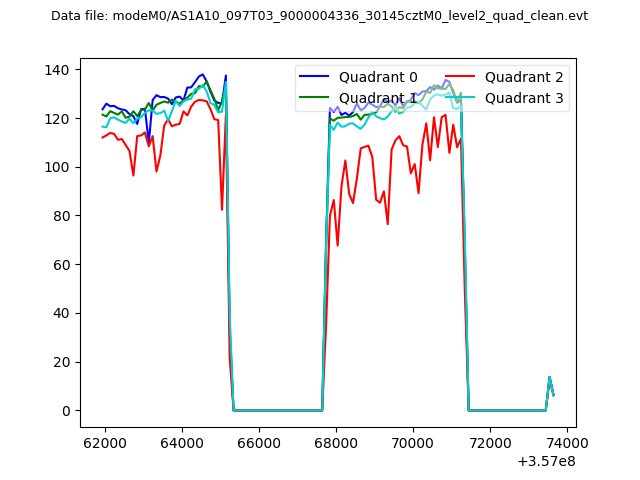
| Quadrant-wise count rates Data is divided into 100 sec bins |
 |
|
| Module-wise count rates for Quadrant A Data is divided into 100 sec bins |
 |
 |
| Module-wise count rates for Quadrant B Data is divided into 100 sec bins |
 |
 |
| Module-wise count rates for Quadrant C Data is divided into 100 sec bins |
 |
 |
| Module-wise count rates for Quadrant D Data is divided into 100 sec bins |
 |
 |
| Parameter | Plot |
|---|---|
| CZT HV Monitor |  |
| D_VDD | 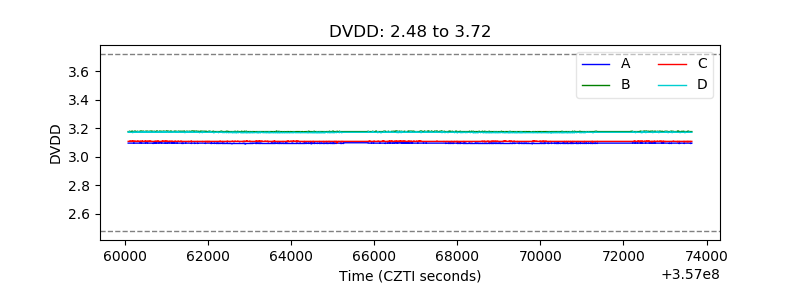 |
| Temperature 1 | 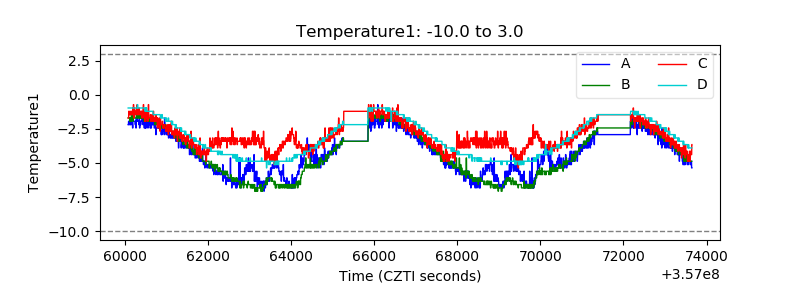 |
| Veto HV Monitor | 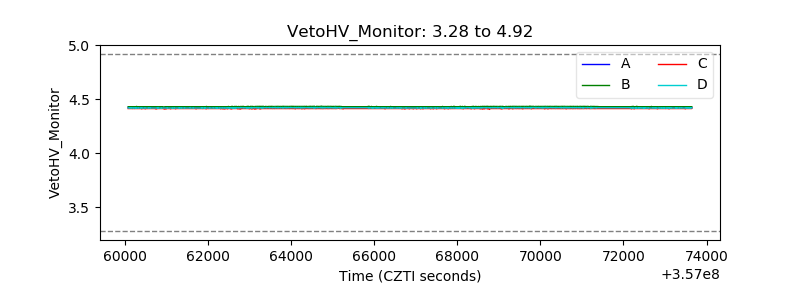 |
| Veto LLD |  |
| Alpha Counter | 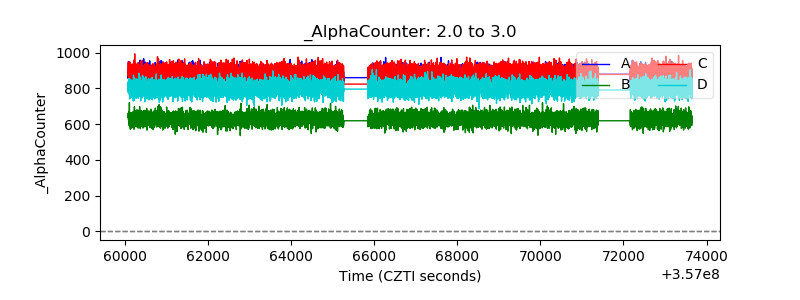 |
| _CPM_Rate | 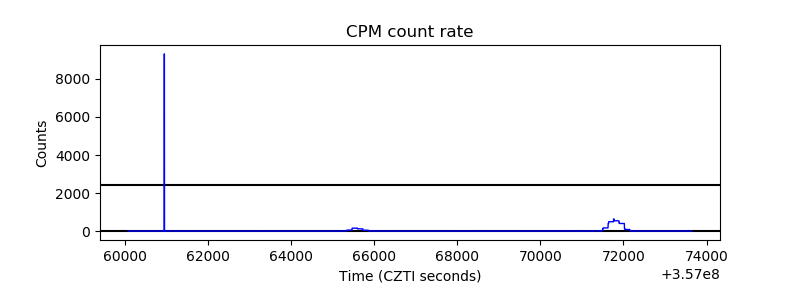 |
| CZT Counter | 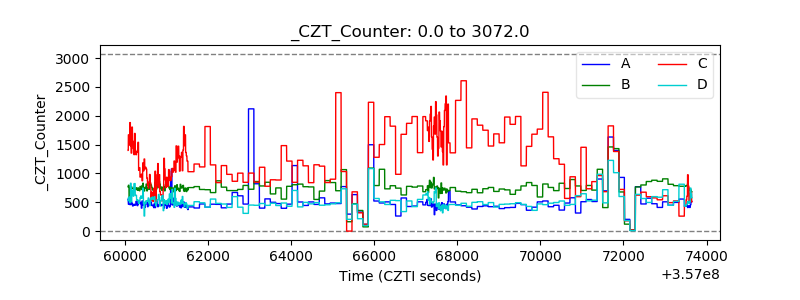 |
| +2.5 Volts monitor |  |
| +5 Volts monitor | 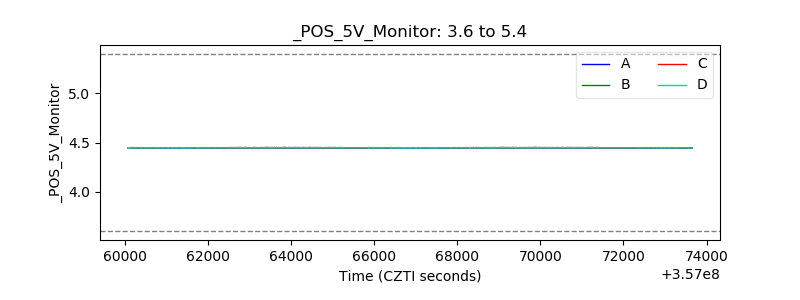 |
| _ROLL_ROT |  |
| _Roll_DEC | 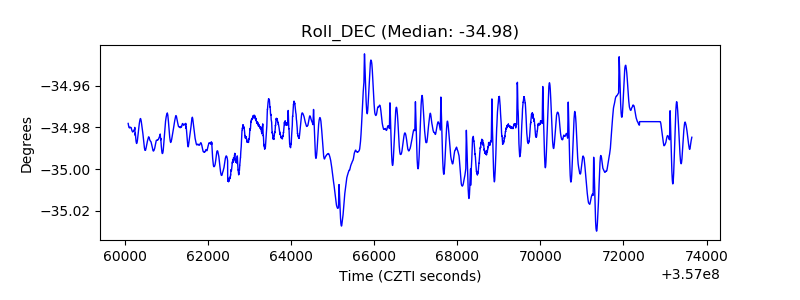 |
| _Roll_RA | 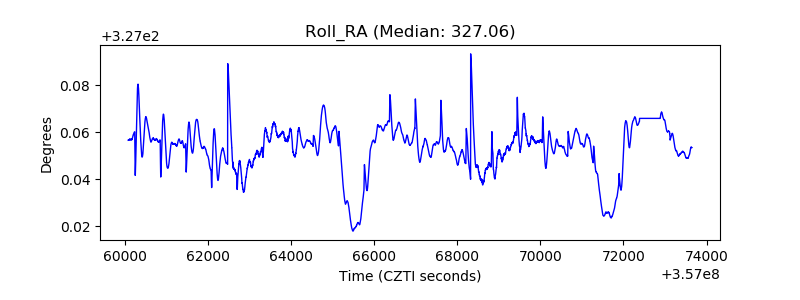 |
| Veto Counter |  |