| Param | Original file | Final file |
|---|---|---|
| Filename | modeM0/AS1A10_097T03_9000004336_30147cztM0_level2.evt | modeM0/AS1A10_097T03_9000004336_30147cztM0_level2_quad_clean.evt |
| Size (bytes) | 557,544,960 | 92,341,440 |
| Size | 531.7 MB | 88.1 MB |
| Events in quadrant A | 3,267,503 | 601,523 |
| Events in quadrant B | 5,138,504 | 598,001 |
| Events in quadrant C | 4,521,042 | 566,467 |
| Events in quadrant D | 3,517,571 | 576,433 |
| Mode M9 | |||
|---|---|---|---|
| Quadrant | BADHDUFLAG | Total packets | Discarded packets |
| A | 0 | 13 | 0 |
| B | 0 | 14 | 0 |
| C | 0 | 14 | 0 |
| D | 0 | 14 | 0 |
| Mode SS | |||
|---|---|---|---|
| Quadrant | BADHDUFLAG | Total packets | Discarded packets |
| A | 0 | 132 | 0 |
| B | 0 | 132 | 0 |
| C | 0 | 132 | 0 |
| D | 0 | 132 | 0 |
| Mode M0 | |||
|---|---|---|---|
| Quadrant | BADHDUFLAG | Total packets | Discarded packets |
| A | 0 | 13848 | 2 |
| B | 0 | 19815 | 2 |
| C | 0 | 18076 | 2 |
| D | 0 | 14566 | 2 |
| Quadrant | Total seconds | Saturated seconds | Saturation percentage |
|---|---|---|---|
| A | 6510 | 79 | 1.213518% |
| B | 6509 | 90 | 1.382701% |
| C | 6509 | 393 | 6.037794% |
| D | 6509 | 49 | 0.752804% |
Noise dominated data is calculated using 1-second bins in cleaned event files. If a bin has >2000 counts, and if more than 50% of those come from <1% of pixels, then it is considered to be noise-dominated and hence unusable.
| Quadrant | # 1 sec bins | Bins with >0 counts | Bins with >2000 counts | High rate bins dominated by noise | Noise dominated (total time) | Noise dominated (detector-on time) | Marked lightcurve |
|---|---|---|---|---|---|---|---|
| A | 7600 | 6511 | 6 | 6 | 0.08% | 0.09% | 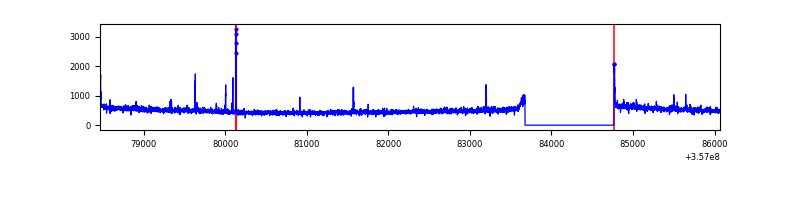 |
| B | 7599 | 6509 | 1 | 1 | 0.01% | 0.02% | 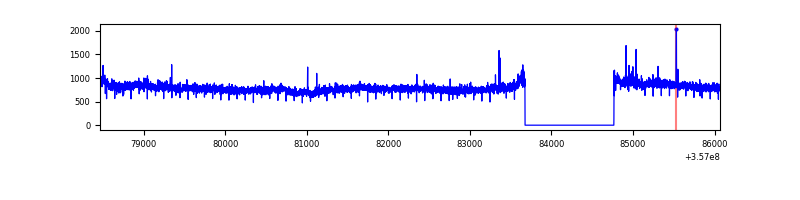 |
| C | 7599 | 6509 | 14 | 14 | 0.18% | 0.22% | 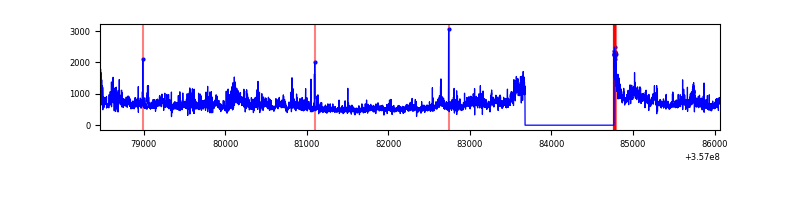 |
| D | 7599 | 6510 | 11 | 11 | 0.14% | 0.17% | 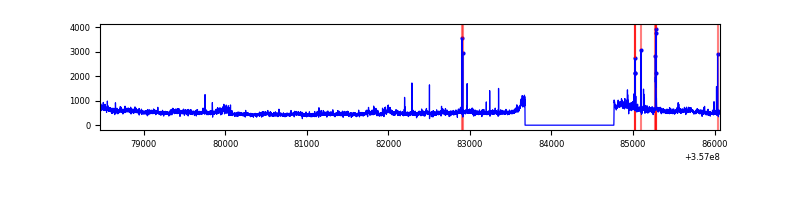 |
Top three noisy pixels from each quadrant. If the there are fewer than three noisy pixels in the level2.evt file, extra rows are filled as -1
| Pixel properties | Quadrant properties | ||||||
|---|---|---|---|---|---|---|---|
| Quadrant | DetID | PixID | Counts | Sigma | Mean | Median | Sigma |
| A | 0 | 13 | 53770 | 319.16 | 826 | 810 | 165.9 |
| A | 8 | 192 | 26487 | 154.74 | 826 | 810 | 165.9 |
| A | 13 | 254 | 12377 | 69.71 | 826 | 810 | 165.9 |
| B | 6 | 159 | 1890429 | 12108.42 | 816 | 796 | 156.1 |
| B | 0 | 190 | 31593 | 197.34 | 816 | 796 | 156.1 |
| B | 12 | 111 | 18722 | 114.87 | 816 | 796 | 156.1 |
| C | 3 | 233 | 1170902 | 6466.98 | 778 | 785 | 180.9 |
| C | 14 | 238 | 191119 | 1051.93 | 778 | 785 | 180.9 |
| C | 14 | 254 | 95869 | 525.51 | 778 | 785 | 180.9 |
| D | 8 | 195 | 182363 | 918.38 | 801 | 783 | 197.7 |
| D | 12 | 227 | 167922 | 845.34 | 801 | 783 | 197.7 |
| D | 13 | 168 | 40297 | 199.85 | 801 | 783 | 197.7 |
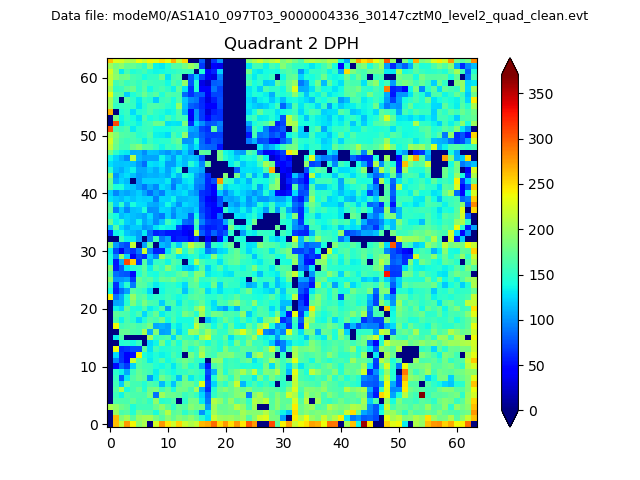
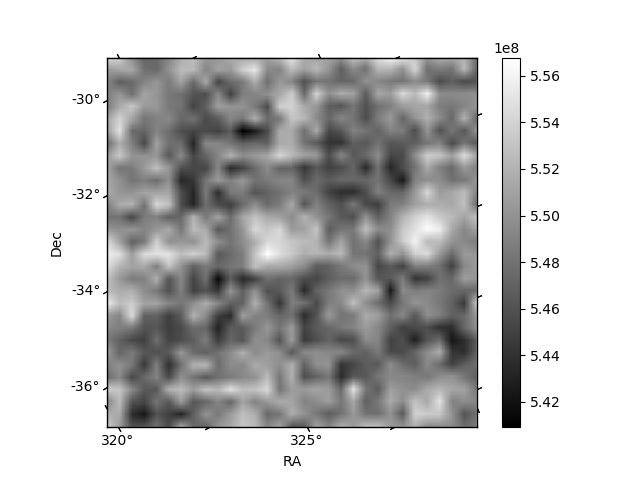
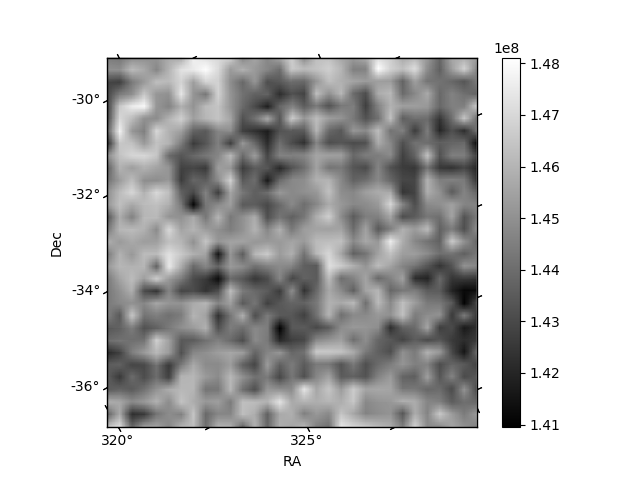
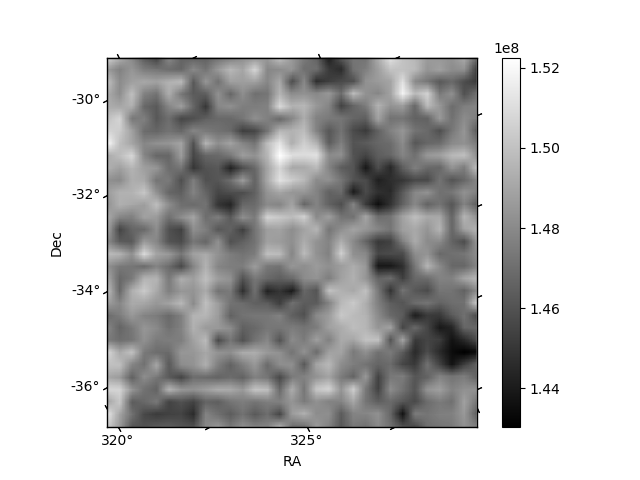
Histogram calculated using DETX and DETY for each event in the final _common_clean file
| Quadrant A | 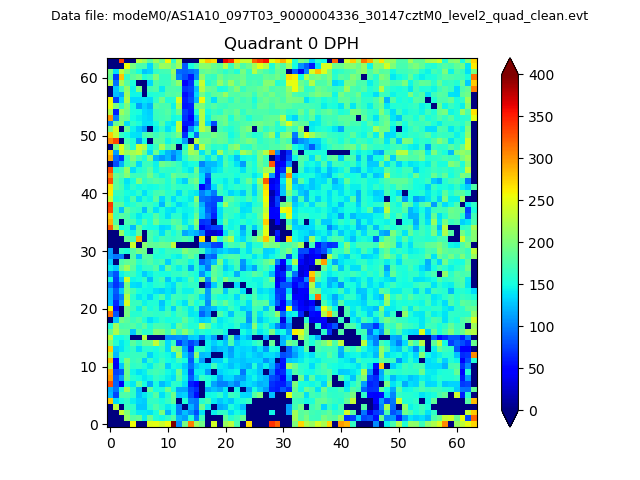 |
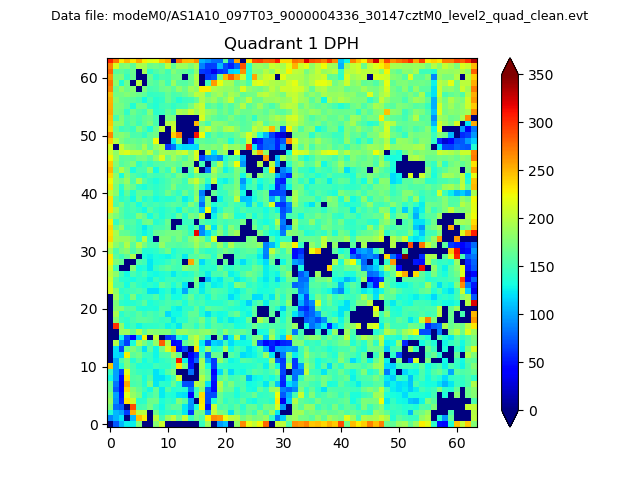 |
Quadrant B |
|---|---|---|---|
| Quadrant D | 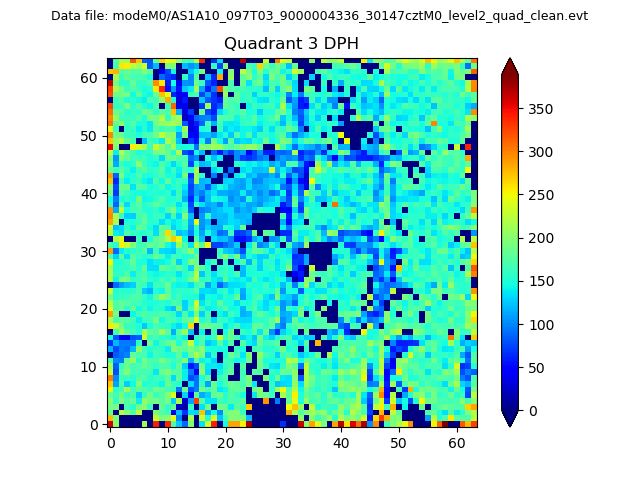 |
 |
Quadrant C |
| Plot type | Count rate plots | Images |
|---|---|---|
| Comparison with Poisson distribution Blue bars denote a histogram of data divided into 1 sec bins. Red curve is a Poisson curve with rate = median count rate of data. |
 |
 |
| Quadrant-wise count rates Data is divided into 100 sec bins |
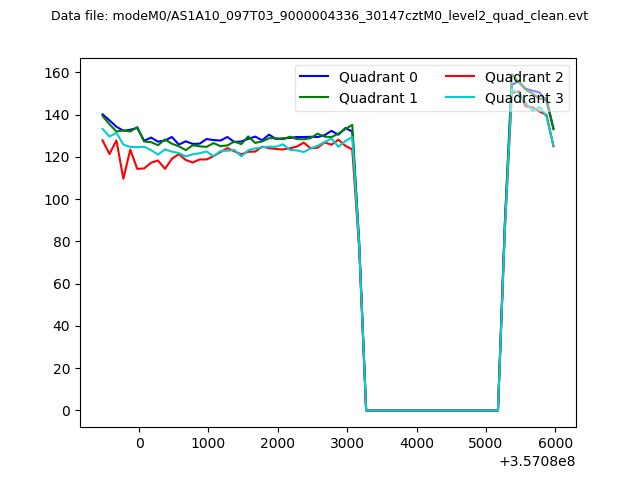 |
|
| Module-wise count rates for Quadrant A Data is divided into 100 sec bins |
 |
 |
| Module-wise count rates for Quadrant B Data is divided into 100 sec bins |
 |
 |
| Module-wise count rates for Quadrant C Data is divided into 100 sec bins |
 |
 |
| Module-wise count rates for Quadrant D Data is divided into 100 sec bins |
 |
 |
| Parameter | Plot |
|---|---|
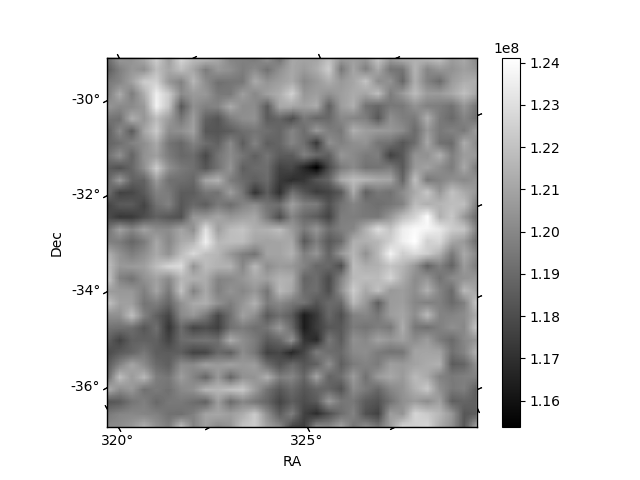
| CZT HV Monitor |  |
| D_VDD | 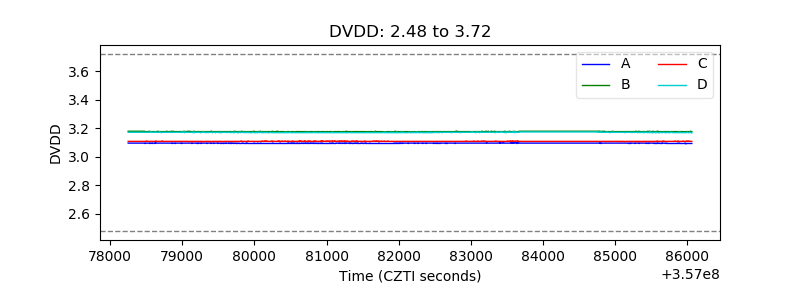 |
| Temperature 1 | 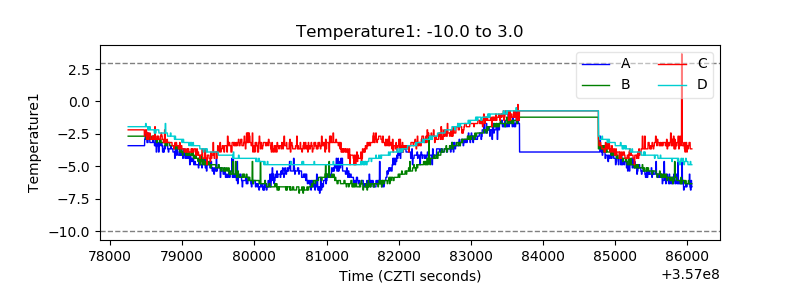 |
| Veto HV Monitor | 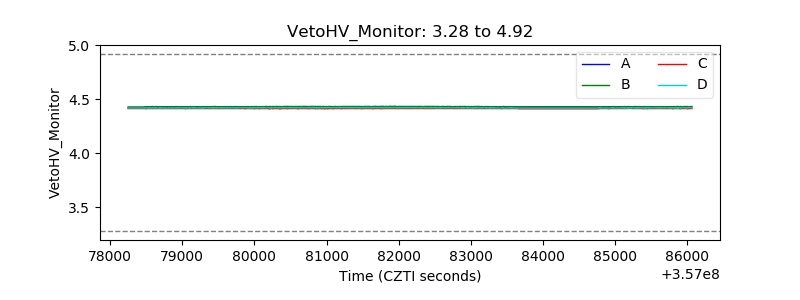 |
| Veto LLD | 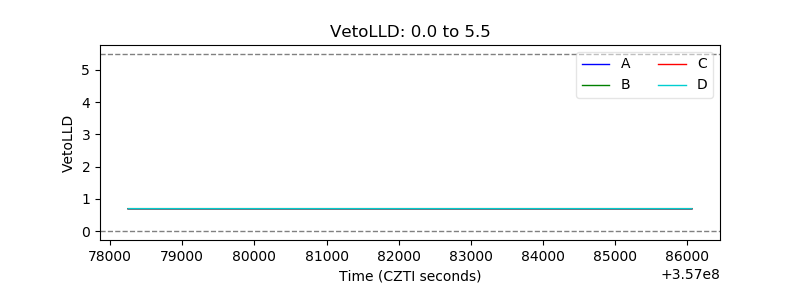 |
| Alpha Counter | 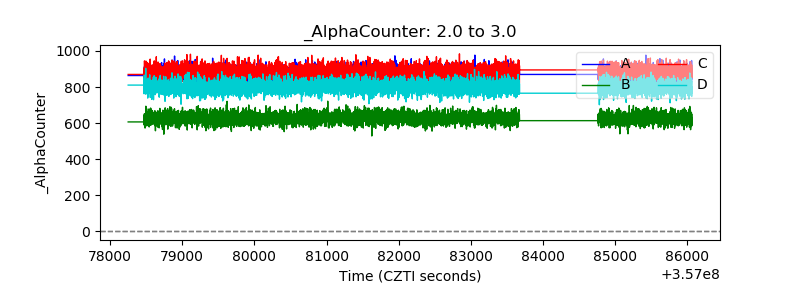 |
| _CPM_Rate | 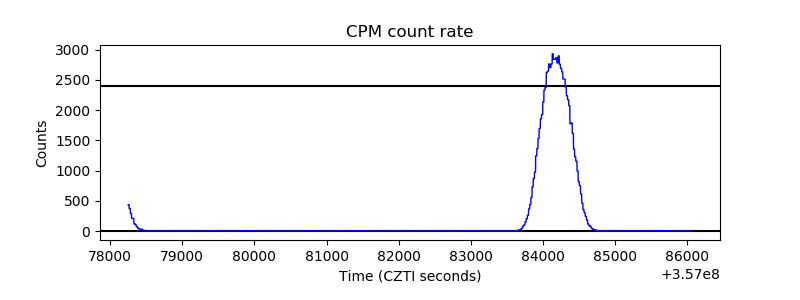 |
| CZT Counter | 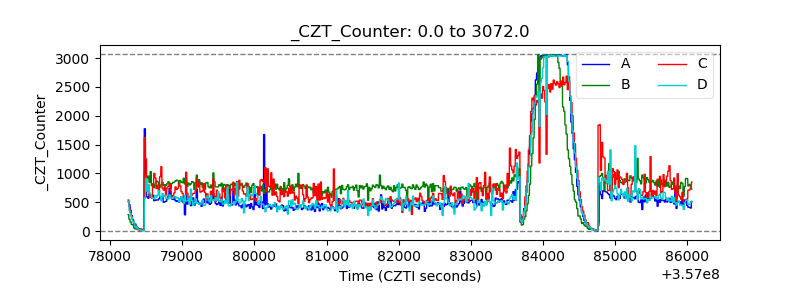 |
| +2.5 Volts monitor | 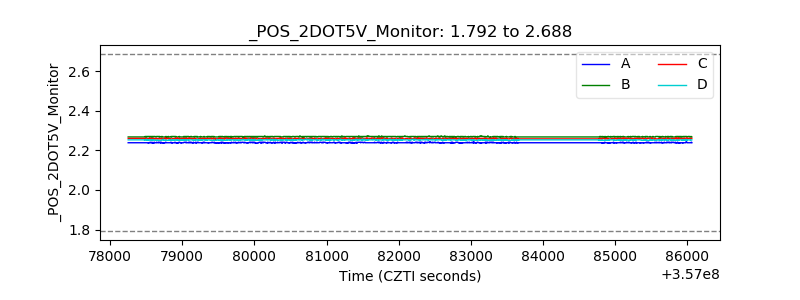 |
| +5 Volts monitor |  |
| _ROLL_ROT |  |
| _Roll_DEC | 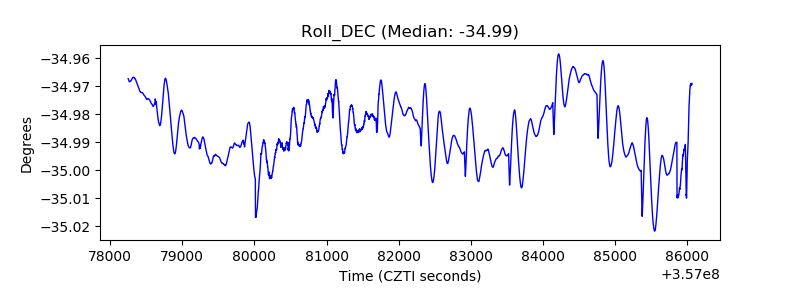 |
| _Roll_RA | 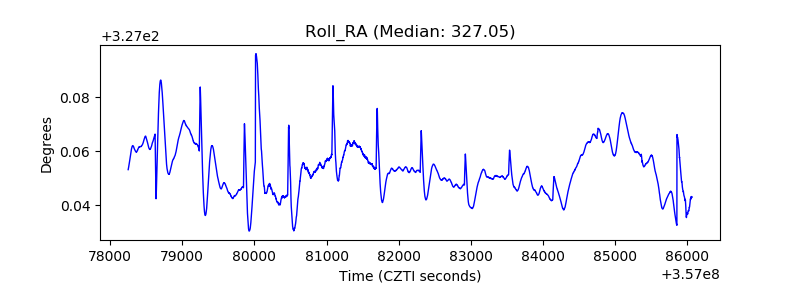 |
| Veto Counter | 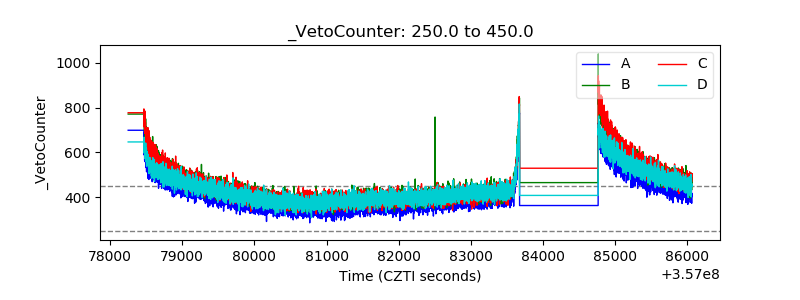 |