| Param | Original file | Final file |
|---|---|---|
| Filename | modeM0/AS1A10_097T03_9000004336_30149cztM0_level2.evt | modeM0/AS1A10_097T03_9000004336_30149cztM0_level2_quad_clean.evt |
| Size (bytes) | 566,729,280 | 107,101,440 |
| Size | 540.5 MB | 102.1 MB |
| Events in quadrant A | 3,318,280 | 711,114 |
| Events in quadrant B | 5,187,977 | 715,197 |
| Events in quadrant C | 4,425,959 | 682,330 |
| Events in quadrant D | 3,800,391 | 690,800 |
| Mode M9 | |||
|---|---|---|---|
| Quadrant | BADHDUFLAG | Total packets | Discarded packets |
| A | 0 | 19 | 0 |
| B | 0 | 20 | 0 |
| C | 0 | 20 | 0 |
| D | 0 | 20 | 0 |
| Mode SS | |||
|---|---|---|---|
| Quadrant | BADHDUFLAG | Total packets | Discarded packets |
| A | 0 | 128 | 0 |
| B | 0 | 128 | 0 |
| C | 0 | 128 | 0 |
| D | 0 | 128 | 0 |
| Mode M0 | |||
|---|---|---|---|
| Quadrant | BADHDUFLAG | Total packets | Discarded packets |
| A | 0 | 13942 | 2 |
| B | 0 | 19658 | 2 |
| C | 0 | 17641 | 2 |
| D | 0 | 15509 | 2 |
| Quadrant | Total seconds | Saturated seconds | Saturation percentage |
|---|---|---|---|
| A | 6371 | 46 | 0.722022% |
| B | 6371 | 91 | 1.428347% |
| C | 6371 | 462 | 7.251609% |
| D | 6370 | 38 | 0.596546% |
Noise dominated data is calculated using 1-second bins in cleaned event files. If a bin has >2000 counts, and if more than 50% of those come from <1% of pixels, then it is considered to be noise-dominated and hence unusable.
| Quadrant | # 1 sec bins | Bins with >0 counts | Bins with >2000 counts | High rate bins dominated by noise | Noise dominated (total time) | Noise dominated (detector-on time) | Marked lightcurve |
|---|---|---|---|---|---|---|---|
| A | 7561 | 6372 | 3 | 3 | 0.04% | 0.05% | 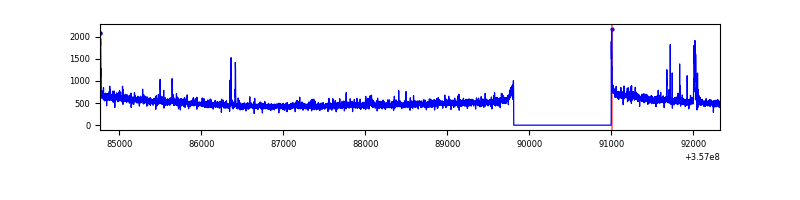 |
| B | 7561 | 6372 | 1 | 1 | 0.01% | 0.02% | 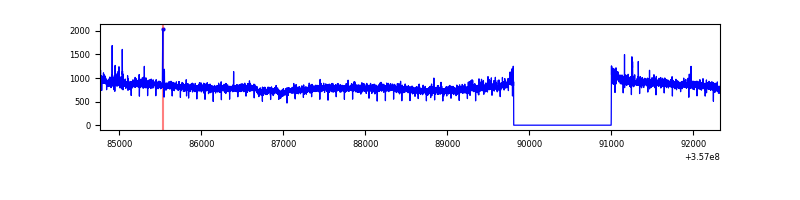 |
| C | 7561 | 6372 | 25 | 25 | 0.33% | 0.39% | 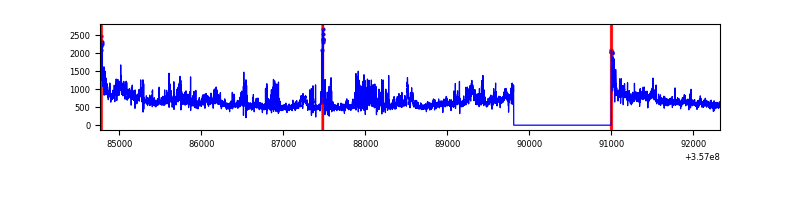 |
| D | 7560 | 6371 | 12 | 12 | 0.16% | 0.19% | 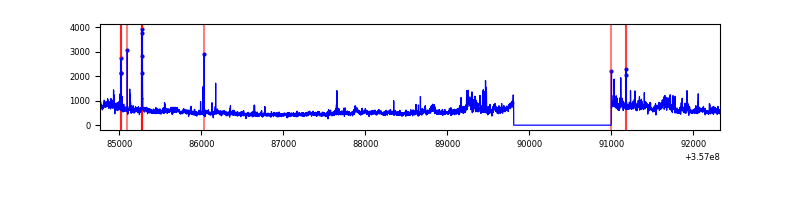 |
Top three noisy pixels from each quadrant. If the there are fewer than three noisy pixels in the level2.evt file, extra rows are filled as -1
| Pixel properties | Quadrant properties | ||||||
|---|---|---|---|---|---|---|---|
| Quadrant | DetID | PixID | Counts | Sigma | Mean | Median | Sigma |
| A | 0 | 13 | 77965 | 464.13 | 833 | 818 | 166.2 |
| A | 8 | 192 | 26055 | 151.83 | 833 | 818 | 166.2 |
| A | 13 | 254 | 11726 | 65.62 | 833 | 818 | 166.2 |
| B | 6 | 159 | 1890651 | 12114.45 | 828 | 808 | 156.0 |
| B | 0 | 190 | 34092 | 213.36 | 828 | 808 | 156.0 |
| B | 12 | 111 | 18680 | 114.56 | 828 | 808 | 156.0 |
| C | 3 | 233 | 874139 | 4697.87 | 799 | 806 | 185.9 |
| C | 14 | 238 | 232257 | 1245.03 | 799 | 806 | 185.9 |
| C | 14 | 254 | 142149 | 760.32 | 799 | 806 | 185.9 |
| D | 12 | 227 | 390001 | 1922.96 | 816 | 800 | 202.4 |
| D | 8 | 195 | 150593 | 740.09 | 816 | 800 | 202.4 |
| D | 7 | 1 | 42478 | 205.92 | 816 | 800 | 202.4 |
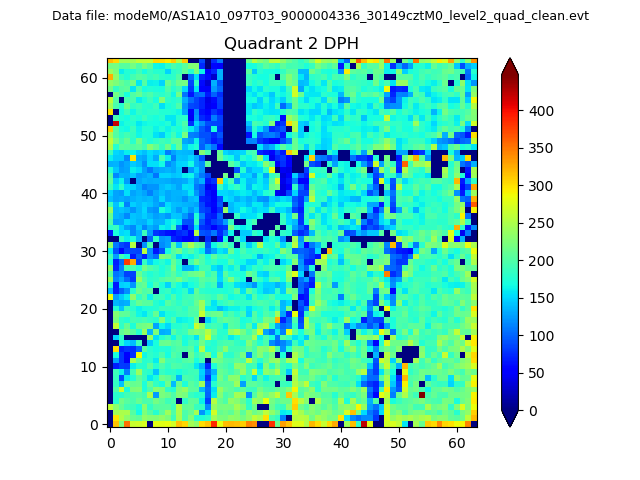
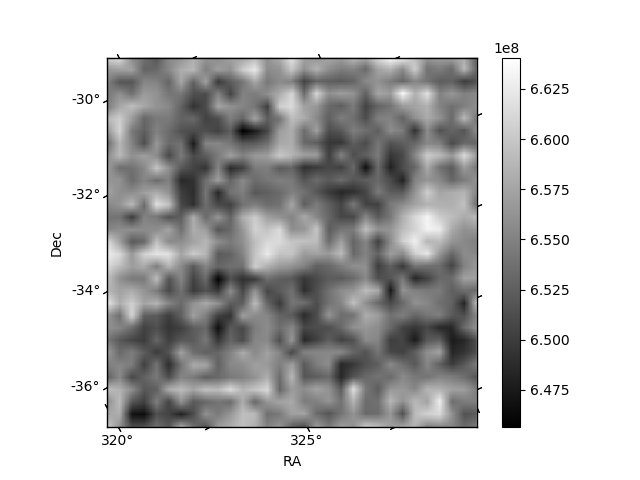
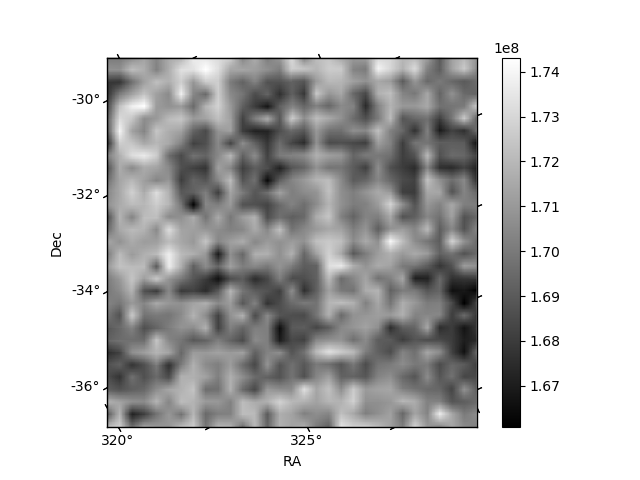
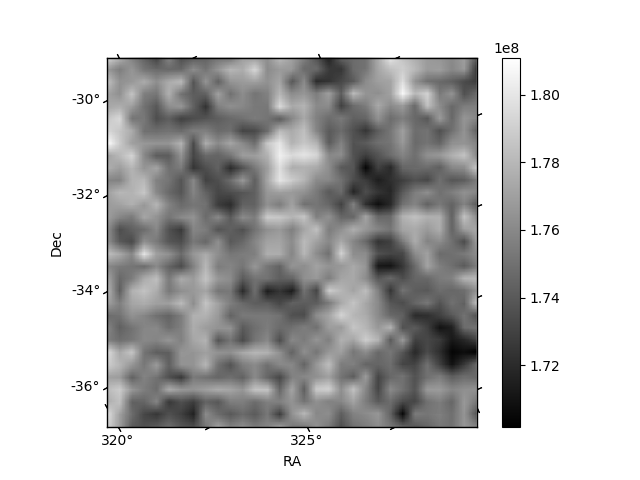
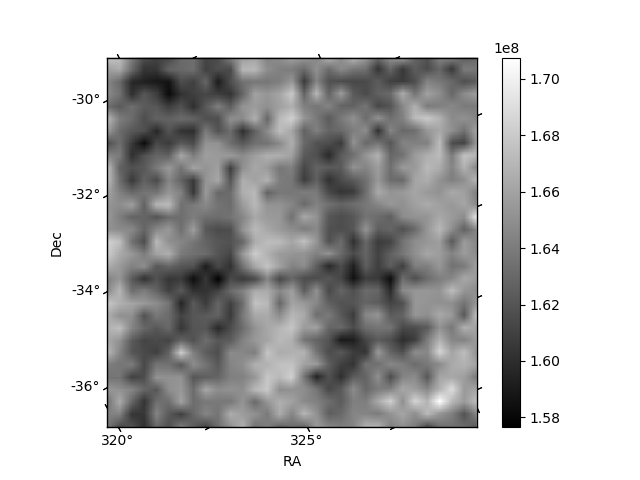
Histogram calculated using DETX and DETY for each event in the final _common_clean file
| Quadrant A | 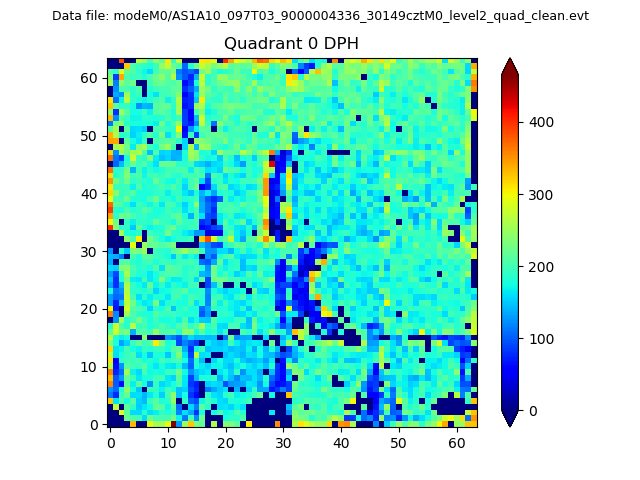 |
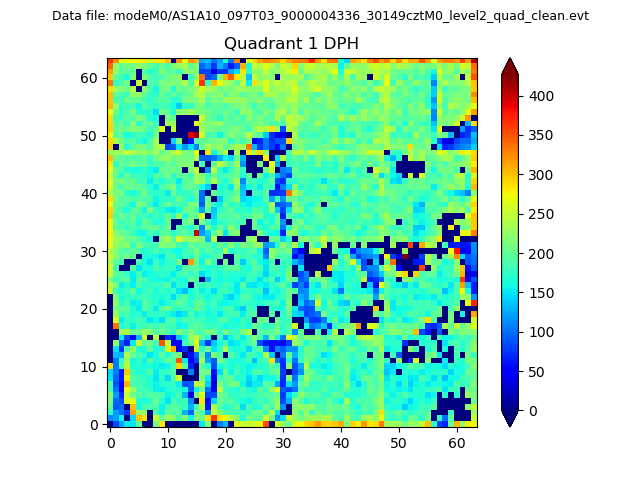 |
Quadrant B |
|---|---|---|---|
| Quadrant D | 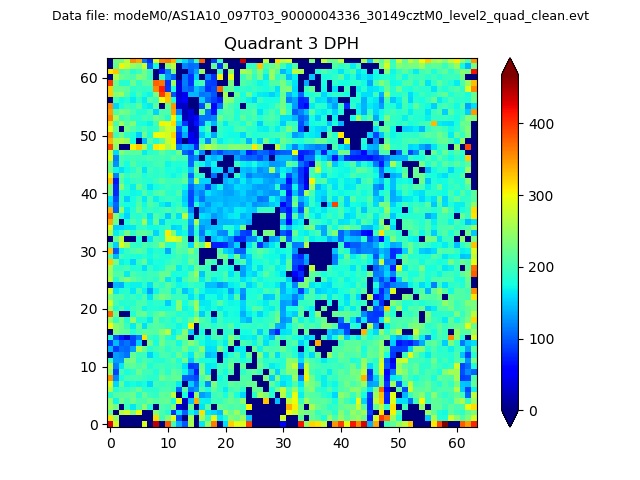 |
 |
Quadrant C |
| Plot type | Count rate plots | Images |
|---|---|---|
| Comparison with Poisson distribution Blue bars denote a histogram of data divided into 1 sec bins. Red curve is a Poisson curve with rate = median count rate of data. |
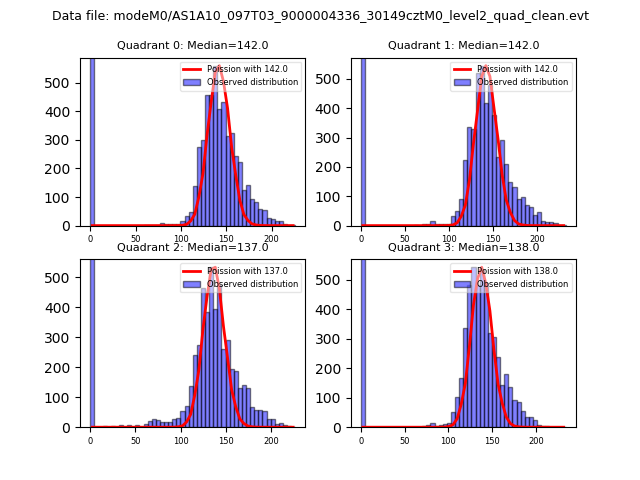 |
 |
| Quadrant-wise count rates Data is divided into 100 sec bins |
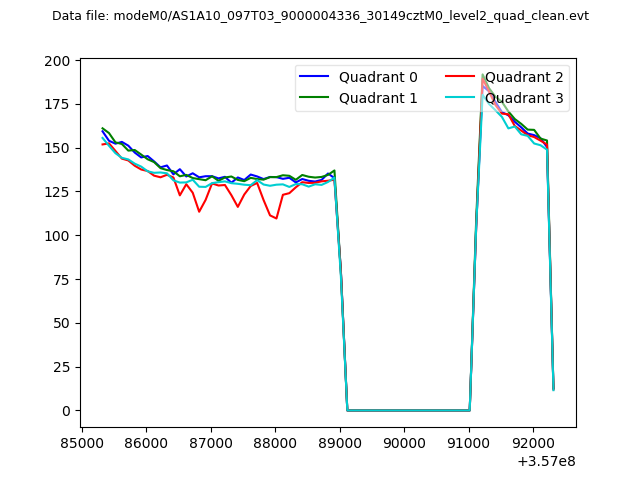 |
|
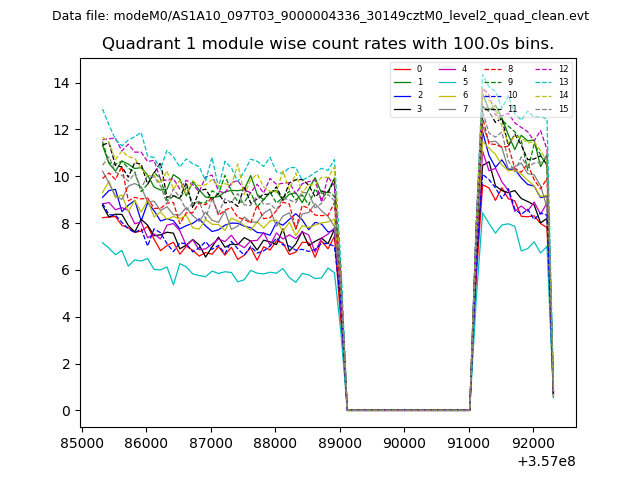
| Module-wise count rates for Quadrant A Data is divided into 100 sec bins |
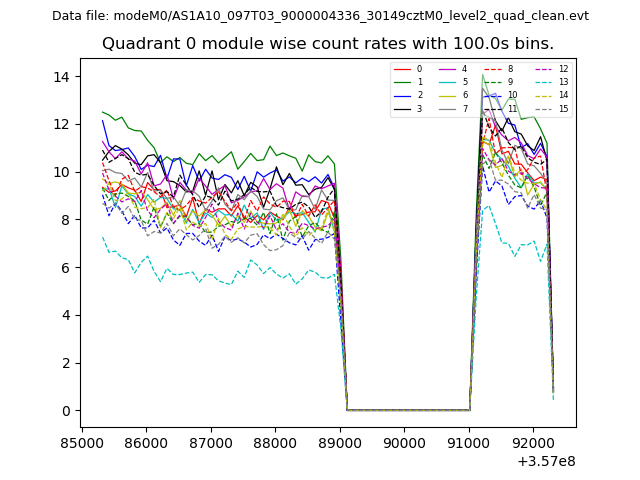 |
 |
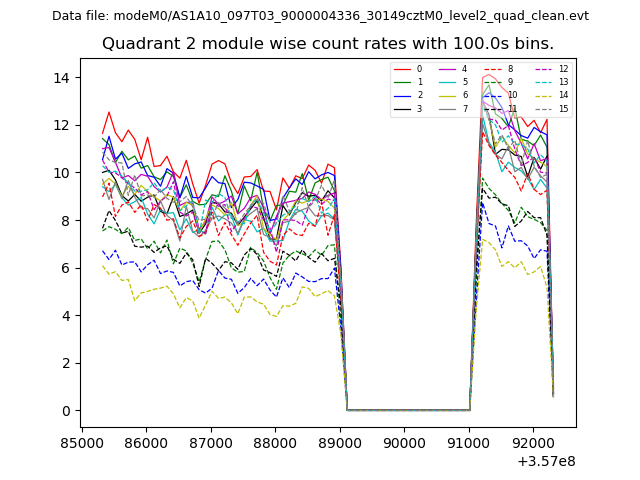
| Module-wise count rates for Quadrant B Data is divided into 100 sec bins |
 |
 |
| Module-wise count rates for Quadrant C Data is divided into 100 sec bins |
 |
 |
| Module-wise count rates for Quadrant D Data is divided into 100 sec bins |
 |
 |
| Parameter | Plot |
|---|---|
| CZT HV Monitor | 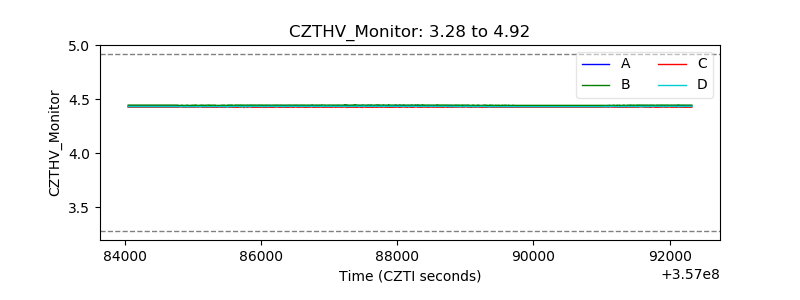 |
| D_VDD | 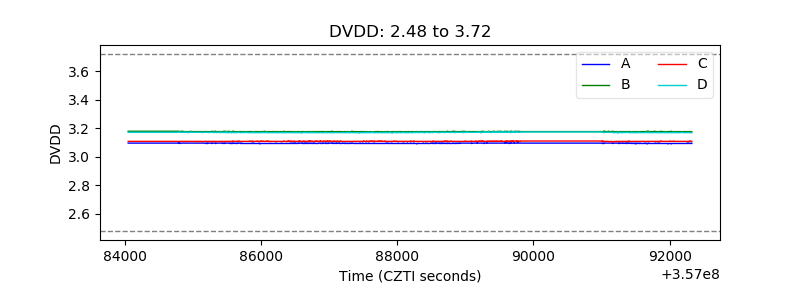 |
| Temperature 1 | 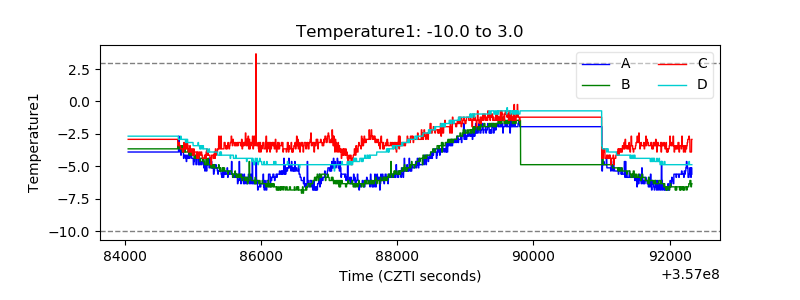 |
| Veto HV Monitor | 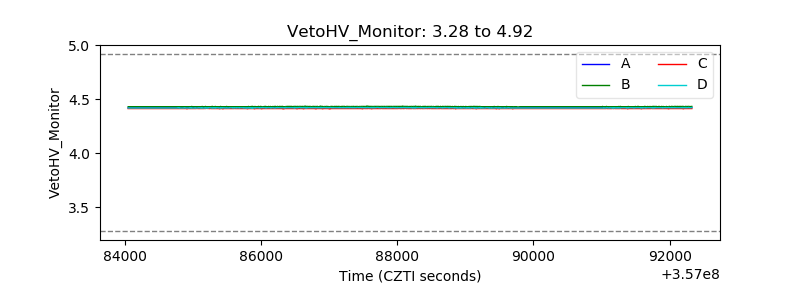 |
| Veto LLD | 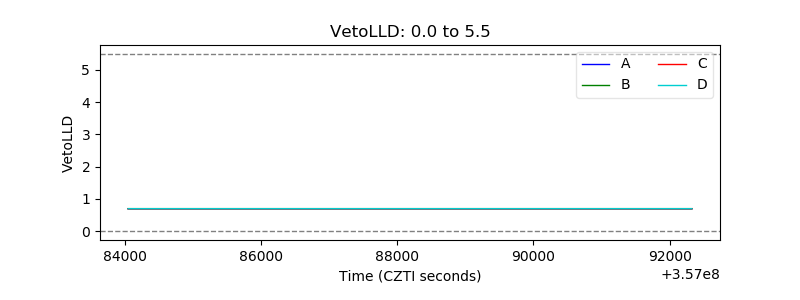 |
| Alpha Counter | 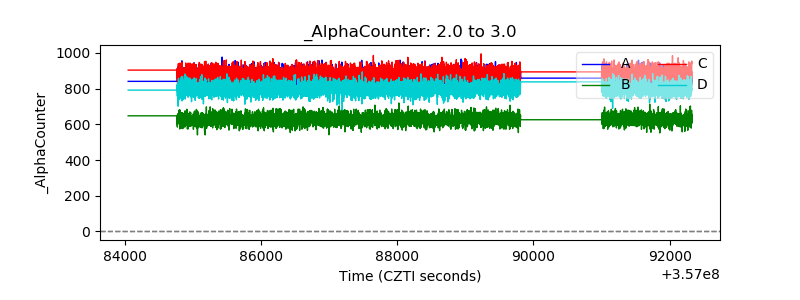 |
| _CPM_Rate | 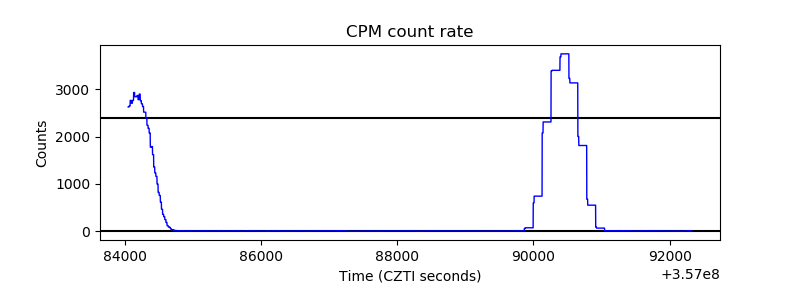 |
| CZT Counter | 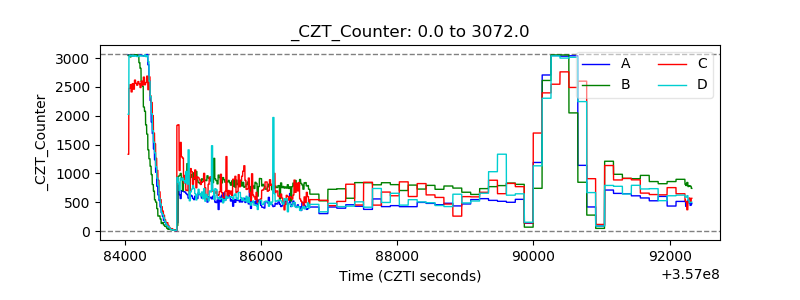 |
| +2.5 Volts monitor |  |
| +5 Volts monitor |  |
| _ROLL_ROT | 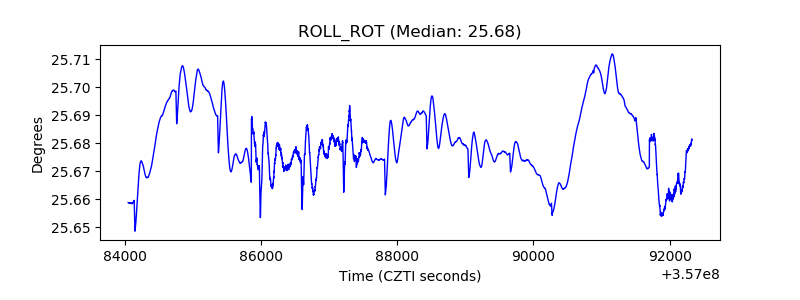 |
| _Roll_DEC |  |
| _Roll_RA | 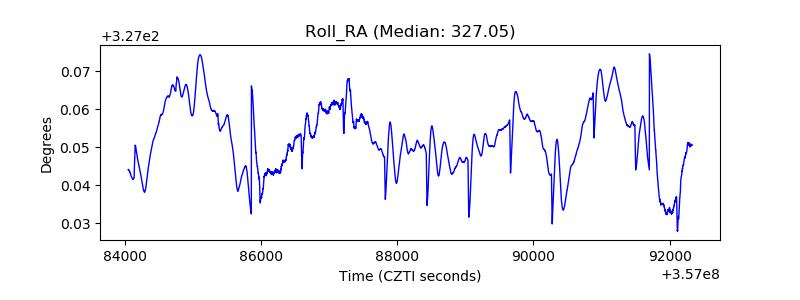 |
| Veto Counter | 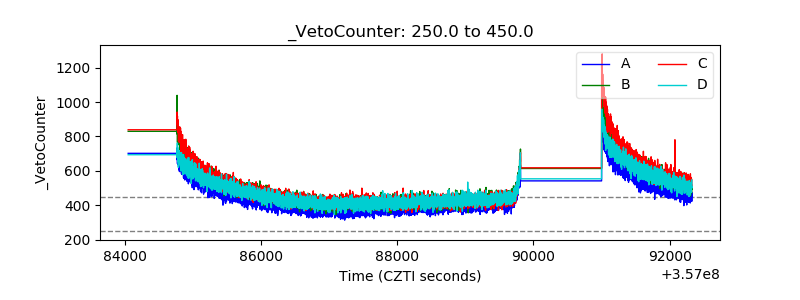 |