| Param | Original file | Final file |
|---|---|---|
| Filename | modeM0/AS1A10_097T03_9000004336_30150cztM0_level2.evt | modeM0/AS1A10_097T03_9000004336_30150cztM0_level2_quad_clean.evt |
| Size (bytes) | 155,387,520 | 34,133,760 |
| Size | 148.2 MB | 32.6 MB |
| Events in quadrant A | 888,065 | 230,685 |
| Events in quadrant B | 1,365,896 | 235,139 |
| Events in quadrant C | 1,108,131 | 230,781 |
| Events in quadrant D | 1,239,821 | 225,472 |
| Mode M9 | |||
|---|---|---|---|
| Quadrant | BADHDUFLAG | Total packets | Discarded packets |
| A | 0 | 12 | 0 |
| B | 0 | 12 | 0 |
| C | 0 | 12 | 0 |
| D | 0 | 12 | 0 |
| Mode SS | |||
|---|---|---|---|
| Quadrant | BADHDUFLAG | Total packets | Discarded packets |
| A | 0 | 32 | 0 |
| B | 0 | 32 | 0 |
| C | 0 | 32 | 0 |
| D | 0 | 32 | 0 |
| Mode M0 | |||
|---|---|---|---|
| Quadrant | BADHDUFLAG | Total packets | Discarded packets |
| A | 0 | 3614 | 13 |
| B | 0 | 4963 | 15 |
| C | 0 | 4516 | 21 |
| D | 0 | 4816 | 13 |
| Quadrant | Total seconds | Saturated seconds | Saturation percentage |
|---|---|---|---|
| A | 1500 | 26 | 1.733333% |
| B | 1500 | 65 | 4.333333% |
| C | 1500 | 96 | 6.400000% |
| D | 1501 | 29 | 1.932045% |
Noise dominated data is calculated using 1-second bins in cleaned event files. If a bin has >2000 counts, and if more than 50% of those come from <1% of pixels, then it is considered to be noise-dominated and hence unusable.
| Quadrant | # 1 sec bins | Bins with >0 counts | Bins with >2000 counts | High rate bins dominated by noise | Noise dominated (total time) | Noise dominated (detector-on time) | Marked lightcurve |
|---|---|---|---|---|---|---|---|
| A | 2781 | 1507 | 0 | 0 | 0.00% | 0.00% | 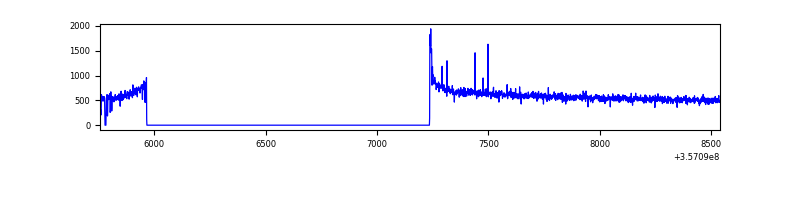 |
| B | 2783 | 1509 | 1 | 1 | 0.04% | 0.07% | 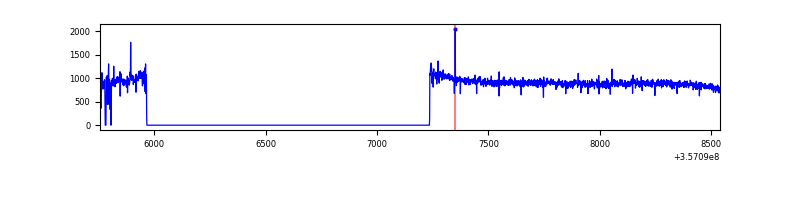 |
| C | 2781 | 1510 | 0 | 0 | 0.00% | 0.00% | 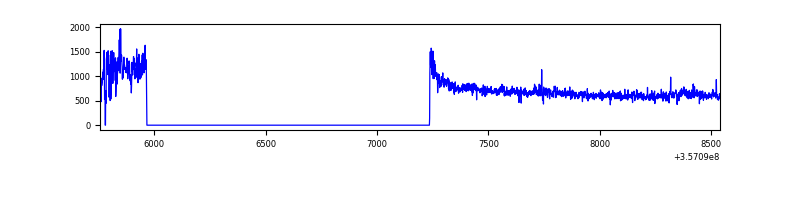 |
| D | 2783 | 1511 | 2 | 2 | 0.07% | 0.13% | 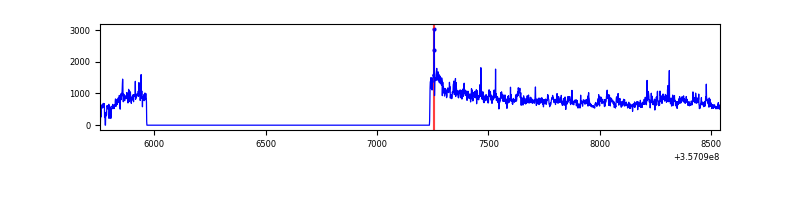 |
Top three noisy pixels from each quadrant. If the there are fewer than three noisy pixels in the level2.evt file, extra rows are filled as -1
| Pixel properties | Quadrant properties | ||||||
|---|---|---|---|---|---|---|---|
| Quadrant | DetID | PixID | Counts | Sigma | Mean | Median | Sigma |
| A | 8 | 192 | 10959 | 232.69 | 225 | 222 | 46.1 |
| A | 0 | 13 | 6117 | 127.76 | 225 | 222 | 46.1 |
| A | 13 | 254 | 2851 | 56.98 | 225 | 222 | 46.1 |
| B | 6 | 159 | 461308 | 10364.3 | 227 | 223 | 44.5 |
| B | 0 | 190 | 7343 | 160.04 | 227 | 223 | 44.5 |
| B | 4 | 171 | 6982 | 151.93 | 227 | 223 | 44.5 |
| C | 3 | 233 | 186208 | 3453.87 | 224 | 226 | 53.8 |
| C | 14 | 238 | 36553 | 674.63 | 224 | 226 | 53.8 |
| C | 2 | 114 | 3775 | 65.91 | 224 | 226 | 53.8 |
| D | 12 | 227 | 226036 | 3878.86 | 224 | 219 | 58.2 |
| D | 7 | 1 | 71150 | 1218.38 | 224 | 219 | 58.2 |
| D | 13 | 168 | 43189 | 738.1 | 224 | 219 | 58.2 |
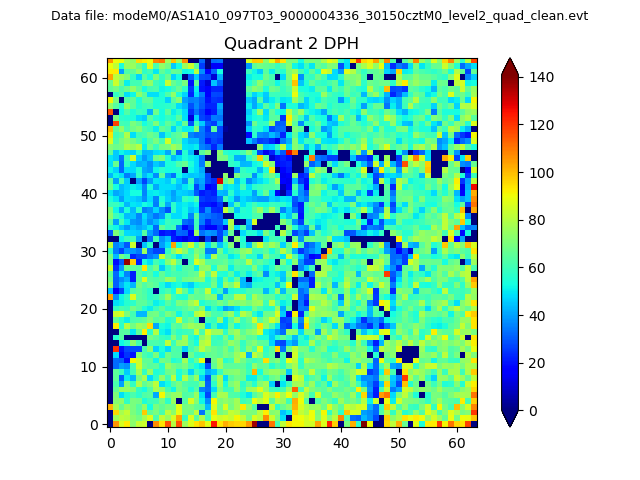
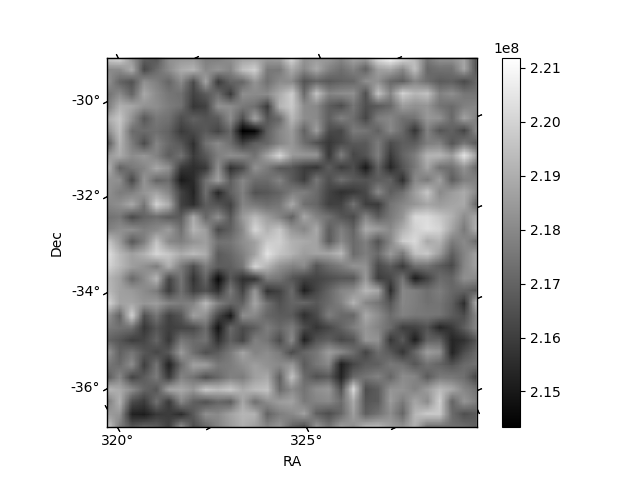
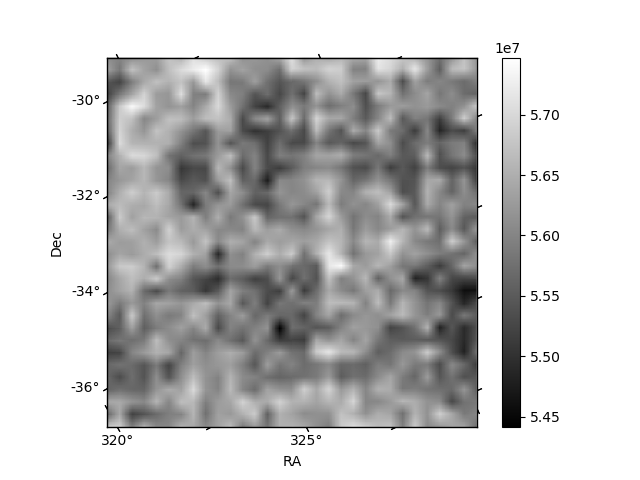
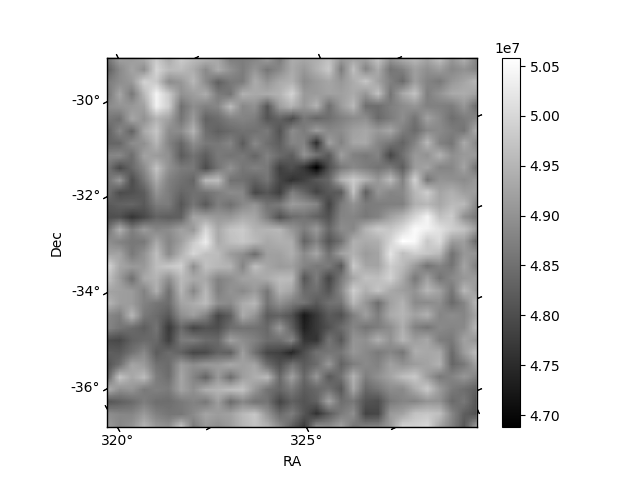
Histogram calculated using DETX and DETY for each event in the final _common_clean file
| Quadrant A | 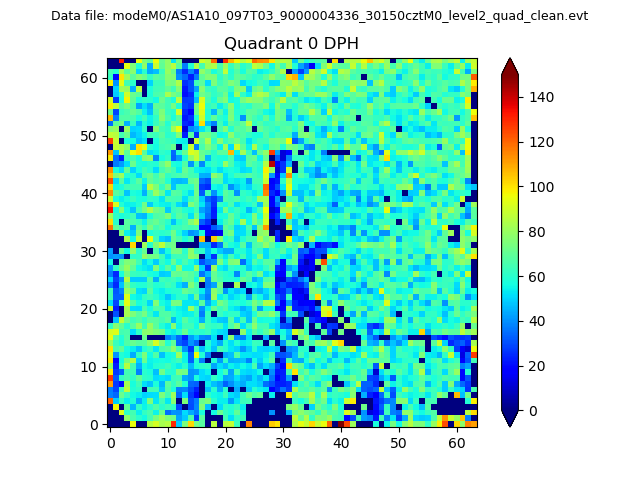 |
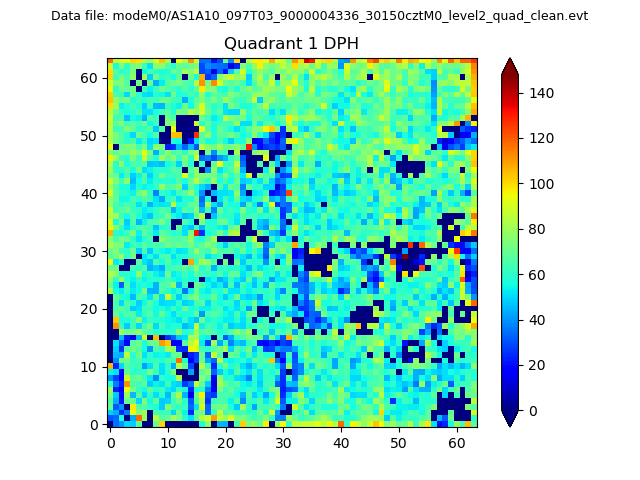 |
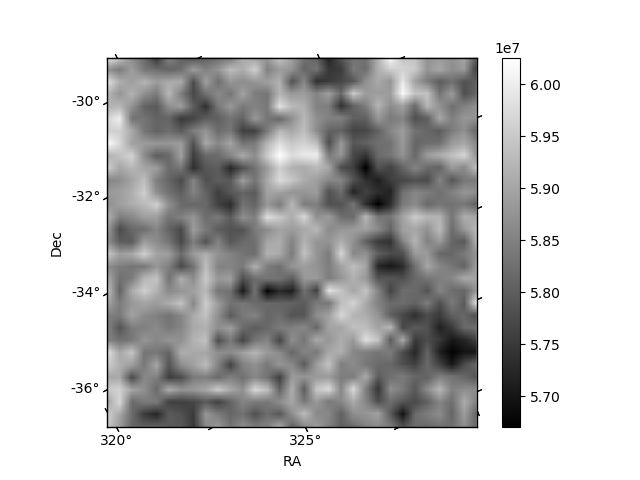
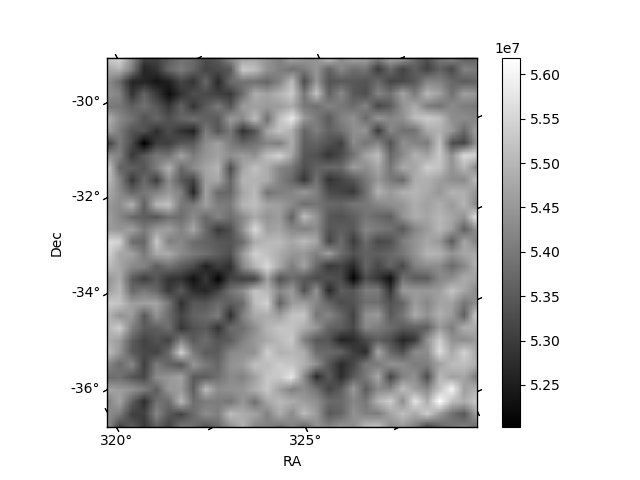
Quadrant B |
|---|---|---|---|
| Quadrant D | 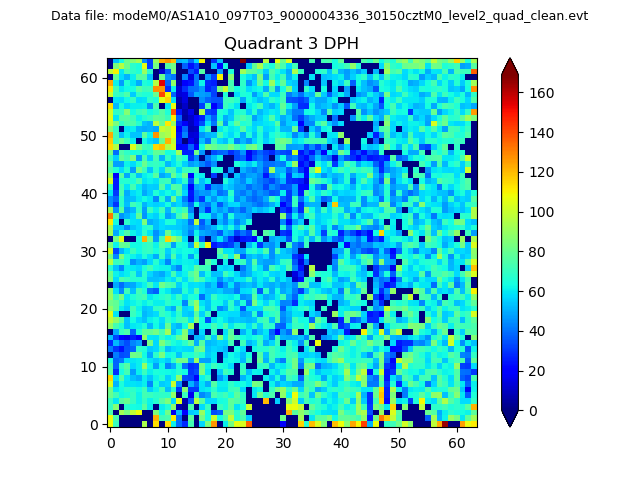 |
 |
Quadrant C |
| Plot type | Count rate plots | Images |
|---|---|---|
| Comparison with Poisson distribution Blue bars denote a histogram of data divided into 1 sec bins. Red curve is a Poisson curve with rate = median count rate of data. |
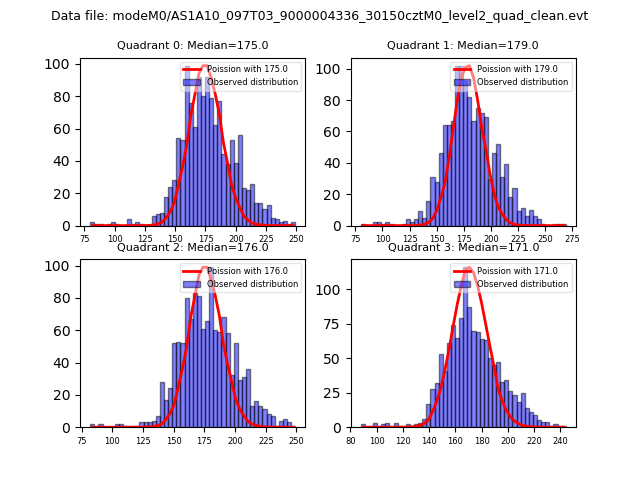 |
 |
| Quadrant-wise count rates Data is divided into 100 sec bins |
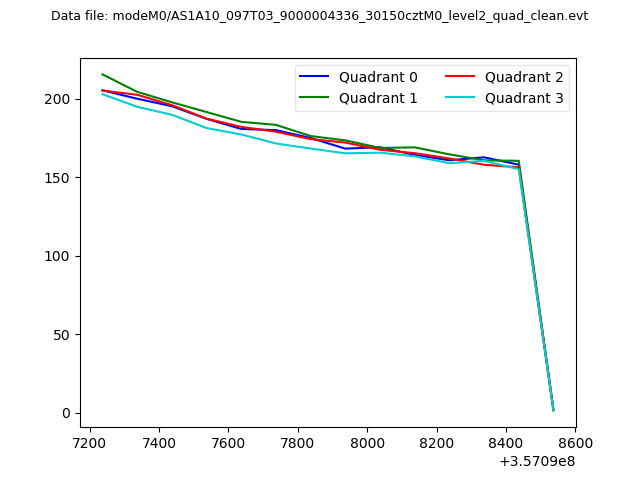 |
|
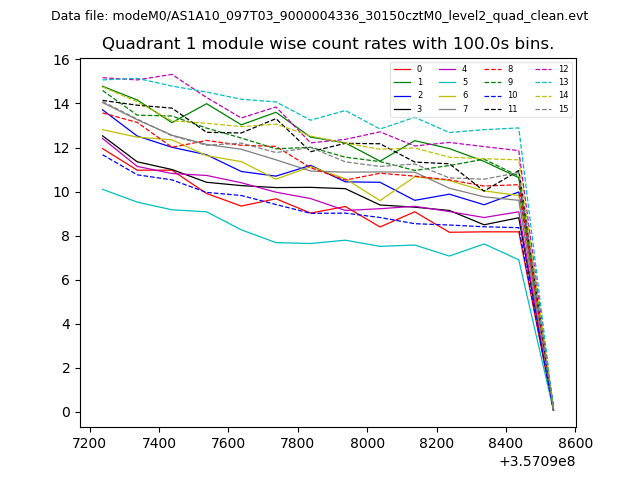
| Module-wise count rates for Quadrant A Data is divided into 100 sec bins |
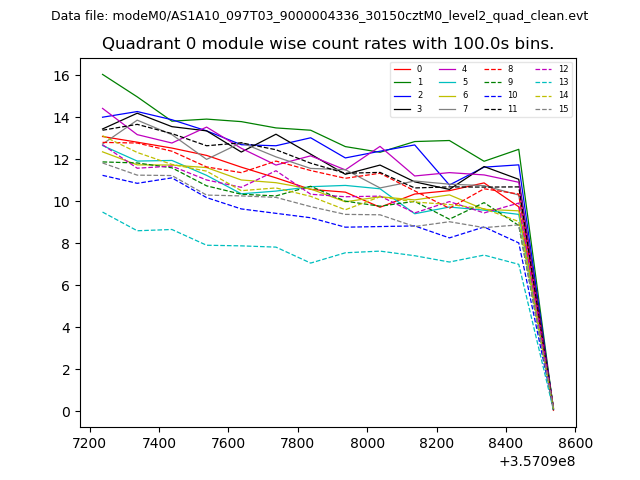 |
 |
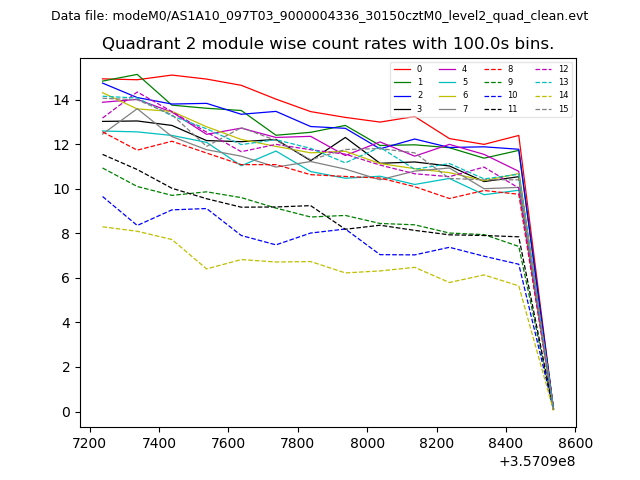
| Module-wise count rates for Quadrant B Data is divided into 100 sec bins |
 |
 |
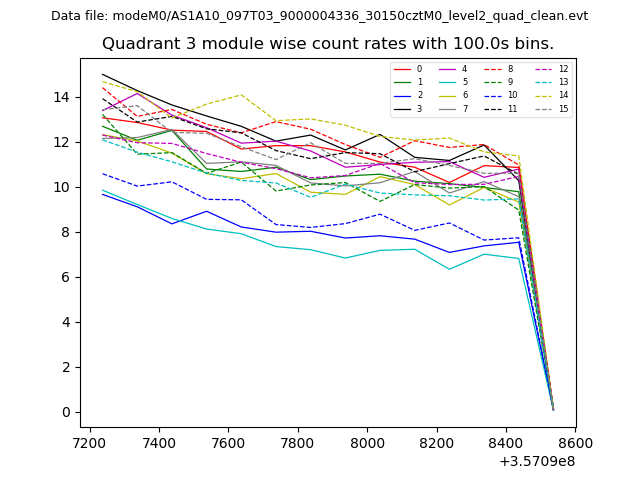
| Module-wise count rates for Quadrant C Data is divided into 100 sec bins |
 |
 |
| Module-wise count rates for Quadrant D Data is divided into 100 sec bins |
 |
 |
| Parameter | Plot |
|---|---|
| CZT HV Monitor | 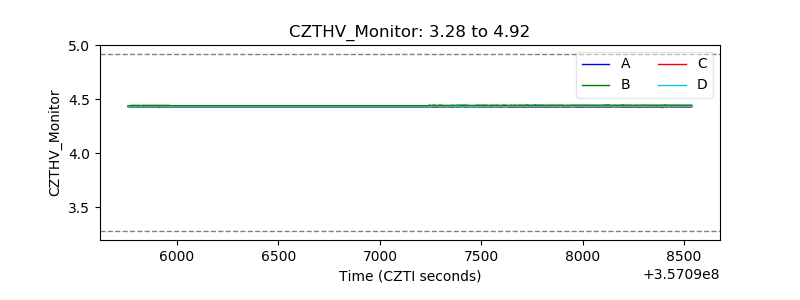 |
| D_VDD | 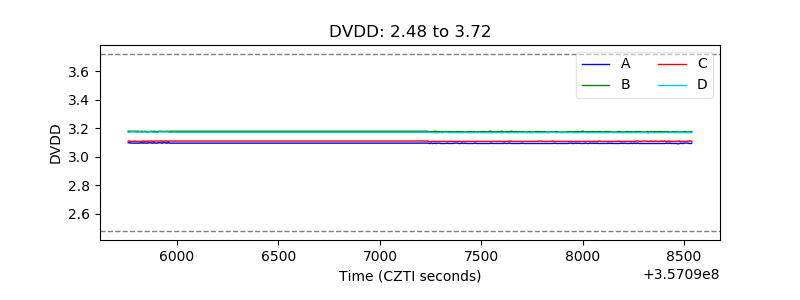 |
| Temperature 1 | 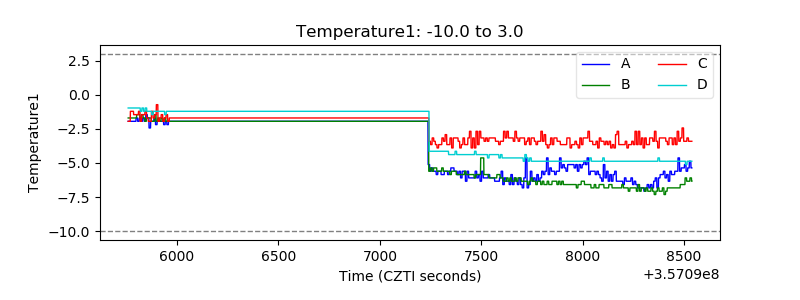 |
| Veto HV Monitor | 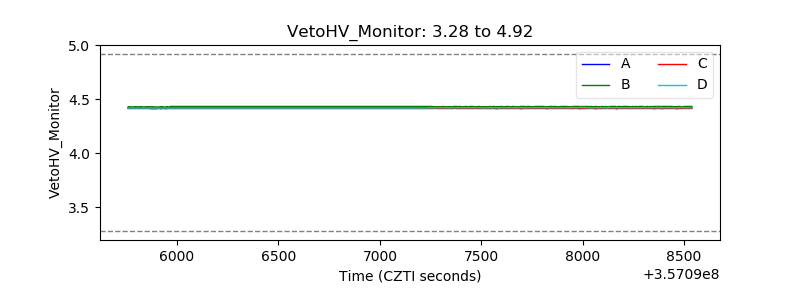 |
| Veto LLD | 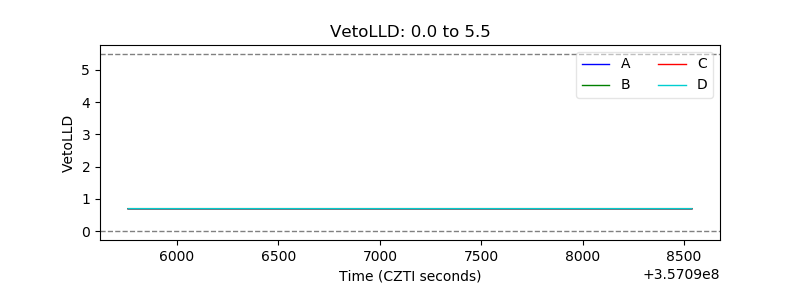 |
| Alpha Counter | 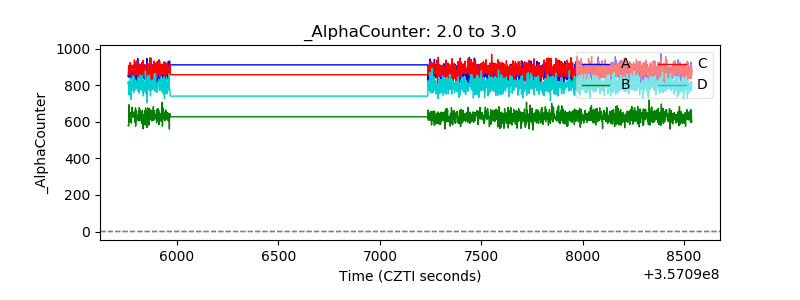 |
| _CPM_Rate | 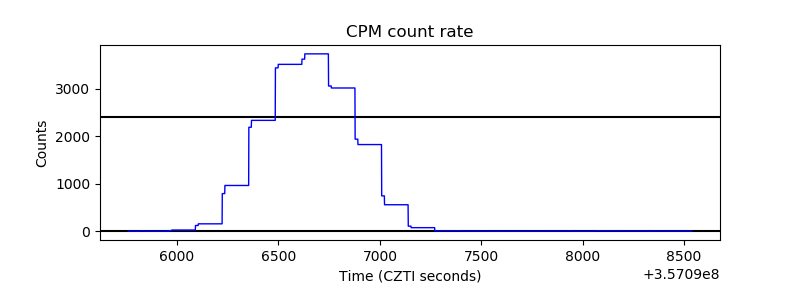 |
| CZT Counter | 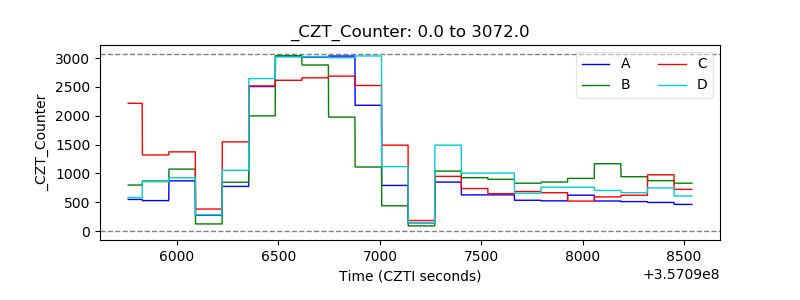 |
| +2.5 Volts monitor | 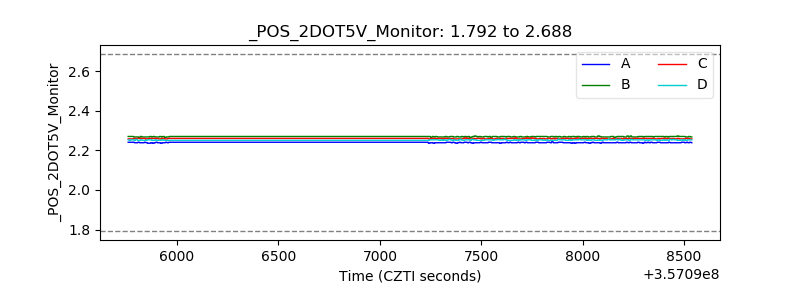 |
| +5 Volts monitor | 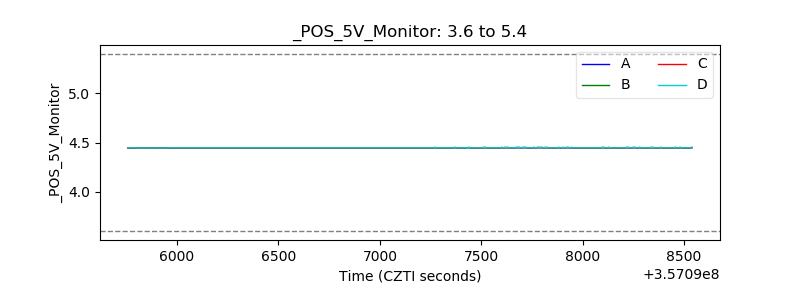 |
| _ROLL_ROT | 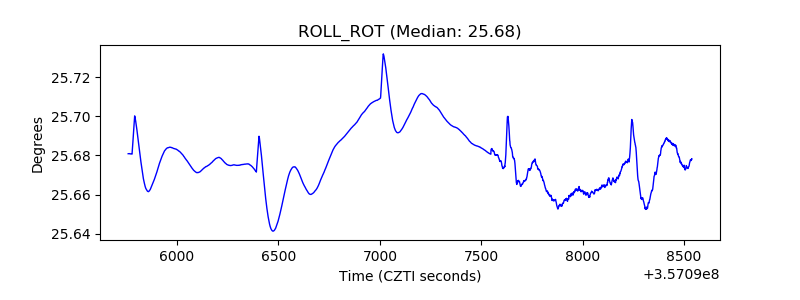 |
| _Roll_DEC | 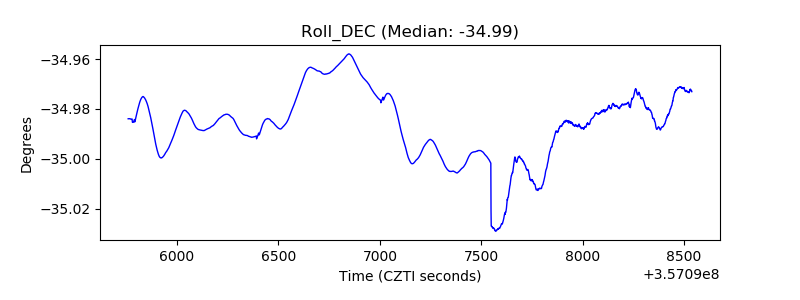 |
| _Roll_RA | 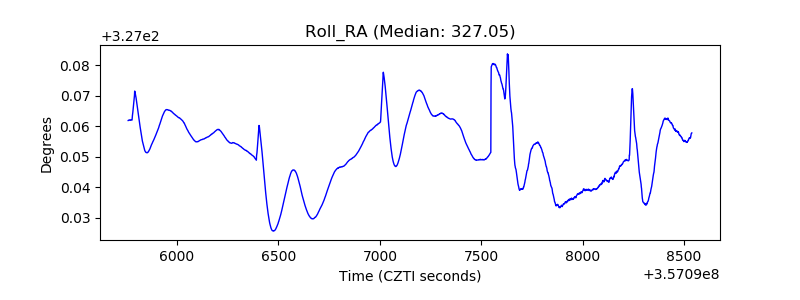 |
| Veto Counter | 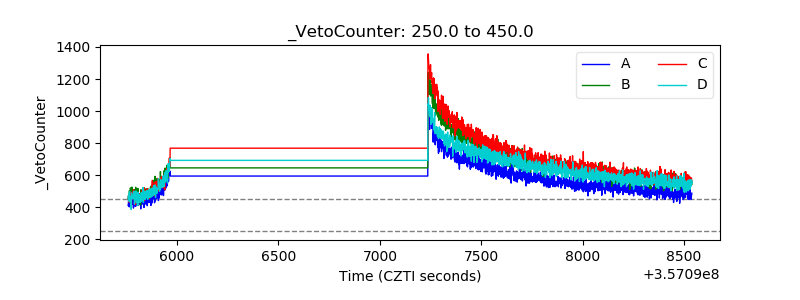 |