| Param | Original file | Final file |
|---|---|---|
| Filename | modeM0/AS1A10_097T03_9000004336_30151cztM0_level2.evt | modeM0/AS1A10_097T03_9000004336_30151cztM0_level2_quad_clean.evt |
| Size (bytes) | 944,061,120 | 177,707,520 |
| Size | 900.3 MB | 169.5 MB |
| Events in quadrant A | 5,216,472 | 1,177,291 |
| Events in quadrant B | 8,261,560 | 1,190,284 |
| Events in quadrant C | 7,828,550 | 1,156,357 |
| Events in quadrant D | 6,599,875 | 1,155,019 |
| Mode M9 | |||
|---|---|---|---|
| Quadrant | BADHDUFLAG | Total packets | Discarded packets |
| A | 0 | 25 | 0 |
| B | 0 | 25 | 0 |
| C | 0 | 25 | 0 |
| D | 0 | 25 | 0 |
| Mode SS | |||
|---|---|---|---|
| Quadrant | BADHDUFLAG | Total packets | Discarded packets |
| A | 0 | 208 | 0 |
| B | 0 | 208 | 0 |
| C | 0 | 208 | 0 |
| D | 0 | 208 | 0 |
| Mode M0 | |||
|---|---|---|---|
| Quadrant | BADHDUFLAG | Total packets | Discarded packets |
| A | 0 | 21672 | 2 |
| B | 0 | 31324 | 3 |
| C | 0 | 30585 | 2 |
| D | 0 | 26094 | 2 |
| Quadrant | Total seconds | Saturated seconds | Saturation percentage |
|---|---|---|---|
| A | 10156 | 71 | 0.699094% |
| B | 10155 | 172 | 1.693747% |
| C | 10155 | 516 | 5.081241% |
| D | 10156 | 111 | 1.092950% |
Noise dominated data is calculated using 1-second bins in cleaned event files. If a bin has >2000 counts, and if more than 50% of those come from <1% of pixels, then it is considered to be noise-dominated and hence unusable.
| Quadrant | # 1 sec bins | Bins with >0 counts | Bins with >2000 counts | High rate bins dominated by noise | Noise dominated (total time) | Noise dominated (detector-on time) | Marked lightcurve |
|---|---|---|---|---|---|---|---|
| A | 12741 | 10158 | 3 | 3 | 0.02% | 0.03% | 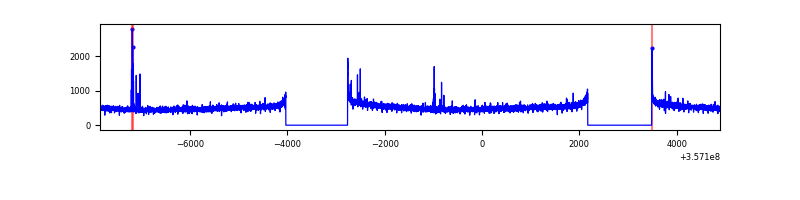 |
| B | 12740 | 10157 | 1 | 1 | 0.01% | 0.01% |  |
| C | 12740 | 10157 | 146 | 146 | 1.15% | 1.44% | 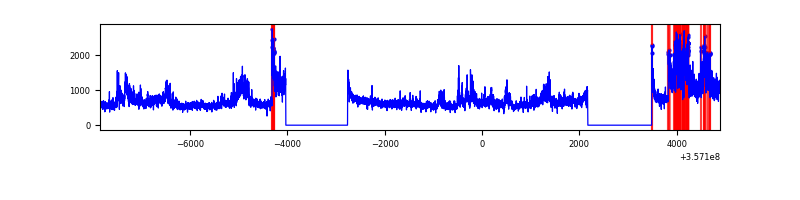 |
| D | 12741 | 10158 | 56 | 56 | 0.44% | 0.55% | 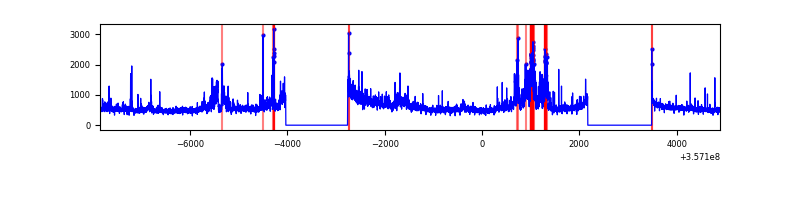 |
Top three noisy pixels from each quadrant. If the there are fewer than three noisy pixels in the level2.evt file, extra rows are filled as -1
| Pixel properties | Quadrant properties | ||||||
|---|---|---|---|---|---|---|---|
| Quadrant | DetID | PixID | Counts | Sigma | Mean | Median | Sigma |
| A | 0 | 13 | 45651 | 167.81 | 1334 | 1309 | 264.2 |
| A | 8 | 192 | 25101 | 90.04 | 1334 | 1309 | 264.2 |
| A | 13 | 254 | 18939 | 66.72 | 1334 | 1309 | 264.2 |
| B | 6 | 159 | 2980474 | 12041.81 | 1326 | 1293 | 247.4 |
| B | 0 | 190 | 66964 | 265.44 | 1326 | 1293 | 247.4 |
| B | 12 | 111 | 29185 | 112.74 | 1326 | 1293 | 247.4 |
| C | 3 | 233 | 2457186 | 8143.5 | 1309 | 1319 | 301.6 |
| C | 14 | 238 | 216122 | 712.27 | 1309 | 1319 | 301.6 |
| C | 2 | 114 | 23675 | 74.13 | 1309 | 1319 | 301.6 |
| D | 12 | 227 | 1030730 | 3262.68 | 1326 | 1299 | 315.5 |
| D | 8 | 195 | 213573 | 672.78 | 1326 | 1299 | 315.5 |
| D | 7 | 1 | 157435 | 494.86 | 1326 | 1299 | 315.5 |
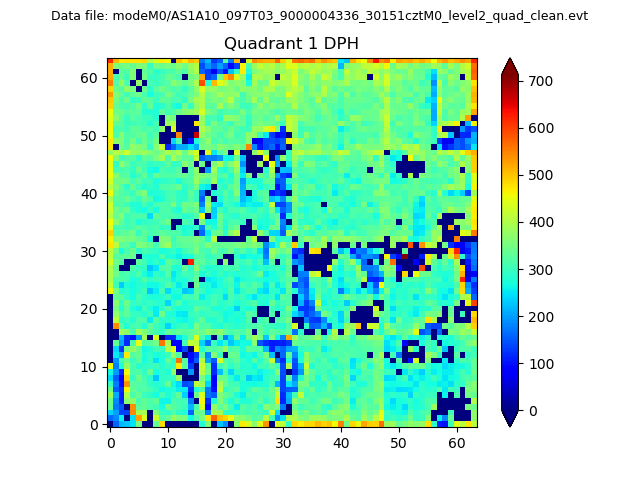
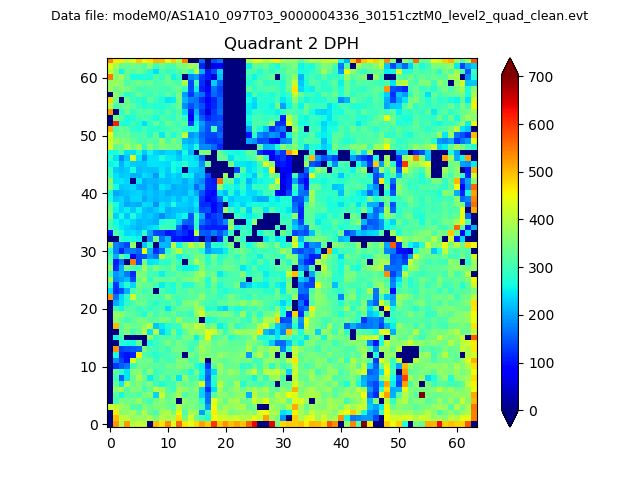
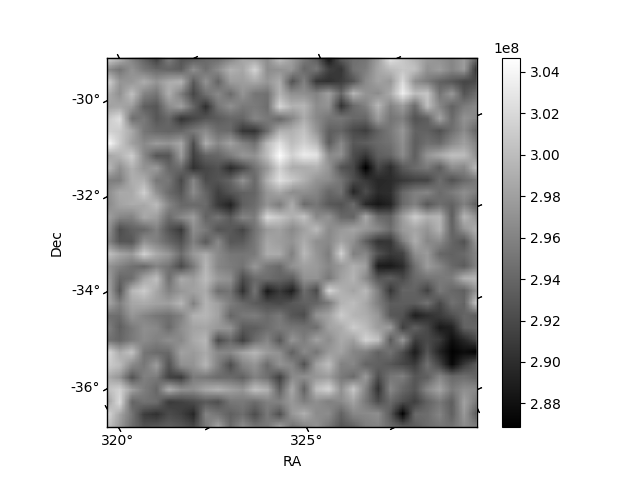
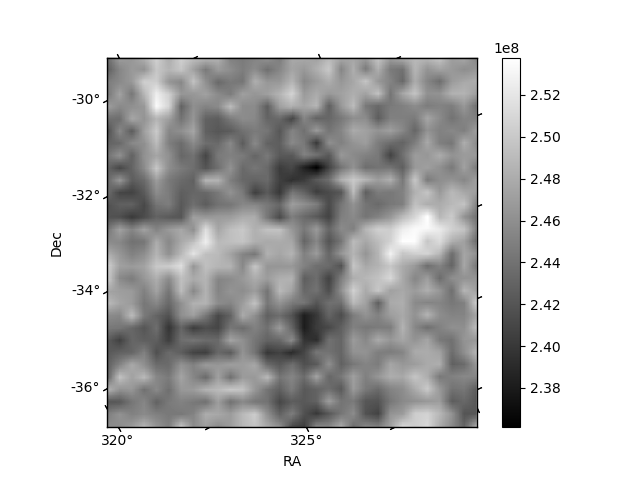
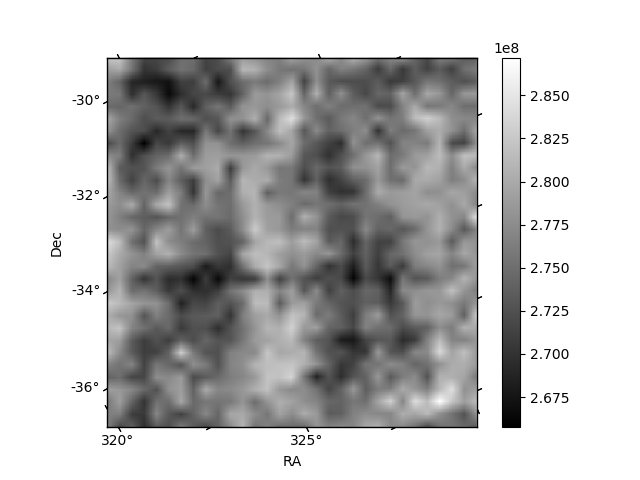
Histogram calculated using DETX and DETY for each event in the final _common_clean file
| Quadrant A | 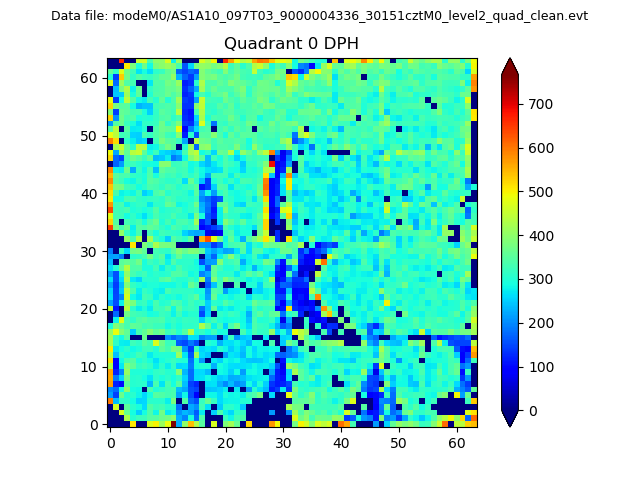 |
 |
Quadrant B |
|---|---|---|---|
| Quadrant D | 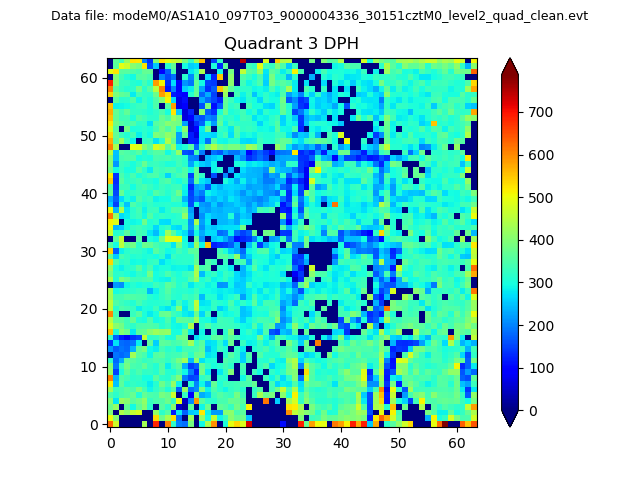 |
 |
Quadrant C |
| Plot type | Count rate plots | Images |
|---|---|---|
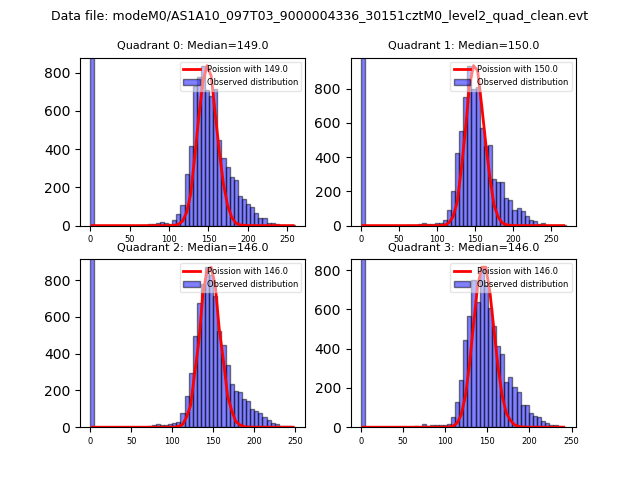
| Comparison with Poisson distribution Blue bars denote a histogram of data divided into 1 sec bins. Red curve is a Poisson curve with rate = median count rate of data. |
 |
 |
| Quadrant-wise count rates Data is divided into 100 sec bins |
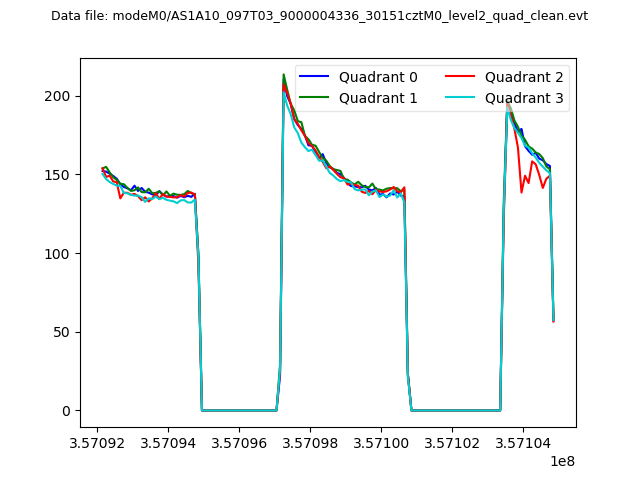 |
|
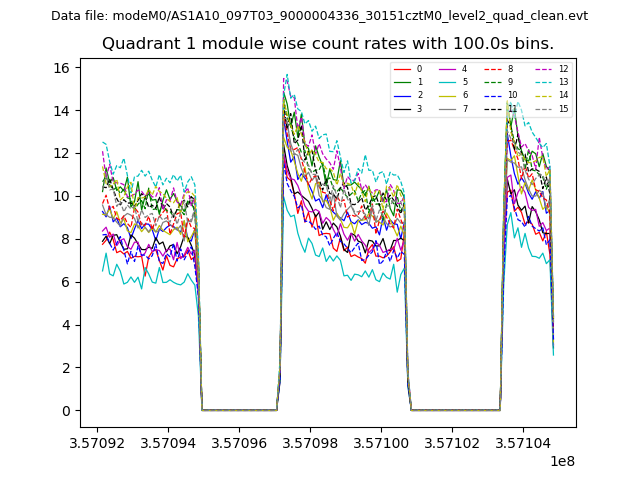
| Module-wise count rates for Quadrant A Data is divided into 100 sec bins |
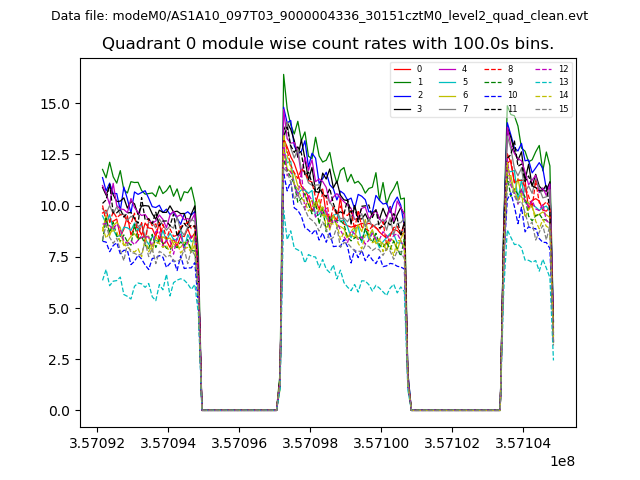 |
 |
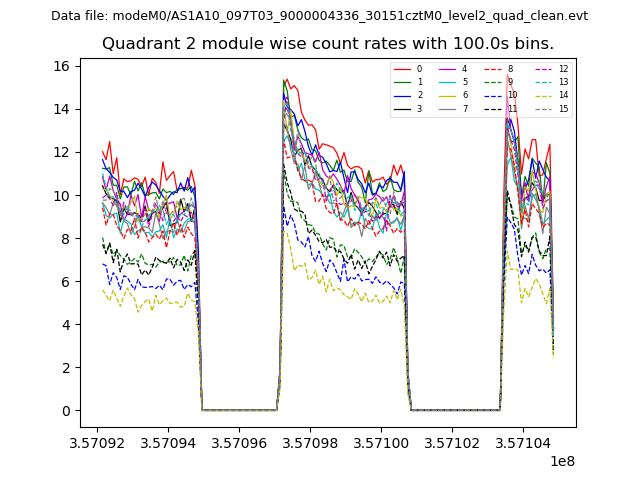
| Module-wise count rates for Quadrant B Data is divided into 100 sec bins |
 |
 |
| Module-wise count rates for Quadrant C Data is divided into 100 sec bins |
 |
 |
| Module-wise count rates for Quadrant D Data is divided into 100 sec bins |
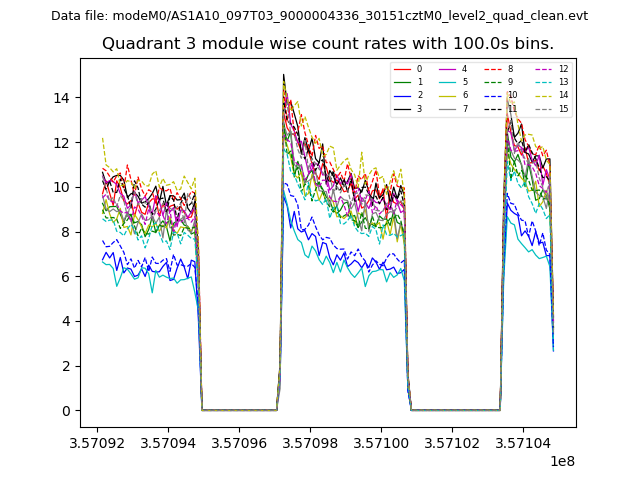 |
 |
| Parameter | Plot |
|---|---|
| CZT HV Monitor | 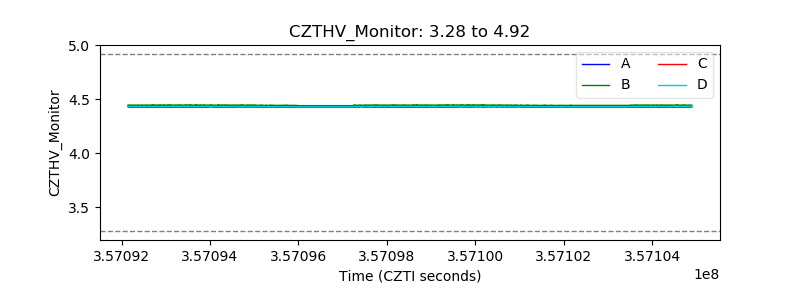 |
| D_VDD | 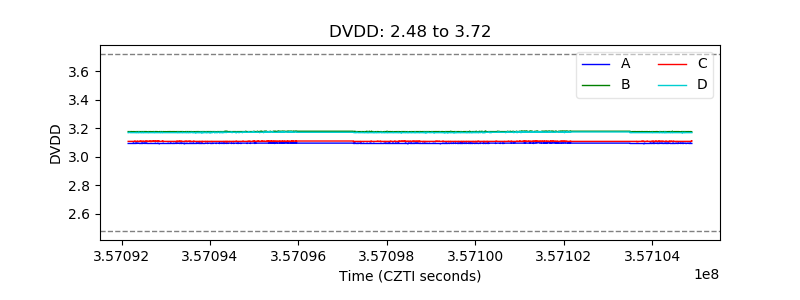 |
| Temperature 1 | 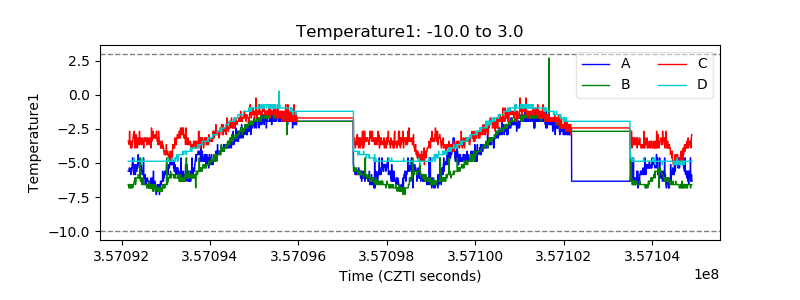 |
| Veto HV Monitor | 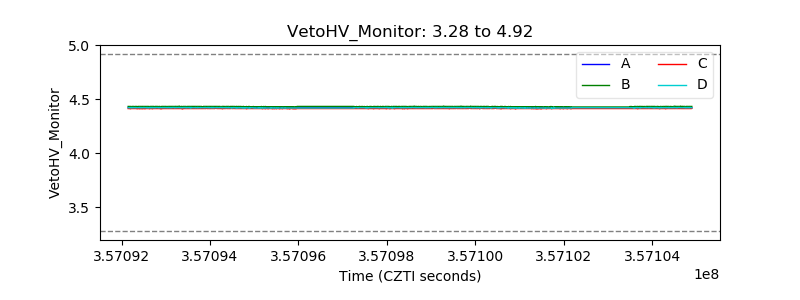 |
| Veto LLD | 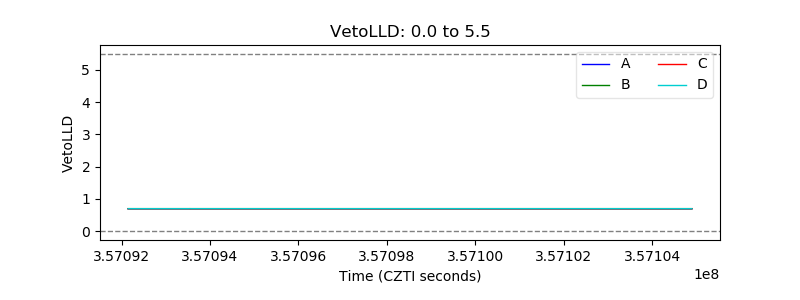 |
| Alpha Counter | 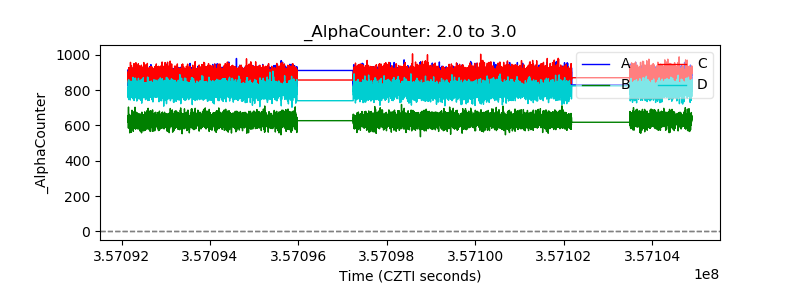 |
| _CPM_Rate | 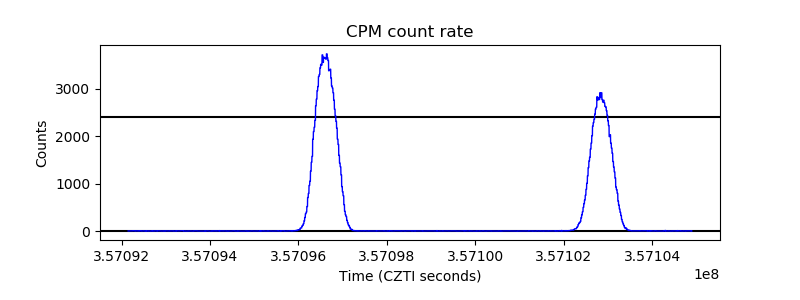 |
| CZT Counter | 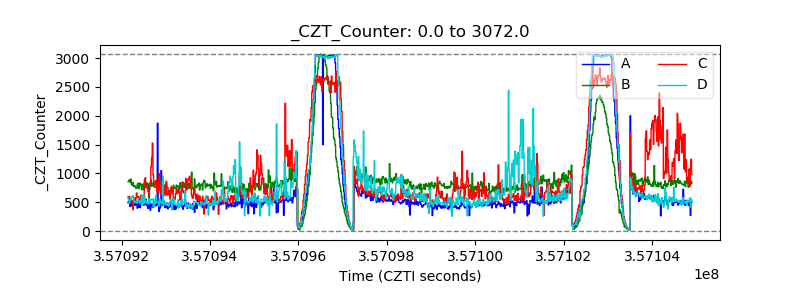 |
| +2.5 Volts monitor | 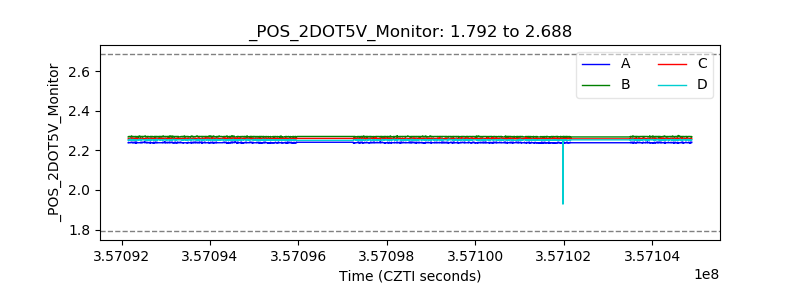 |
| +5 Volts monitor |  |
| _ROLL_ROT | 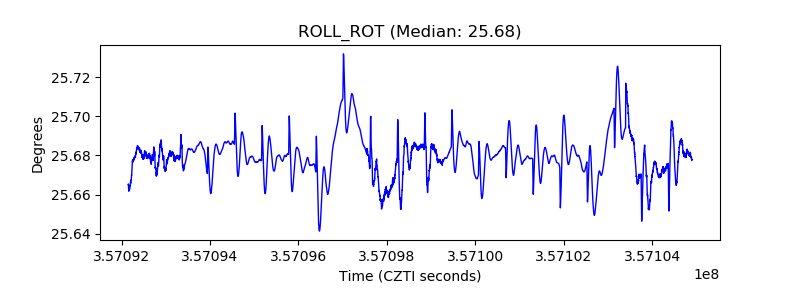 |
| _Roll_DEC | 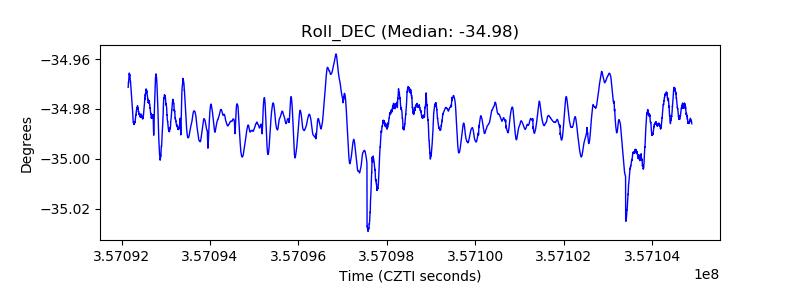 |
| _Roll_RA | 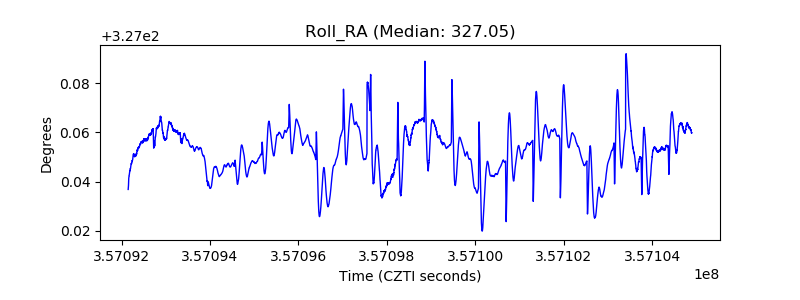 |
| Veto Counter | 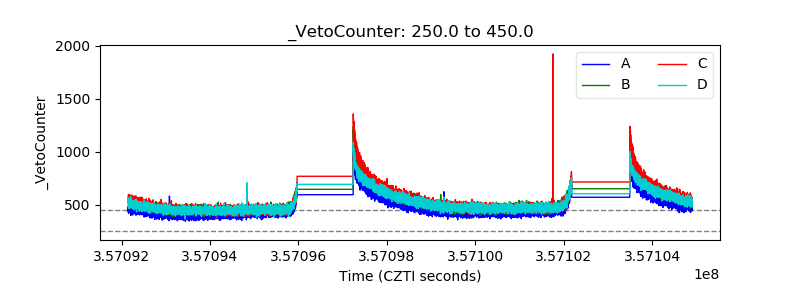 |