| Param | Original file | Final file |
|---|---|---|
| Filename | modeM0/AS1A10_097T03_9000004336_30152cztM0_level2.evt | modeM0/AS1A10_097T03_9000004336_30152cztM0_level2_quad_clean.evt |
| Size (bytes) | 749,885,760 | 102,608,640 |
| Size | 715.1 MB | 97.9 MB |
| Events in quadrant A | 3,349,186 | 690,956 |
| Events in quadrant B | 5,168,541 | 700,218 |
| Events in quadrant C | 9,965,683 | 591,859 |
| Events in quadrant D | 3,801,256 | 683,958 |
| Mode M9 | |||
|---|---|---|---|
| Quadrant | BADHDUFLAG | Total packets | Discarded packets |
| A | 0 | 16 | 0 |
| B | 0 | 17 | 0 |
| C | 0 | 17 | 0 |
| D | 0 | 17 | 0 |
| Mode SS | |||
|---|---|---|---|
| Quadrant | BADHDUFLAG | Total packets | Discarded packets |
| A | 0 | 130 | 0 |
| B | 0 | 130 | 0 |
| C | 0 | 130 | 0 |
| D | 0 | 130 | 0 |
| Mode M0 | |||
|---|---|---|---|
| Quadrant | BADHDUFLAG | Total packets | Discarded packets |
| A | 0 | 13724 | 2 |
| B | 0 | 19525 | 2 |
| C | 0 | 34039 | 2 |
| D | 0 | 15344 | 2 |
| Quadrant | Total seconds | Saturated seconds | Saturation percentage |
|---|---|---|---|
| A | 6296 | 76 | 1.207116% |
| B | 6296 | 149 | 2.366582% |
| C | 6296 | 2882 | 45.775095% |
| D | 6295 | 61 | 0.969023% |
Noise dominated data is calculated using 1-second bins in cleaned event files. If a bin has >2000 counts, and if more than 50% of those come from <1% of pixels, then it is considered to be noise-dominated and hence unusable.
| Quadrant | # 1 sec bins | Bins with >0 counts | Bins with >2000 counts | High rate bins dominated by noise | Noise dominated (total time) | Noise dominated (detector-on time) | Marked lightcurve |
|---|---|---|---|---|---|---|---|
| A | 7576 | 6297 | 11 | 11 | 0.15% | 0.17% | 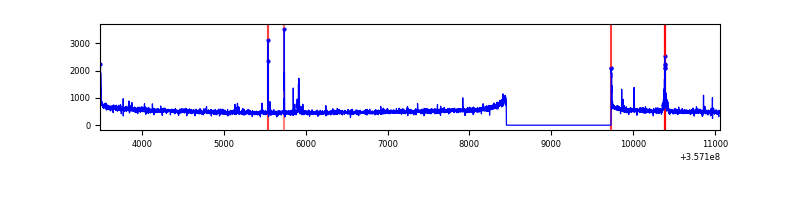 |
| B | 7576 | 6297 | 1 | 1 | 0.01% | 0.02% |  |
| C | 7576 | 6296 | 1930 | 1930 | 25.48% | 30.65% | 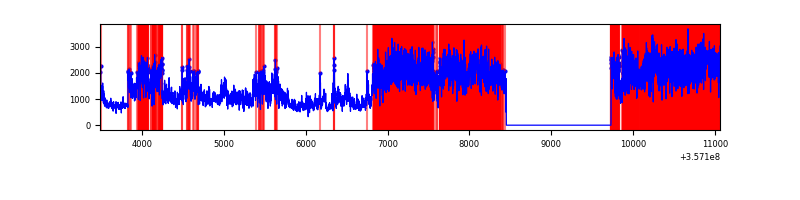 |
| D | 7575 | 6296 | 14 | 14 | 0.18% | 0.22% | 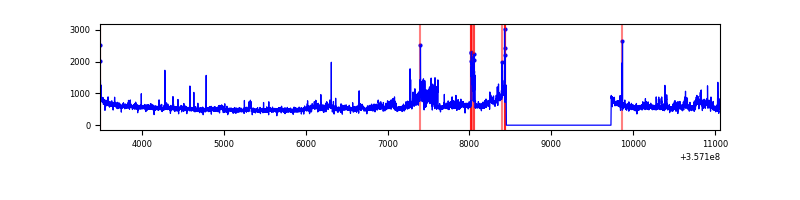 |
Top three noisy pixels from each quadrant. If the there are fewer than three noisy pixels in the level2.evt file, extra rows are filled as -1
| Pixel properties | Quadrant properties | ||||||
|---|---|---|---|---|---|---|---|
| Quadrant | DetID | PixID | Counts | Sigma | Mean | Median | Sigma |
| A | 0 | 13 | 79267 | 472.09 | 841 | 825 | 166.2 |
| A | 8 | 192 | 26659 | 155.48 | 841 | 825 | 166.2 |
| A | 13 | 254 | 12487 | 70.19 | 841 | 825 | 166.2 |
| B | 6 | 159 | 1803171 | 11543.57 | 834 | 813 | 156.1 |
| B | 0 | 190 | 37670 | 236.06 | 834 | 813 | 156.1 |
| B | 0 | 229 | 32175 | 200.86 | 834 | 813 | 156.1 |
| C | 3 | 233 | 7020665 | 42335.82 | 716 | 724 | 165.8 |
| C | 14 | 238 | 122503 | 734.42 | 716 | 724 | 165.8 |
| C | 14 | 254 | 16763 | 96.73 | 716 | 724 | 165.8 |
| D | 12 | 227 | 352025 | 1741.14 | 834 | 818 | 201.7 |
| D | 8 | 195 | 182670 | 901.54 | 834 | 818 | 201.7 |
| D | 2 | 250 | 29292 | 141.16 | 834 | 818 | 201.7 |
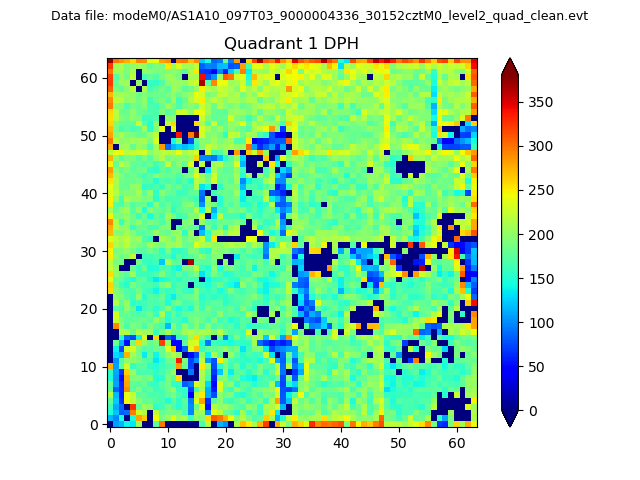
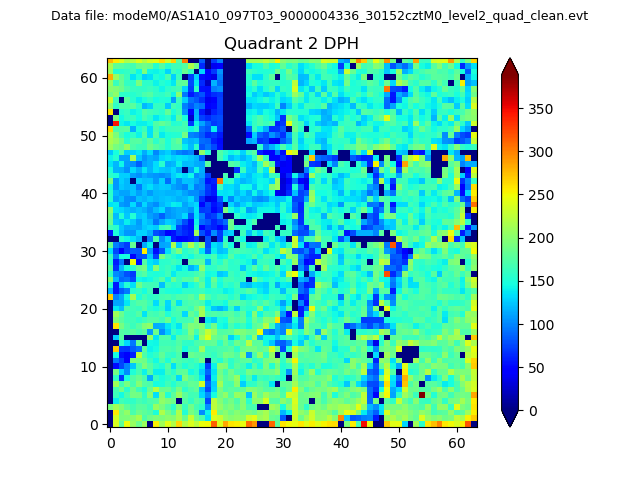
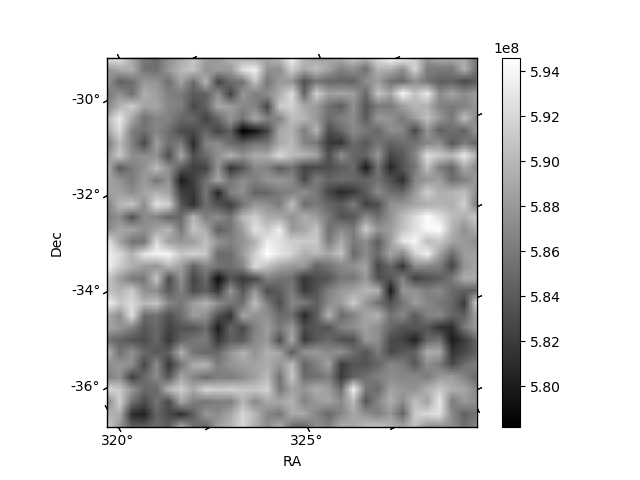
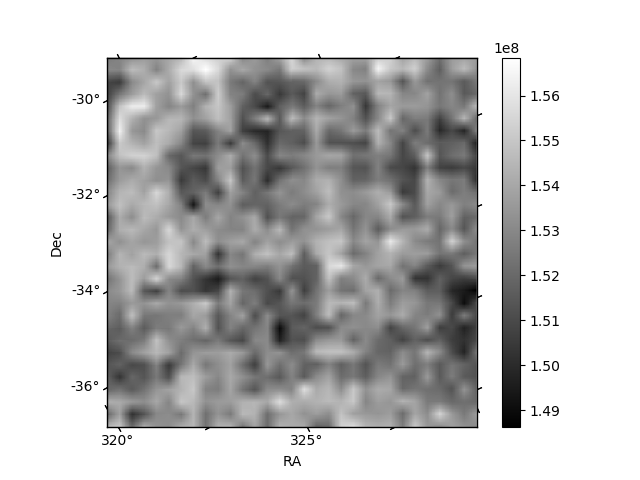
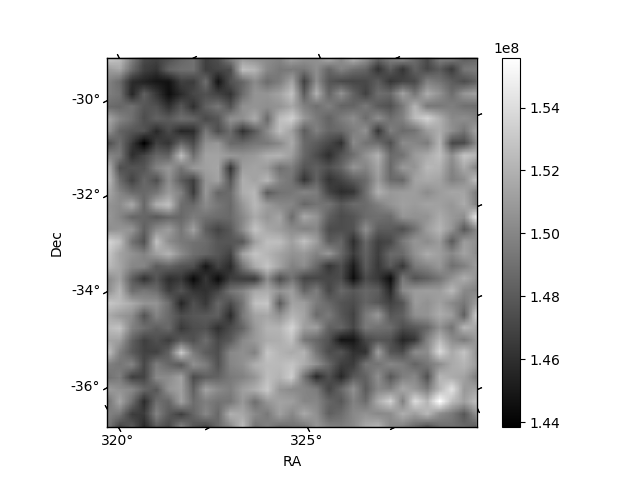
Histogram calculated using DETX and DETY for each event in the final _common_clean file
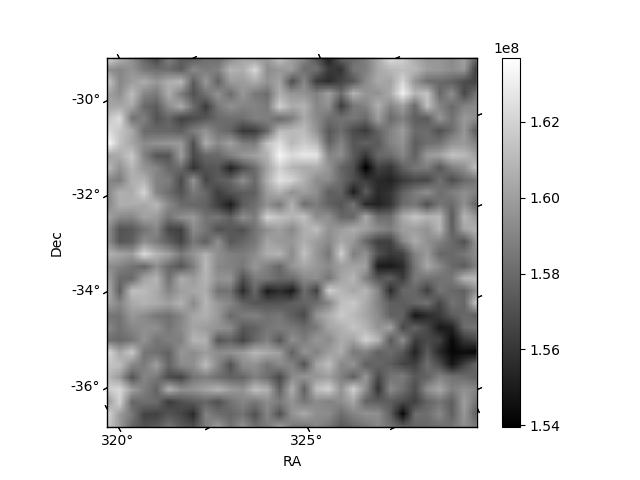
| Quadrant A | 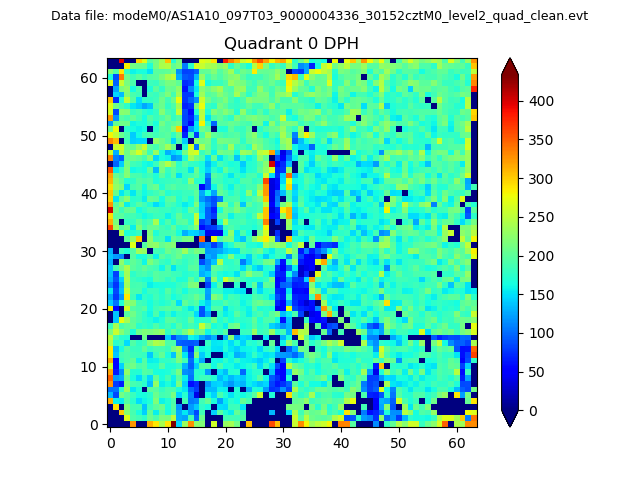 |
 |
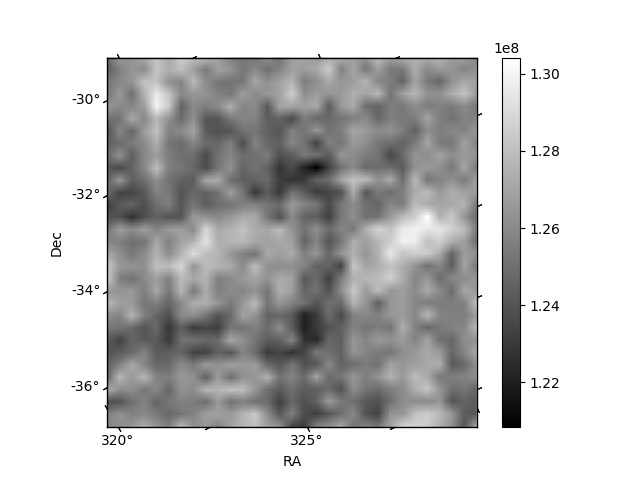
Quadrant B |
|---|---|---|---|
| Quadrant D | 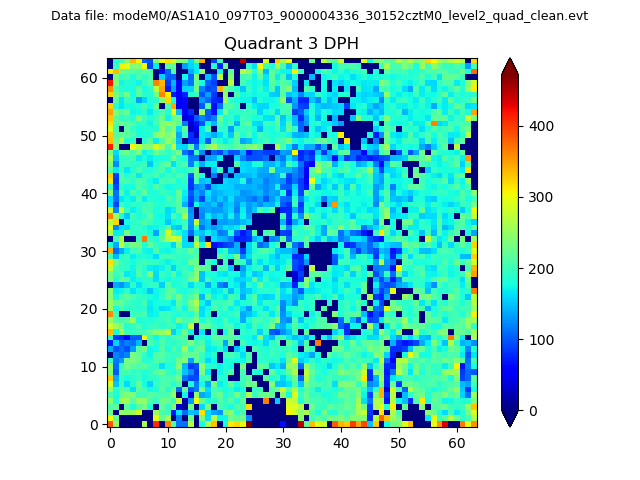 |
 |
Quadrant C |
| Plot type | Count rate plots | Images |
|---|---|---|
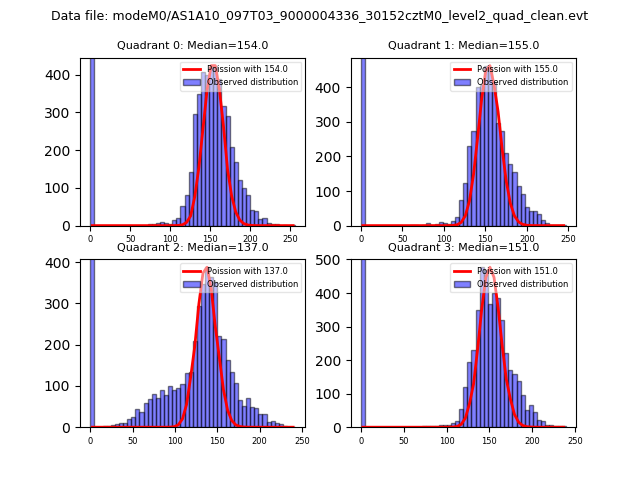
| Comparison with Poisson distribution Blue bars denote a histogram of data divided into 1 sec bins. Red curve is a Poisson curve with rate = median count rate of data. |
 |
 |
| Quadrant-wise count rates Data is divided into 100 sec bins |
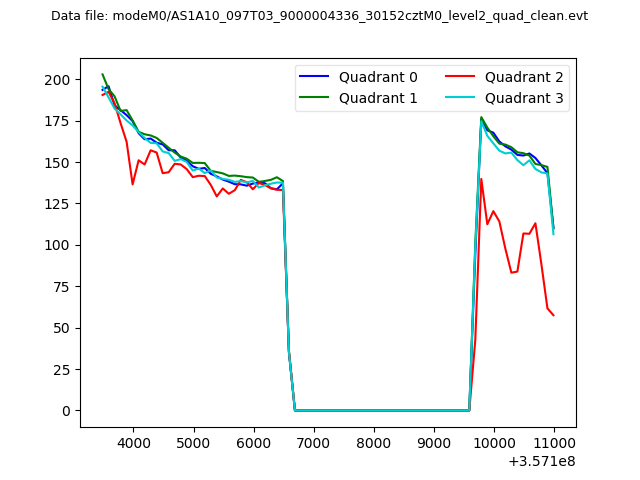 |
|
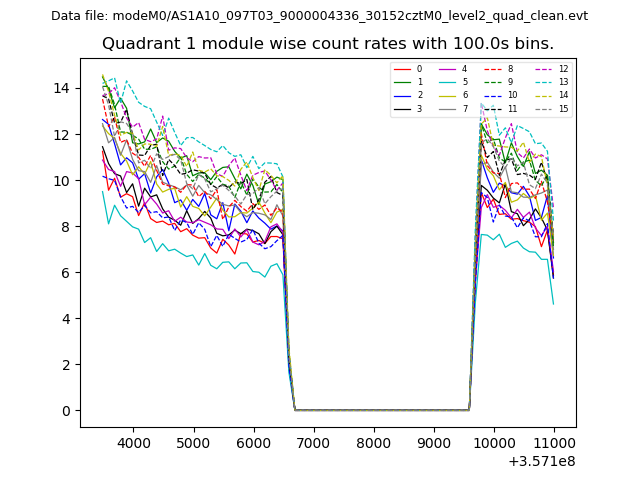
| Module-wise count rates for Quadrant A Data is divided into 100 sec bins |
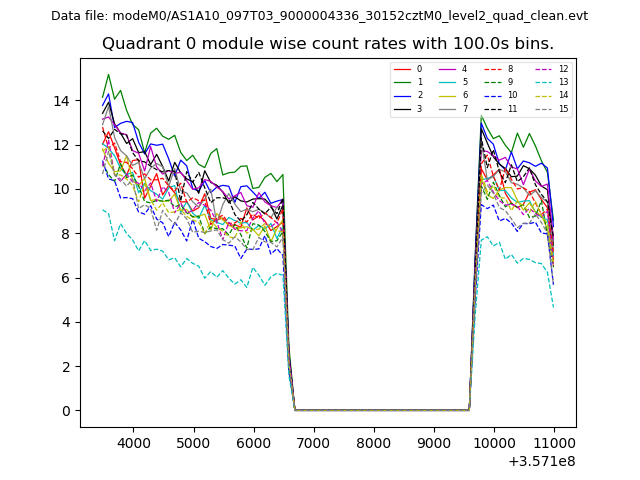 |
 |
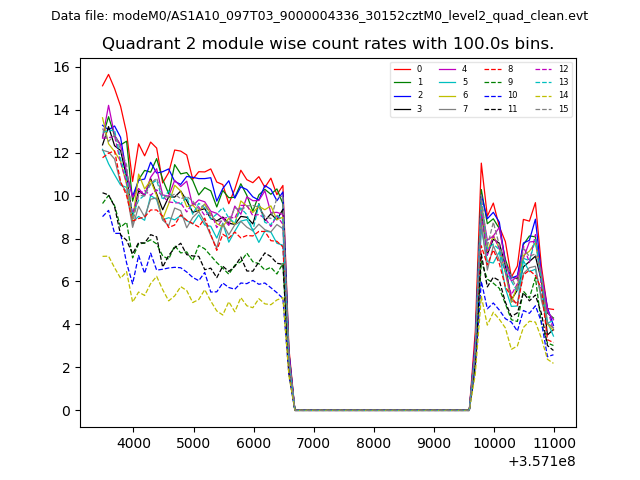
| Module-wise count rates for Quadrant B Data is divided into 100 sec bins |
 |
 |
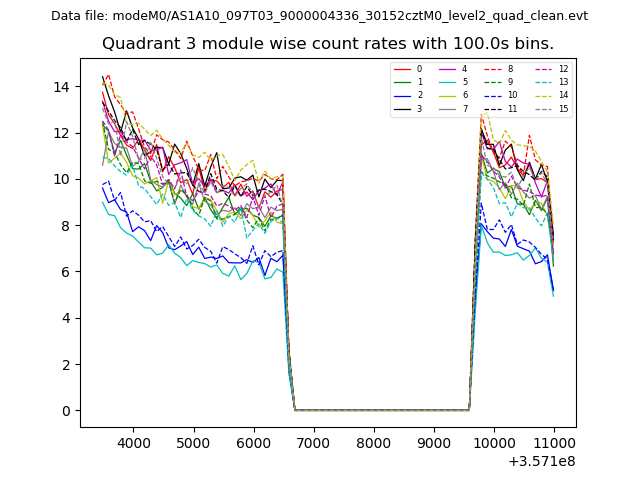
| Module-wise count rates for Quadrant C Data is divided into 100 sec bins |
 |
 |
| Module-wise count rates for Quadrant D Data is divided into 100 sec bins |
 |
 |
| Parameter | Plot |
|---|---|
| CZT HV Monitor | 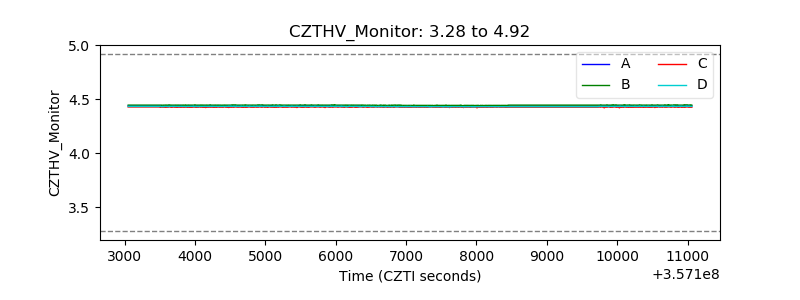 |
| D_VDD | 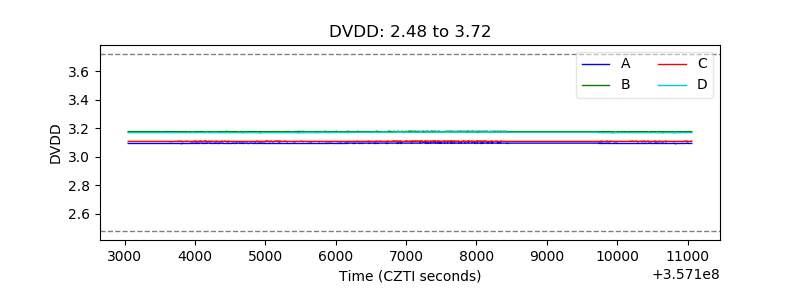 |
| Temperature 1 | 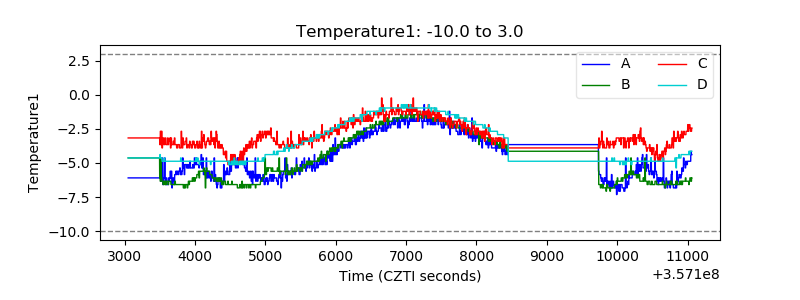 |
| Veto HV Monitor | 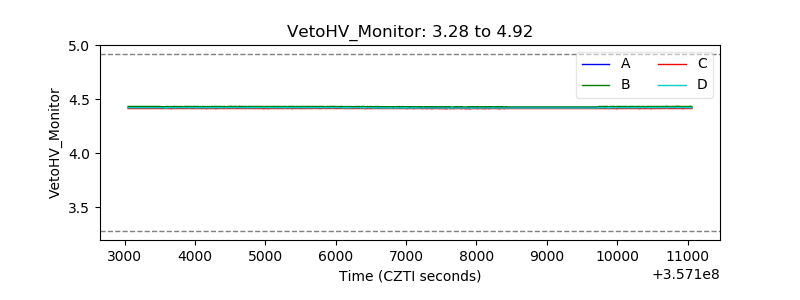 |
| Veto LLD | 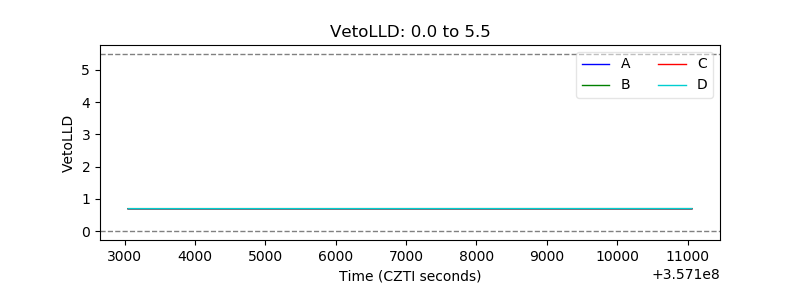 |
| Alpha Counter | 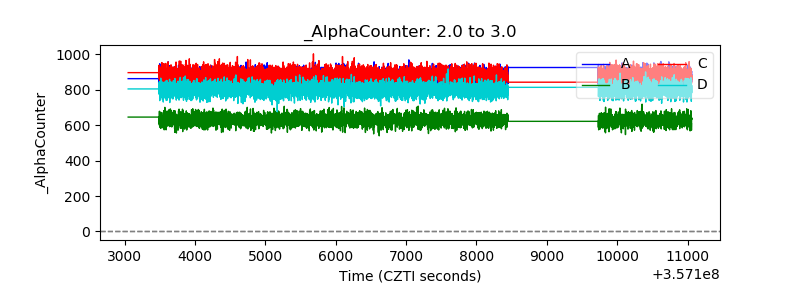 |
| _CPM_Rate | 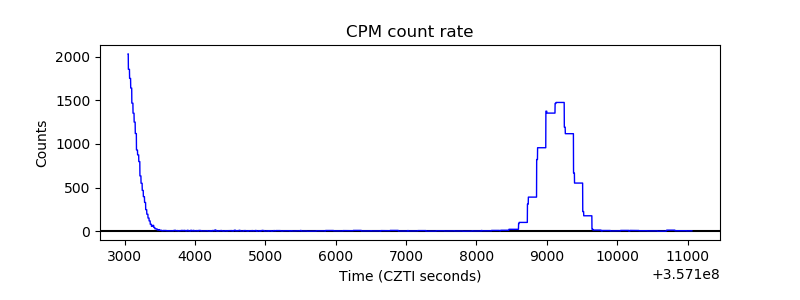 |
| CZT Counter | 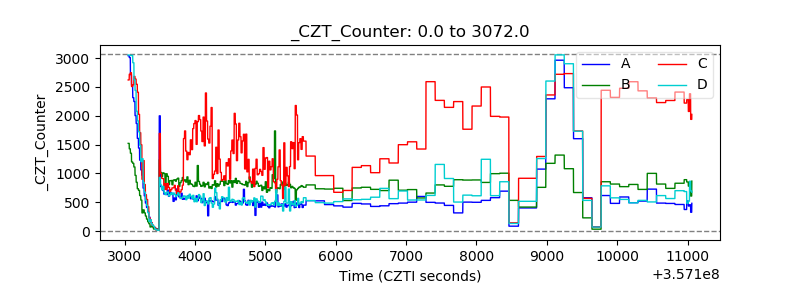 |
| +2.5 Volts monitor | 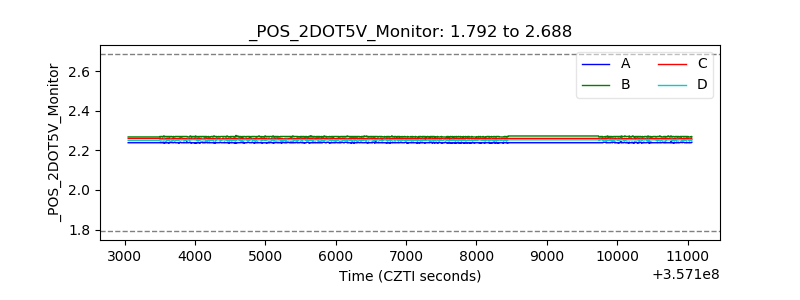 |
| +5 Volts monitor |  |
| _ROLL_ROT | 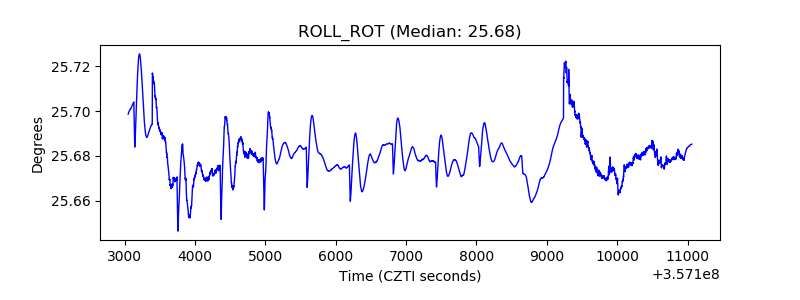 |
| _Roll_DEC | 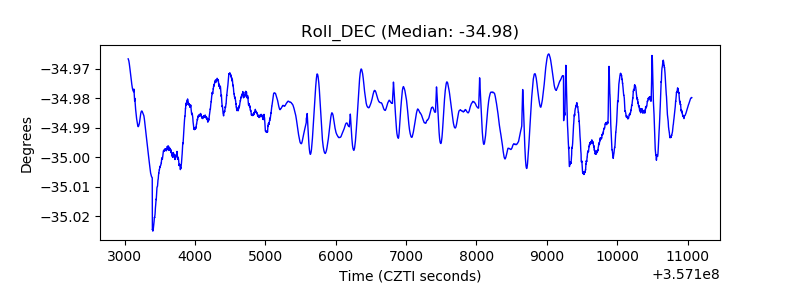 |
| _Roll_RA | 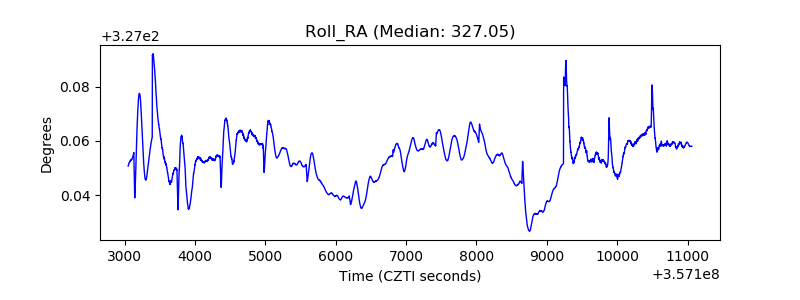 |
| Veto Counter | 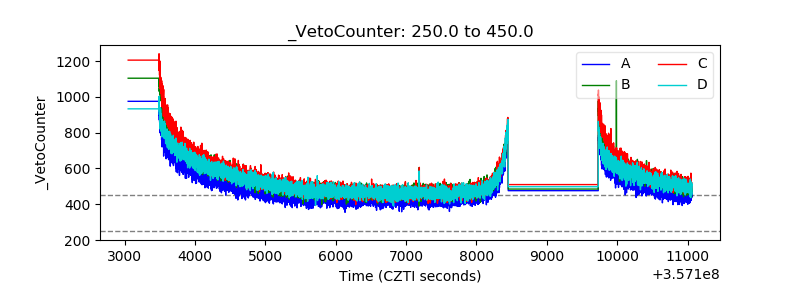 |