| Param | Original file | Final file |
|---|---|---|
| Filename | modeM0/AS1A10_097T03_9000004336_30153cztM0_level2.evt | modeM0/AS1A10_097T03_9000004336_30153cztM0_level2_quad_clean.evt |
| Size (bytes) | 803,185,920 | 80,968,320 |
| Size | 766.0 MB | 77.2 MB |
| Events in quadrant A | 2,989,613 | 545,444 |
| Events in quadrant B | 4,673,032 | 548,567 |
| Events in quadrant C | 12,136,759 | 411,684 |
| Events in quadrant D | 4,126,598 | 532,670 |
| Mode M9 | |||
|---|---|---|---|
| Quadrant | BADHDUFLAG | Total packets | Discarded packets |
| A | 0 | 11 | 0 |
| B | 0 | 11 | 0 |
| C | 0 | 11 | 0 |
| D | 0 | 11 | 0 |
| Mode SS | |||
|---|---|---|---|
| Quadrant | BADHDUFLAG | Total packets | Discarded packets |
| A | 0 | 120 | 0 |
| B | 0 | 120 | 0 |
| C | 0 | 120 | 0 |
| D | 0 | 120 | 0 |
| Mode M0 | |||
|---|---|---|---|
| Quadrant | BADHDUFLAG | Total packets | Discarded packets |
| A | 0 | 12512 | 1 |
| B | 0 | 17996 | 3 |
| C | 0 | 40088 | 1 |
| D | 0 | 16182 | 1 |
| Quadrant | Total seconds | Saturated seconds | Saturation percentage |
|---|---|---|---|
| A | 5905 | 56 | 0.948349% |
| B | 5904 | 148 | 2.506775% |
| C | 5904 | 4293 | 72.713415% |
| D | 5904 | 124 | 2.100271% |
Noise dominated data is calculated using 1-second bins in cleaned event files. If a bin has >2000 counts, and if more than 50% of those come from <1% of pixels, then it is considered to be noise-dominated and hence unusable.
| Quadrant | # 1 sec bins | Bins with >0 counts | Bins with >2000 counts | High rate bins dominated by noise | Noise dominated (total time) | Noise dominated (detector-on time) | Marked lightcurve |
|---|---|---|---|---|---|---|---|
| A | 7010 | 5906 | 5 | 5 | 0.07% | 0.08% | 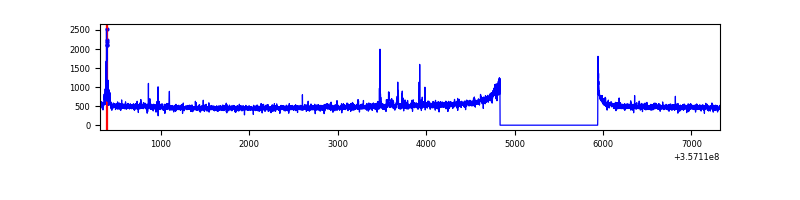 |
| B | 7009 | 5905 | 2 | 2 | 0.03% | 0.03% | 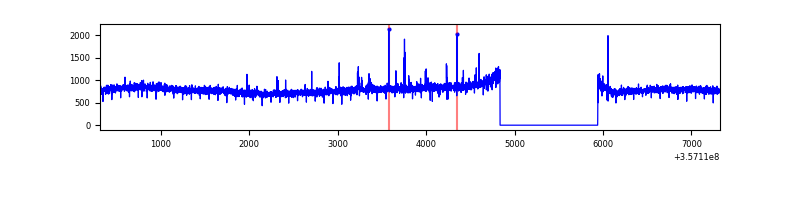 |
| C | 7009 | 5904 | 3359 | 3359 | 47.92% | 56.89% | 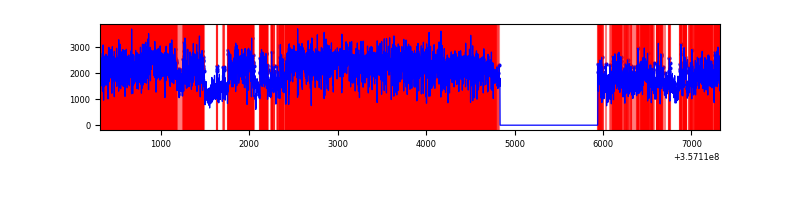 |
| D | 7009 | 5905 | 68 | 68 | 0.97% | 1.15% | 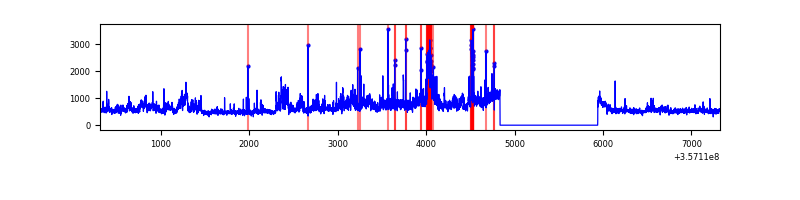 |
Top three noisy pixels from each quadrant. If the there are fewer than three noisy pixels in the level2.evt file, extra rows are filled as -1
| Pixel properties | Quadrant properties | ||||||
|---|---|---|---|---|---|---|---|
| Quadrant | DetID | PixID | Counts | Sigma | Mean | Median | Sigma |
| A | 0 | 13 | 66730 | 434.68 | 754 | 739 | 151.8 |
| A | 8 | 192 | 11235 | 69.14 | 754 | 739 | 151.8 |
| A | 13 | 254 | 11148 | 68.56 | 754 | 739 | 151.8 |
| B | 6 | 159 | 1722425 | 12177.11 | 743 | 724 | 141.4 |
| B | 12 | 111 | 16883 | 114.29 | 743 | 724 | 141.4 |
| B | 11 | 111 | 15442 | 104.1 | 743 | 724 | 141.4 |
| C | 3 | 233 | 9823922 | 75373.32 | 561 | 566 | 130.3 |
| C | 14 | 238 | 91568 | 698.25 | 561 | 566 | 130.3 |
| C | 2 | 114 | 10964 | 79.78 | 561 | 566 | 130.3 |
| D | 12 | 227 | 639861 | 3616.41 | 744 | 726 | 176.7 |
| D | 8 | 195 | 536068 | 3029.12 | 744 | 726 | 176.7 |
| D | 13 | 249 | 54463 | 304.06 | 744 | 726 | 176.7 |
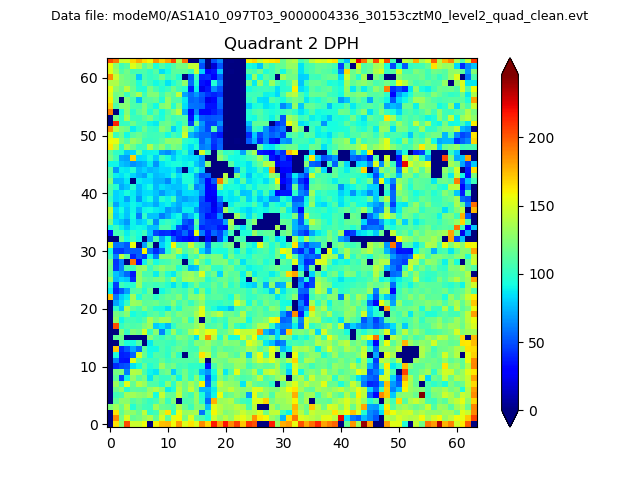
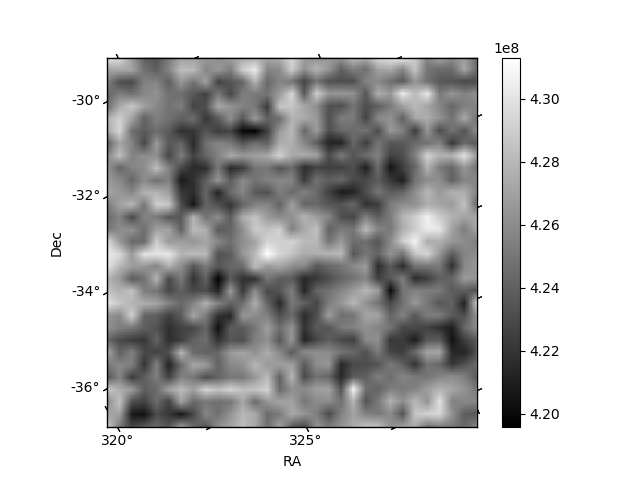
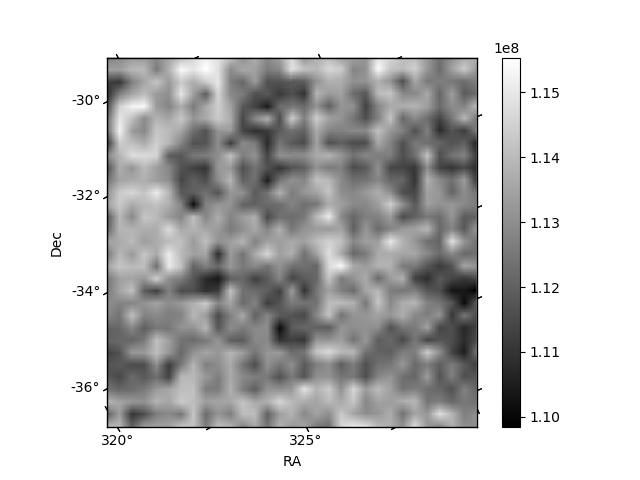
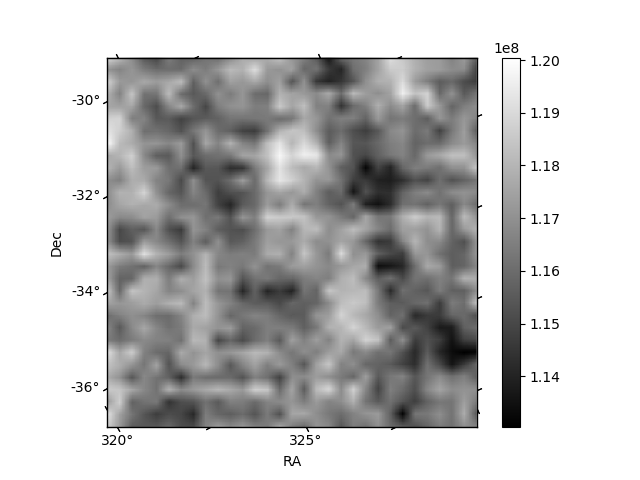
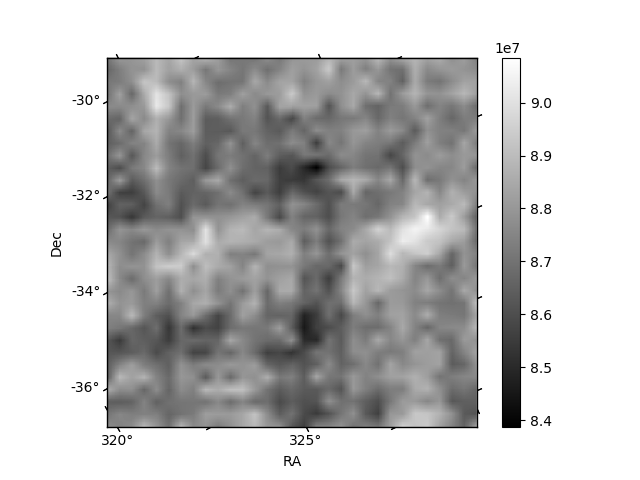
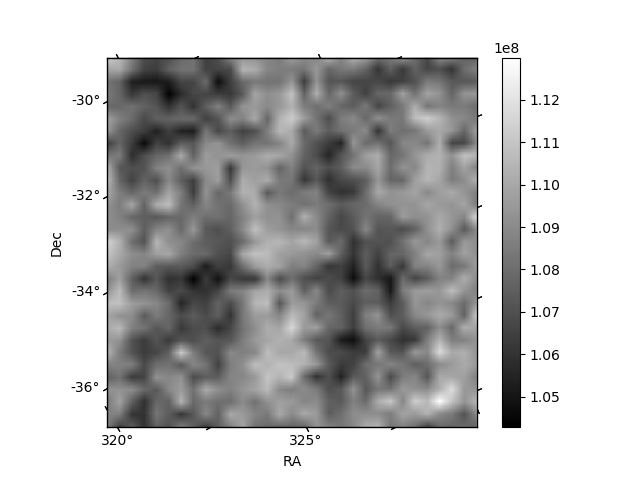
Histogram calculated using DETX and DETY for each event in the final _common_clean file
| Quadrant A | 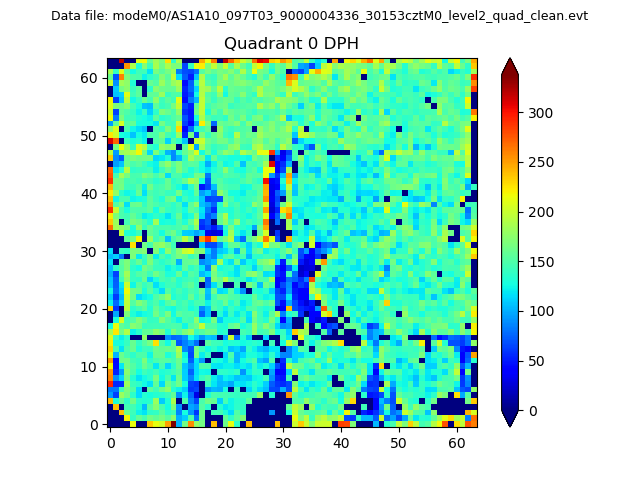 |
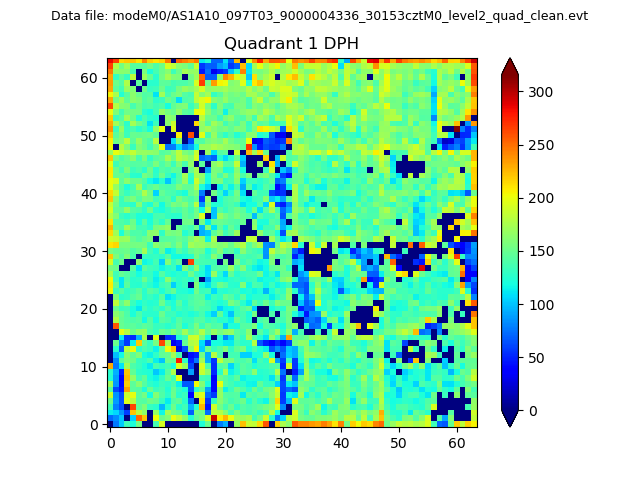 |
Quadrant B |
|---|---|---|---|
| Quadrant D | 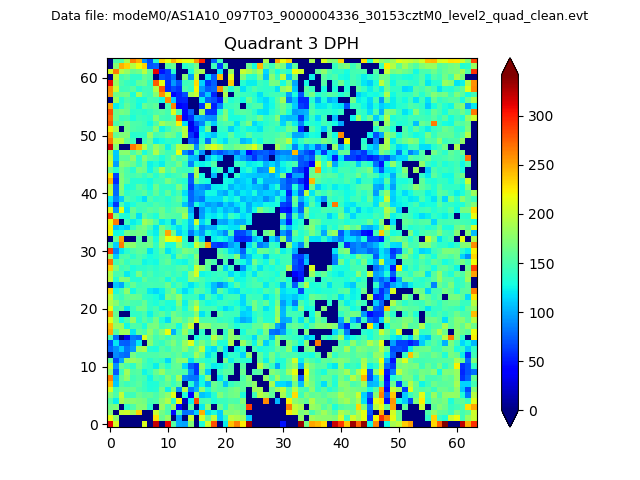 |
 |
Quadrant C |
| Plot type | Count rate plots | Images |
|---|---|---|
| Comparison with Poisson distribution Blue bars denote a histogram of data divided into 1 sec bins. Red curve is a Poisson curve with rate = median count rate of data. |
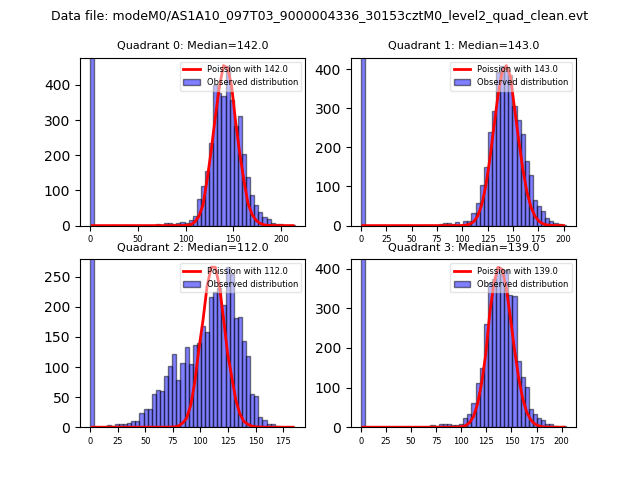 |
 |
| Quadrant-wise count rates Data is divided into 100 sec bins |
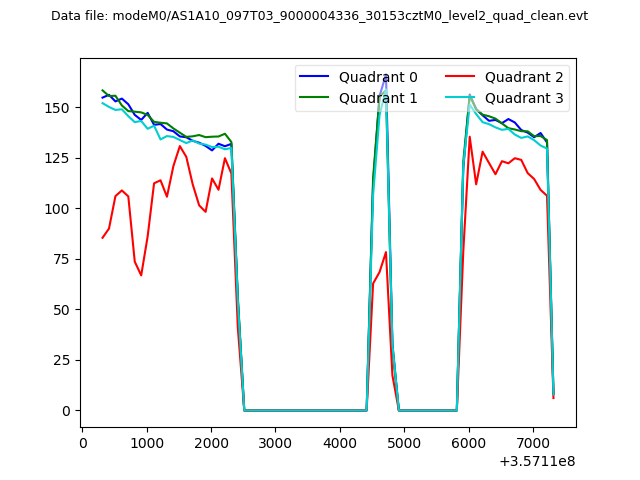 |
|
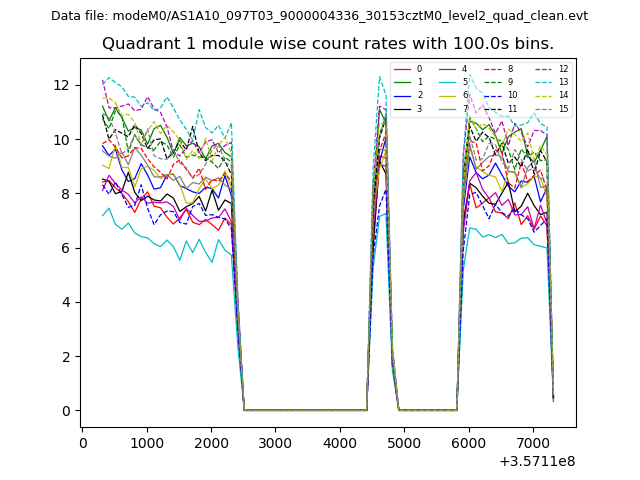
| Module-wise count rates for Quadrant A Data is divided into 100 sec bins |
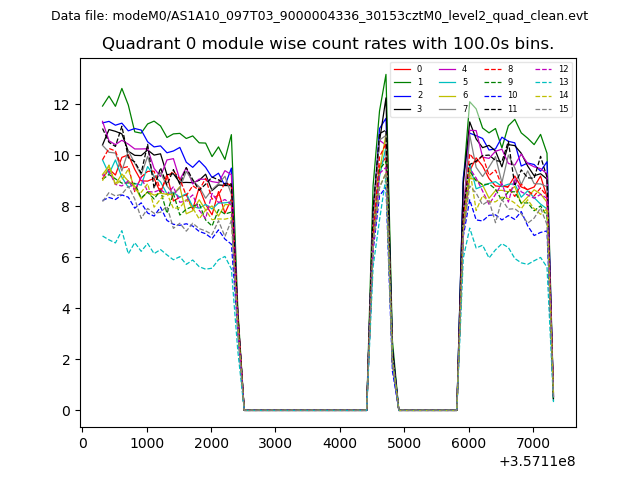 |
 |
| Module-wise count rates for Quadrant B Data is divided into 100 sec bins |
 |
 |
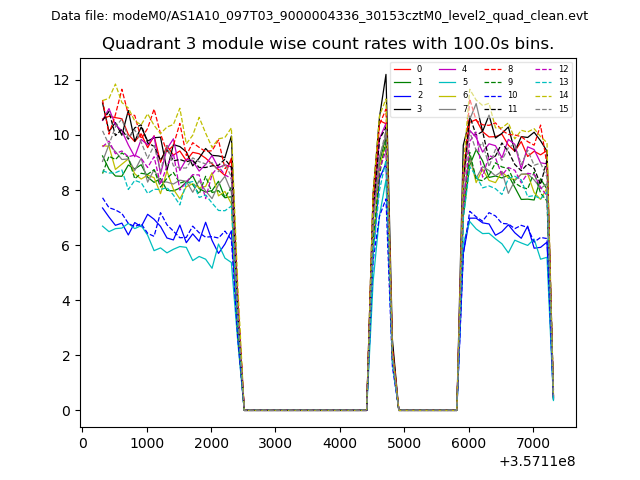
| Module-wise count rates for Quadrant C Data is divided into 100 sec bins |
 |
 |
| Module-wise count rates for Quadrant D Data is divided into 100 sec bins |
 |
 |
| Parameter | Plot |
|---|---|
| CZT HV Monitor | 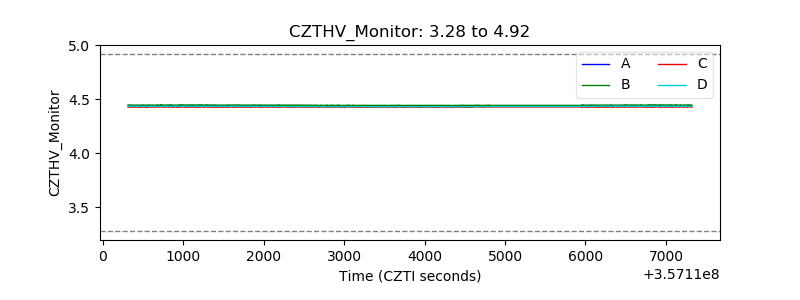 |
| D_VDD | 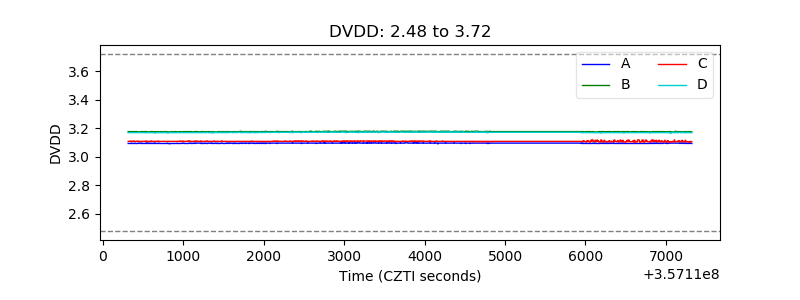 |
| Temperature 1 | 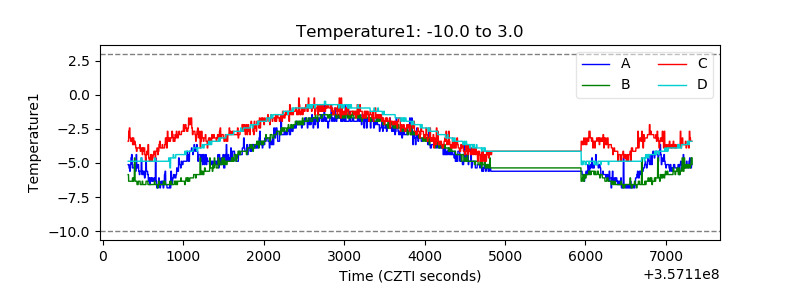 |
| Veto HV Monitor | 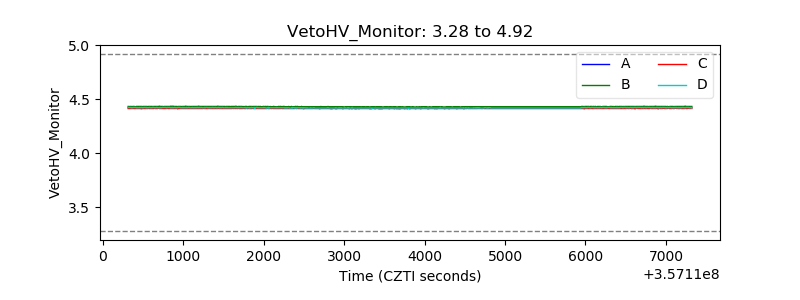 |
| Veto LLD | 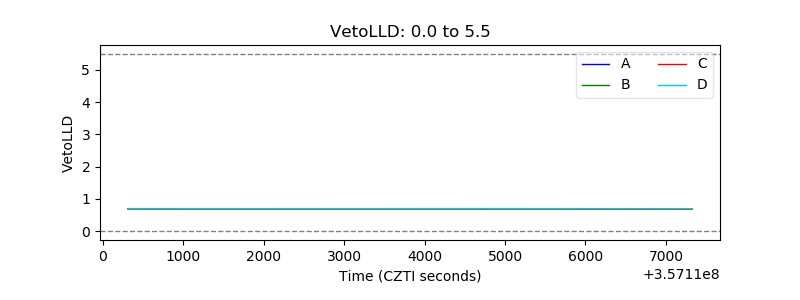 |
| Alpha Counter | 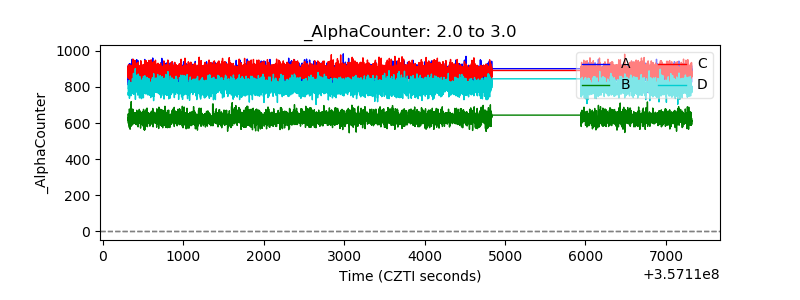 |
| _CPM_Rate | 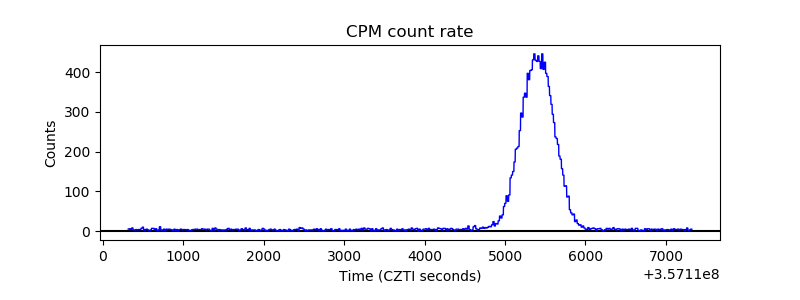 |
| CZT Counter | 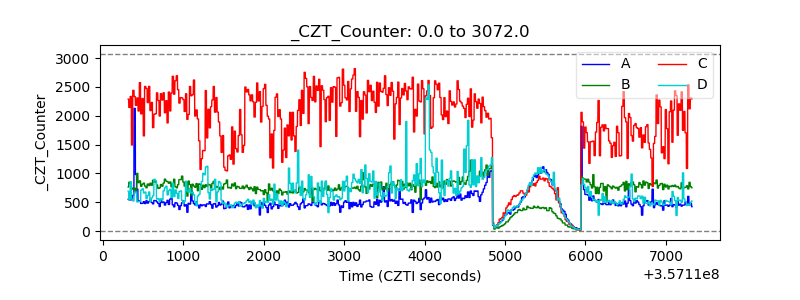 |
| +2.5 Volts monitor | 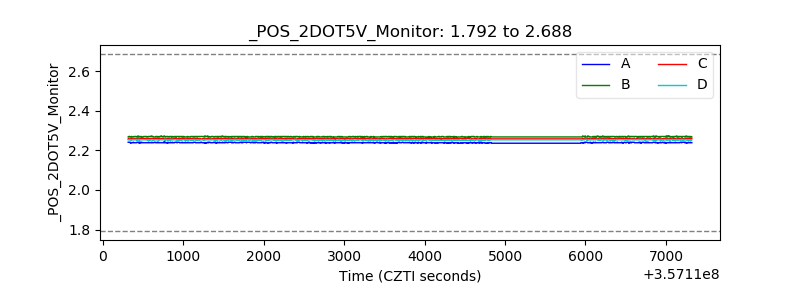 |
| +5 Volts monitor |  |
| _ROLL_ROT | 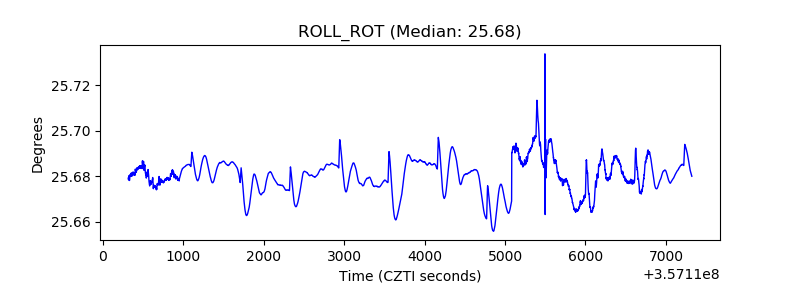 |
| _Roll_DEC | 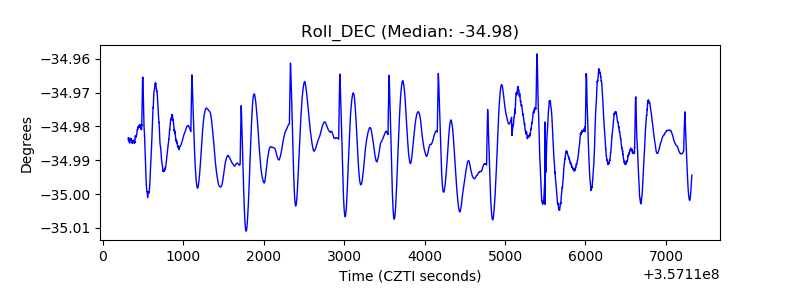 |
| _Roll_RA | 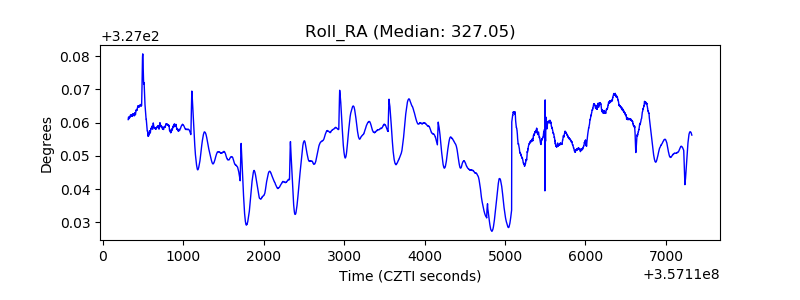 |
| Veto Counter | 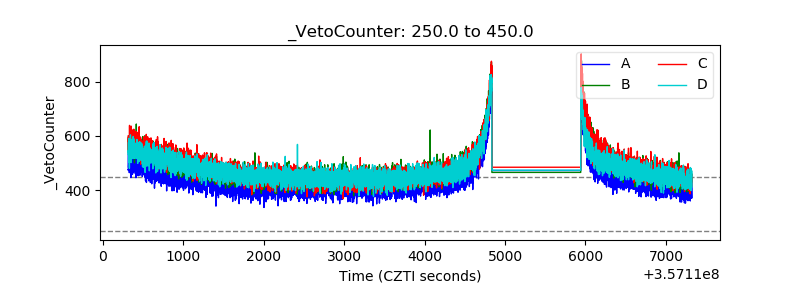 |