| Param | Original file | Final file |
|---|---|---|
| Filename | modeM0/AS1A10_097T03_9000004336_30159cztM0_level2.evt | modeM0/AS1A10_097T03_9000004336_30159cztM0_level2_quad_clean.evt |
| Size (bytes) | 331,447,680 | 42,039,360 |
| Size | 316.1 MB | 40.1 MB |
| Events in quadrant A | 1,845,427 | 252,819 |
| Events in quadrant B | 3,058,096 | 249,921 |
| Events in quadrant C | 2,699,982 | 241,362 |
| Events in quadrant D | 2,157,406 | 241,488 |
| Mode SS | |||
|---|---|---|---|
| Quadrant | BADHDUFLAG | Total packets | Discarded packets |
| A | 0 | 82 | 0 |
| B | 0 | 82 | 0 |
| C | 0 | 82 | 0 |
| D | 0 | 82 | 0 |
| Mode M0 | |||
|---|---|---|---|
| Quadrant | BADHDUFLAG | Total packets | Discarded packets |
| A | 0 | 8220 | 1 |
| B | 0 | 12297 | 1 |
| C | 0 | 10782 | 1 |
| D | 0 | 8912 | 1 |
| Quadrant | Total seconds | Saturated seconds | Saturation percentage |
|---|---|---|---|
| A | 4065 | 2 | 0.049200% |
| B | 4066 | 21 | 0.516478% |
| C | 4066 | 76 | 1.869159% |
| D | 4066 | 32 | 0.787014% |
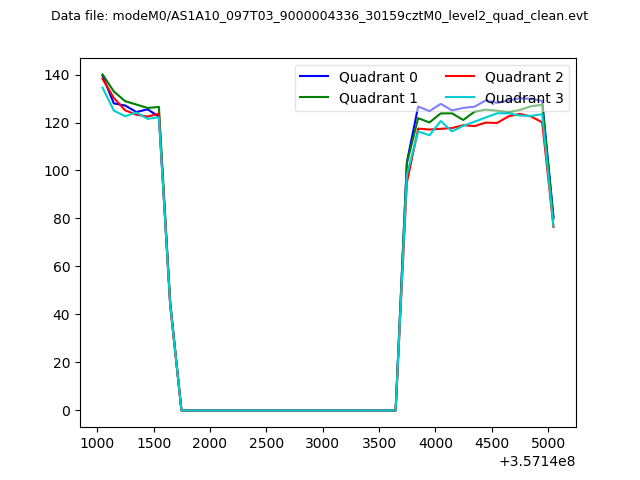
Noise dominated data is calculated using 1-second bins in cleaned event files. If a bin has >2000 counts, and if more than 50% of those come from <1% of pixels, then it is considered to be noise-dominated and hence unusable.
| Quadrant | # 1 sec bins | Bins with >0 counts | Bins with >2000 counts | High rate bins dominated by noise | Noise dominated (total time) | Noise dominated (detector-on time) | Marked lightcurve |
|---|---|---|---|---|---|---|---|
| A | 4065 | 4065 | 0 | 0 | 0.00% | 0.00% | 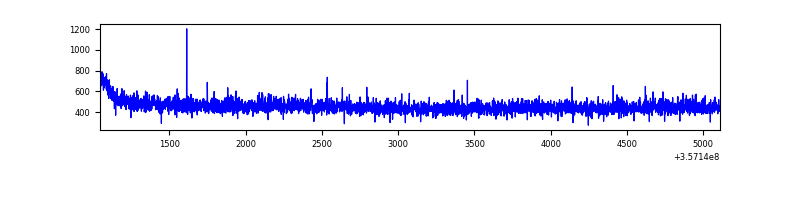 |
| B | 4066 | 4066 | 2 | 2 | 0.05% | 0.05% | 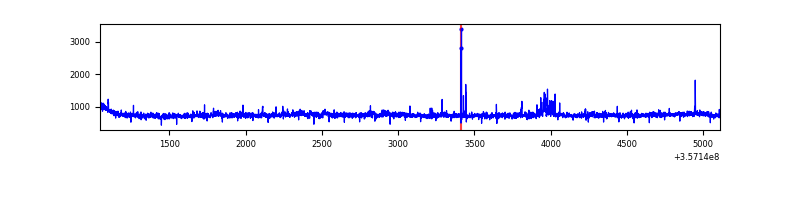 |
| C | 4066 | 4066 | 29 | 29 | 0.71% | 0.71% | 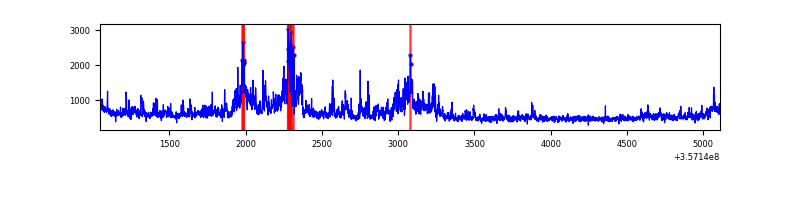 |
| D | 4066 | 4066 | 24 | 24 | 0.59% | 0.59% | 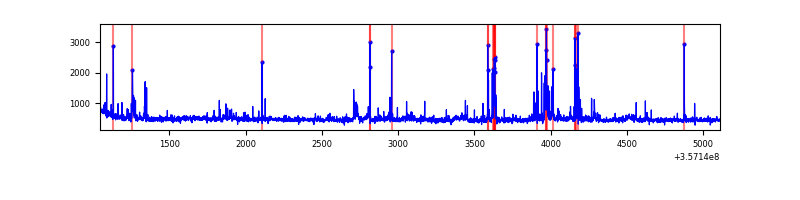 |
Top three noisy pixels from each quadrant. If the there are fewer than three noisy pixels in the level2.evt file, extra rows are filled as -1
| Pixel properties | Quadrant properties | ||||||
|---|---|---|---|---|---|---|---|
| Quadrant | DetID | PixID | Counts | Sigma | Mean | Median | Sigma |
| A | 13 | 254 | 7680 | 73.95 | 476 | 465 | 97.6 |
| A | 3 | 1 | 4868 | 45.13 | 476 | 465 | 97.6 |
| A | 3 | 137 | 4758 | 44.0 | 476 | 465 | 97.6 |
| B | 6 | 159 | 1140595 | 12508.33 | 470 | 458 | 91.2 |
| B | 3 | 64 | 25601 | 275.84 | 470 | 458 | 91.2 |
| B | 0 | 190 | 18495 | 197.88 | 470 | 458 | 91.2 |
| C | 3 | 233 | 859478 | 7972.56 | 451 | 452 | 107.7 |
| C | 14 | 238 | 72048 | 664.48 | 451 | 452 | 107.7 |
| C | 2 | 114 | 9409 | 83.13 | 451 | 452 | 107.7 |
| D | 8 | 195 | 127916 | 1069.22 | 457 | 448 | 119.2 |
| D | 2 | 250 | 112959 | 943.75 | 457 | 448 | 119.2 |
| D | 13 | 249 | 83008 | 692.52 | 457 | 448 | 119.2 |
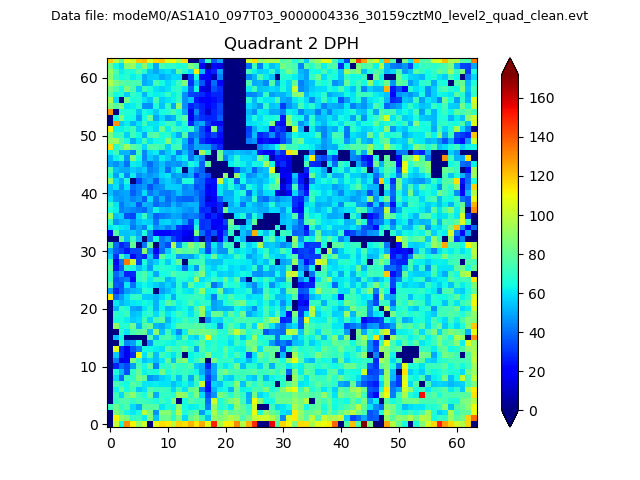
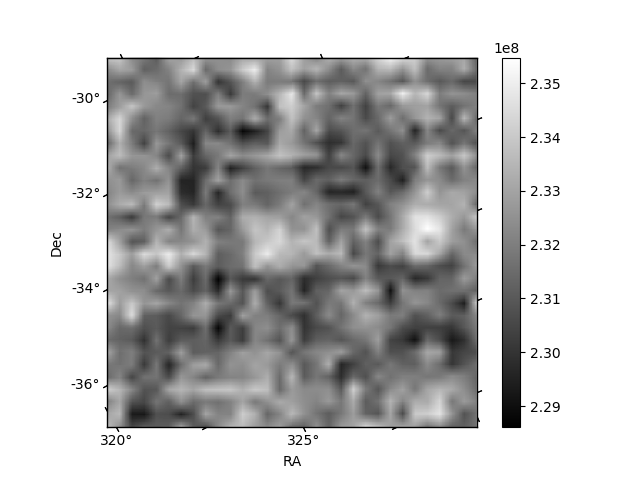
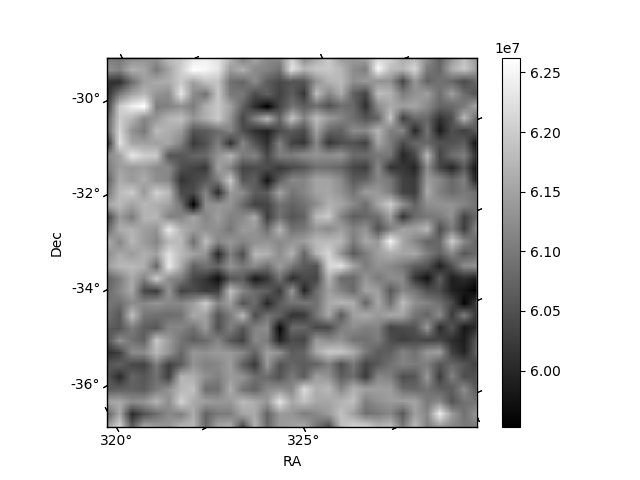
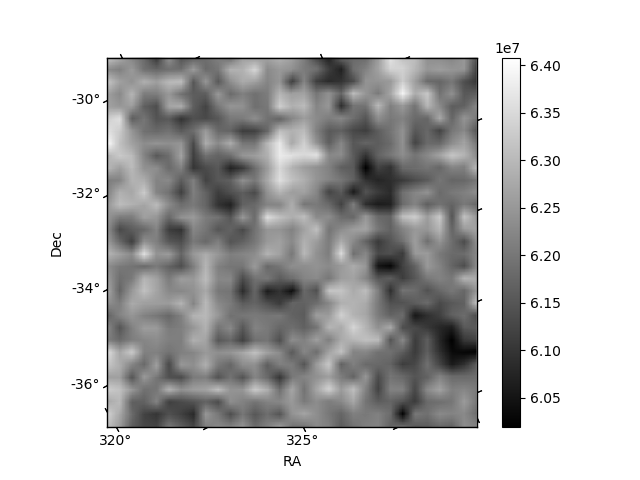
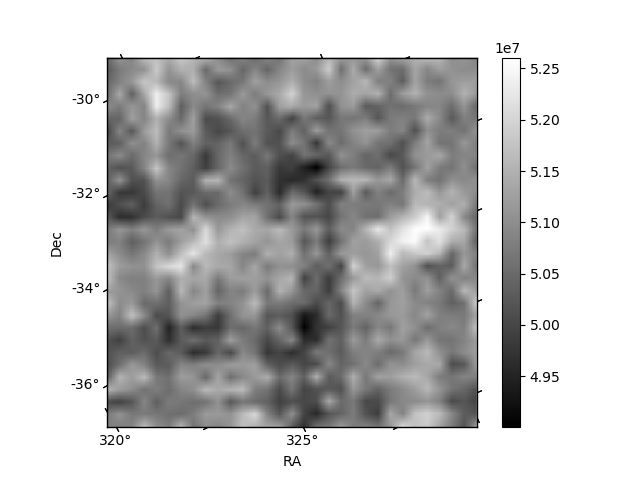
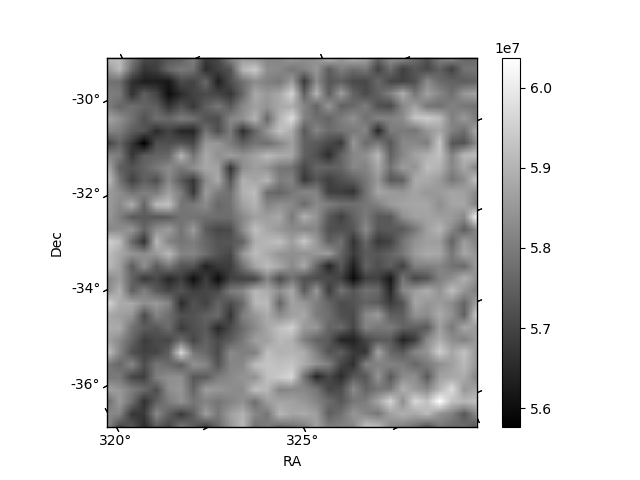
Histogram calculated using DETX and DETY for each event in the final _common_clean file
| Quadrant A | 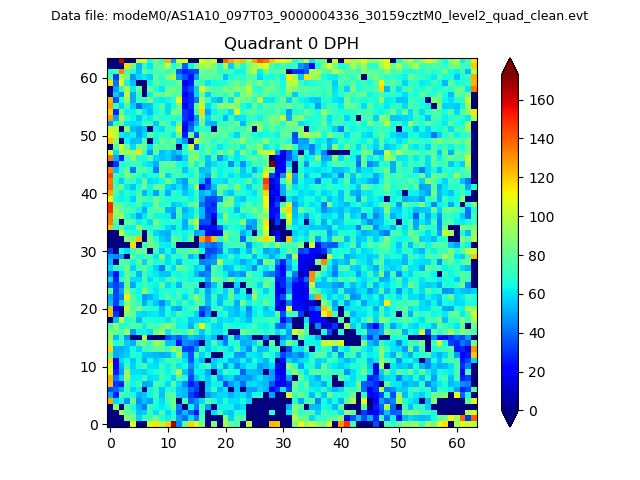 |
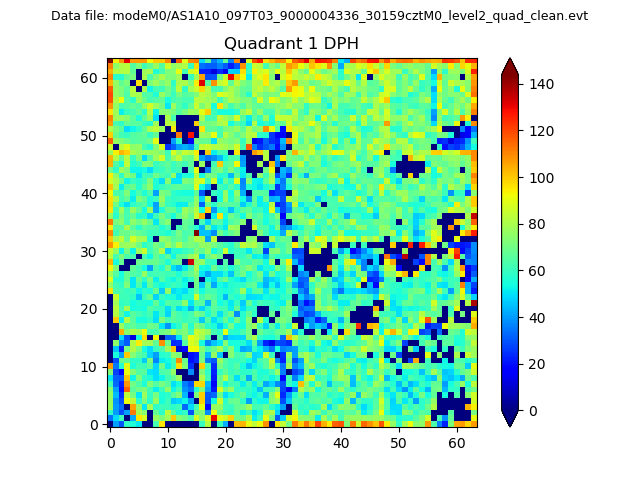 |
Quadrant B |
|---|---|---|---|
| Quadrant D | 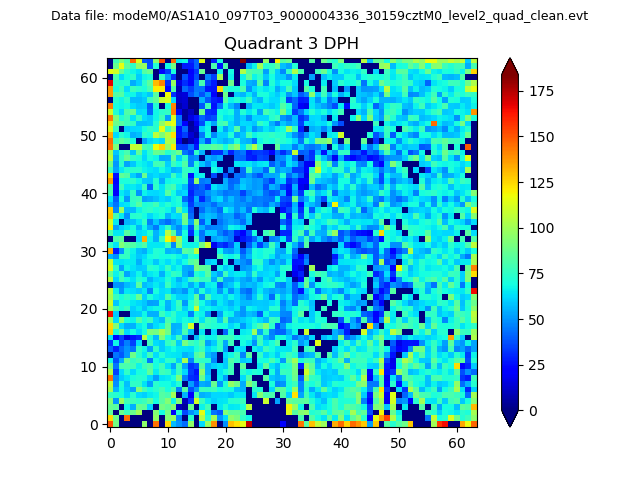 |
 |
Quadrant C |
| Plot type | Count rate plots | Images |
|---|---|---|
| Comparison with Poisson distribution Blue bars denote a histogram of data divided into 1 sec bins. Red curve is a Poisson curve with rate = median count rate of data. |
 |
 |
| Quadrant-wise count rates Data is divided into 100 sec bins |
 |
|
| Module-wise count rates for Quadrant A Data is divided into 100 sec bins |
 |
 |
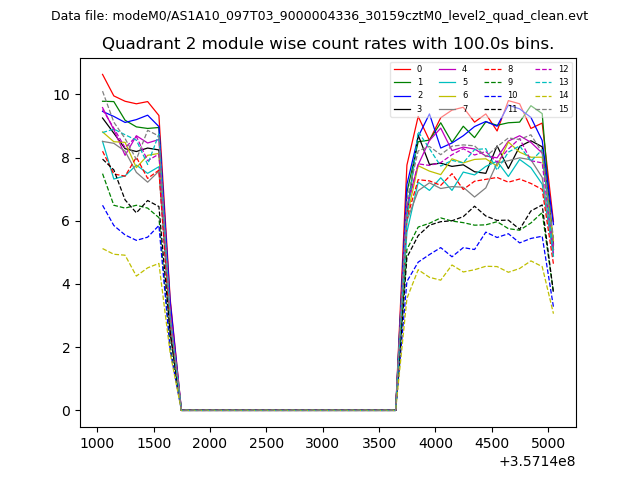
| Module-wise count rates for Quadrant B Data is divided into 100 sec bins |
 |
 |
| Module-wise count rates for Quadrant C Data is divided into 100 sec bins |
 |
 |
| Module-wise count rates for Quadrant D Data is divided into 100 sec bins |
 |
 |
| Parameter | Plot |
|---|---|
| CZT HV Monitor | 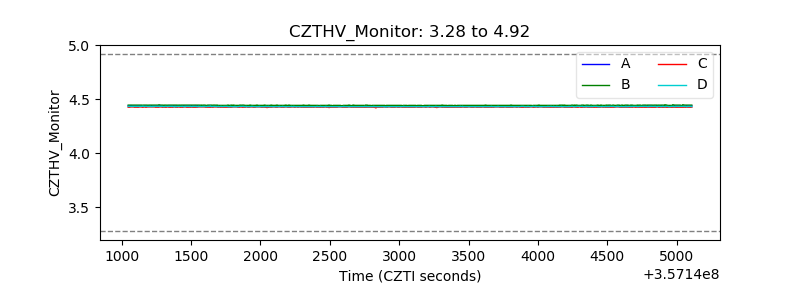 |
| D_VDD | 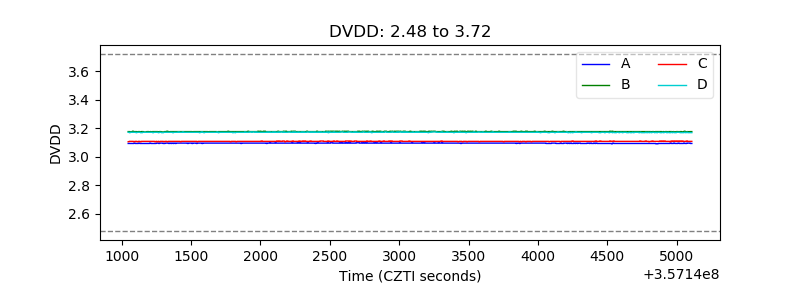 |
| Temperature 1 | 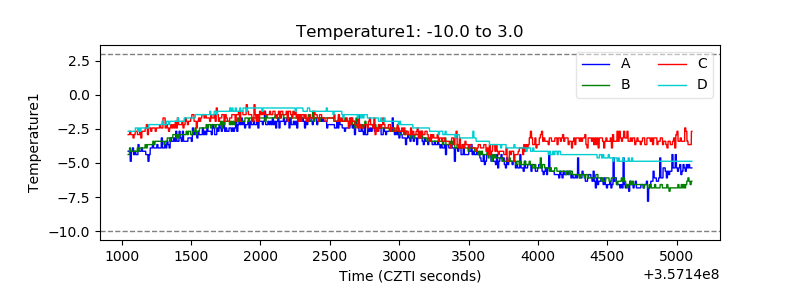 |
| Veto HV Monitor | 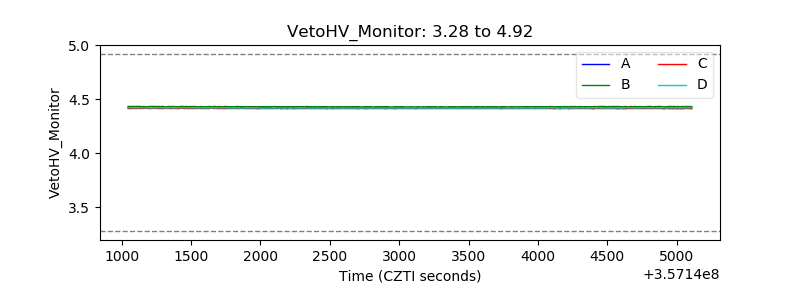 |
| Veto LLD | 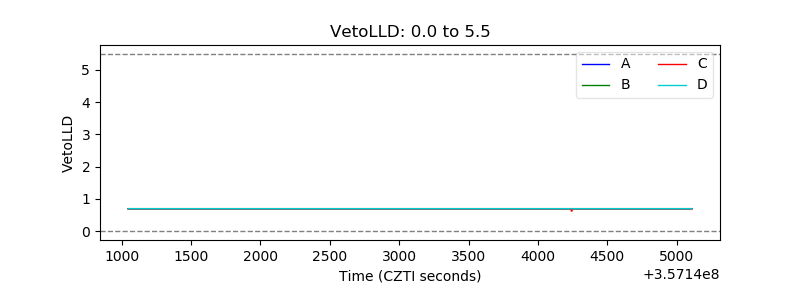 |
| Alpha Counter | 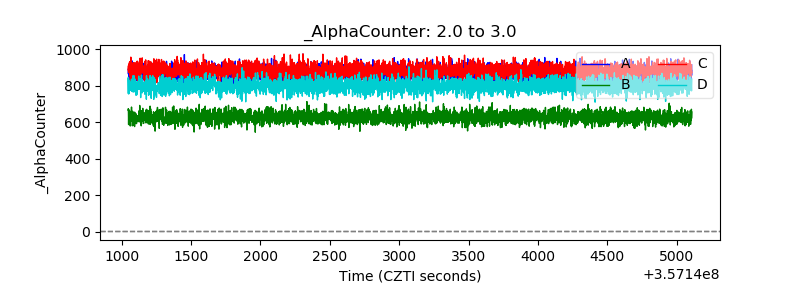 |
| _CPM_Rate | 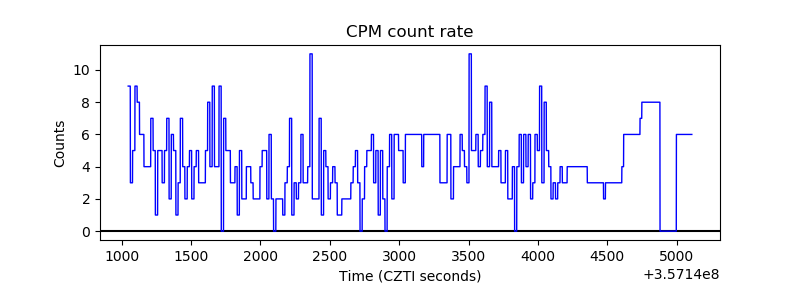 |
| CZT Counter | 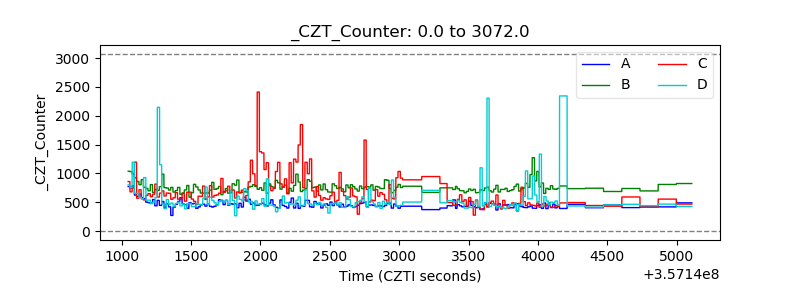 |
| +2.5 Volts monitor | 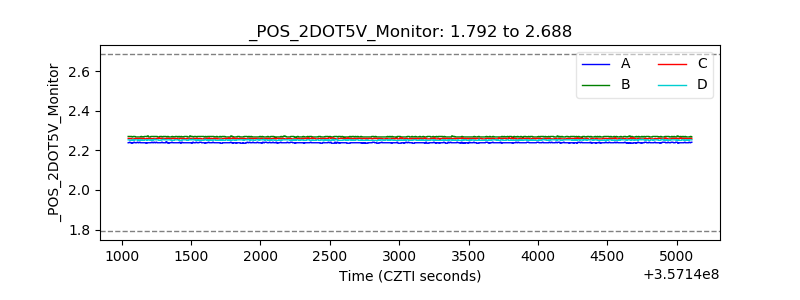 |
| +5 Volts monitor |  |
| _ROLL_ROT |  |
| _Roll_DEC |  |
| _Roll_RA | 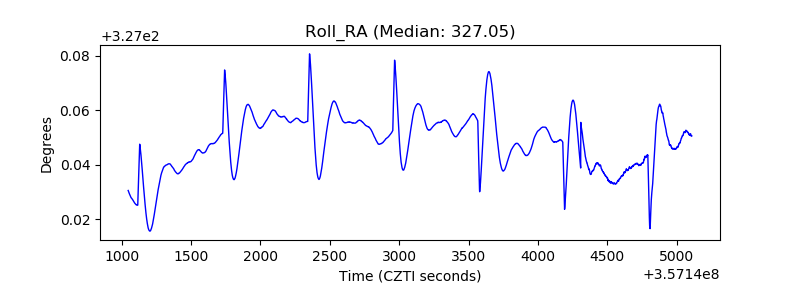 |
| Veto Counter |  |