| Param | Original file | Final file |
|---|---|---|
| Filename | modeM0/AS1A10_097T03_9000004336_30161cztM0_level2.evt | modeM0/AS1A10_097T03_9000004336_30161cztM0_level2_quad_clean.evt |
| Size (bytes) | 517,121,280 | 86,328,000 |
| Size | 493.2 MB | 82.3 MB |
| Events in quadrant A | 3,218,613 | 551,526 |
| Events in quadrant B | 5,215,583 | 543,411 |
| Events in quadrant C | 3,307,485 | 527,615 |
| Events in quadrant D | 3,470,192 | 529,593 |
| Mode M9 | |||
|---|---|---|---|
| Quadrant | BADHDUFLAG | Total packets | Discarded packets |
| A | 0 | 11 | 0 |
| B | 0 | 12 | 0 |
| C | 0 | 12 | 0 |
| D | 0 | 12 | 0 |
| Mode SS | |||
|---|---|---|---|
| Quadrant | BADHDUFLAG | Total packets | Discarded packets |
| A | 0 | 134 | 0 |
| B | 0 | 134 | 0 |
| C | 0 | 134 | 0 |
| D | 0 | 134 | 0 |
| Mode M0 | |||
|---|---|---|---|
| Quadrant | BADHDUFLAG | Total packets | Discarded packets |
| A | 0 | 13779 | 2 |
| B | 0 | 20130 | 2 |
| C | 0 | 13976 | 2 |
| D | 0 | 14547 | 3 |
| Quadrant | Total seconds | Saturated seconds | Saturation percentage |
|---|---|---|---|
| A | 6629 | 43 | 0.648665% |
| B | 6629 | 93 | 1.402927% |
| C | 6629 | 60 | 0.905114% |
| D | 6628 | 40 | 0.603500% |
Noise dominated data is calculated using 1-second bins in cleaned event files. If a bin has >2000 counts, and if more than 50% of those come from <1% of pixels, then it is considered to be noise-dominated and hence unusable.
| Quadrant | # 1 sec bins | Bins with >0 counts | Bins with >2000 counts | High rate bins dominated by noise | Noise dominated (total time) | Noise dominated (detector-on time) | Marked lightcurve |
|---|---|---|---|---|---|---|---|
| A | 7654 | 6630 | 4 | 4 | 0.05% | 0.06% |  |
| B | 7654 | 6630 | 5 | 5 | 0.07% | 0.08% |  |
| C | 7654 | 6630 | 0 | 0 | 0.00% | 0.00% |  |
| D | 7653 | 6629 | 18 | 18 | 0.24% | 0.27% |  |
Top three noisy pixels from each quadrant. If the there are fewer than three noisy pixels in the level2.evt file, extra rows are filled as -1
| Pixel properties | Quadrant properties | ||||||
|---|---|---|---|---|---|---|---|
| Quadrant | DetID | PixID | Counts | Sigma | Mean | Median | Sigma |
| A | 8 | 192 | 26340 | 154.08 | 827 | 810 | 165.7 |
| A | 13 | 254 | 12739 | 71.99 | 827 | 810 | 165.7 |
| A | 3 | 137 | 8261 | 44.97 | 827 | 810 | 165.7 |
| B | 6 | 159 | 1941735 | 12375.5 | 817 | 797 | 156.8 |
| B | 4 | 171 | 33266 | 207.02 | 817 | 797 | 156.8 |
| B | 0 | 190 | 23749 | 146.34 | 817 | 797 | 156.8 |
| C | 14 | 238 | 127569 | 688.7 | 792 | 799 | 184.1 |
| C | 3 | 233 | 66835 | 358.75 | 792 | 799 | 184.1 |
| C | 2 | 114 | 15500 | 79.86 | 792 | 799 | 184.1 |
| D | 8 | 195 | 174889 | 853.99 | 795 | 778 | 203.9 |
| D | 12 | 233 | 82242 | 399.57 | 795 | 778 | 203.9 |
| D | 2 | 250 | 62952 | 304.95 | 795 | 778 | 203.9 |
Histogram calculated using DETX and DETY for each event in the final _common_clean file
| Quadrant A |  |
 |
Quadrant B |
|---|---|---|---|
| Quadrant D |  |
 |
Quadrant C |
| Plot type | Count rate plots | Images |
|---|---|---|
| Comparison with Poisson distribution Blue bars denote a histogram of data divided into 1 sec bins. Red curve is a Poisson curve with rate = median count rate of data. |
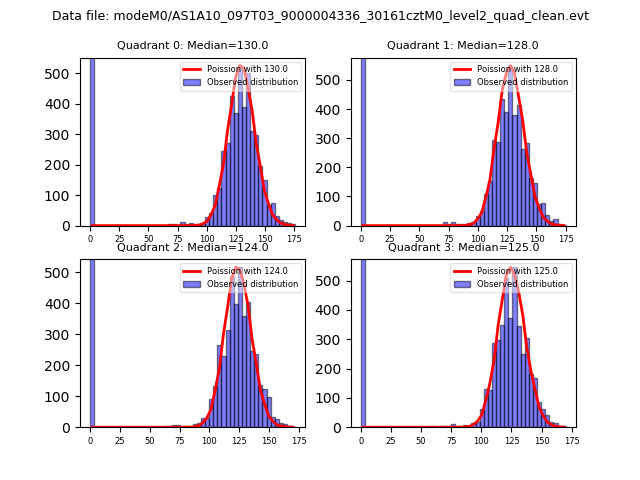 |
 |
| Quadrant-wise count rates Data is divided into 100 sec bins |
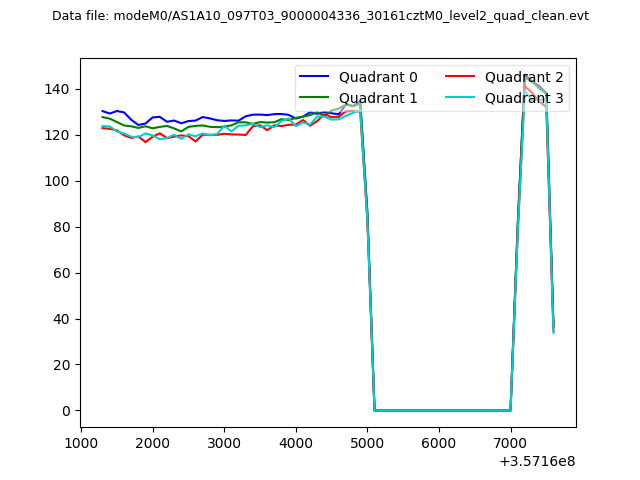 |
|
| Module-wise count rates for Quadrant A Data is divided into 100 sec bins |
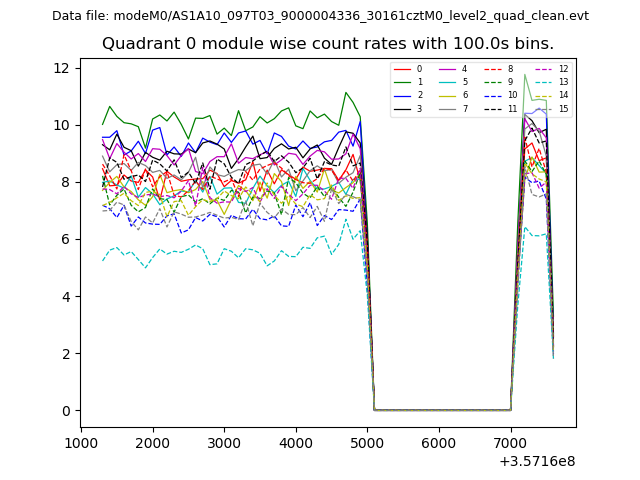 |
 |
| Module-wise count rates for Quadrant B Data is divided into 100 sec bins |
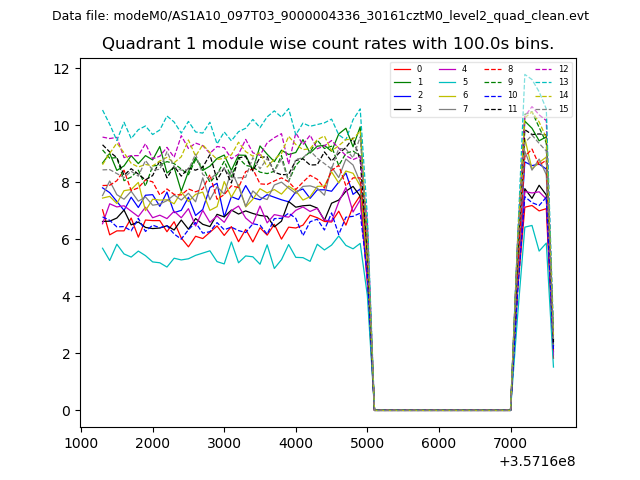 |
 |
| Module-wise count rates for Quadrant C Data is divided into 100 sec bins |
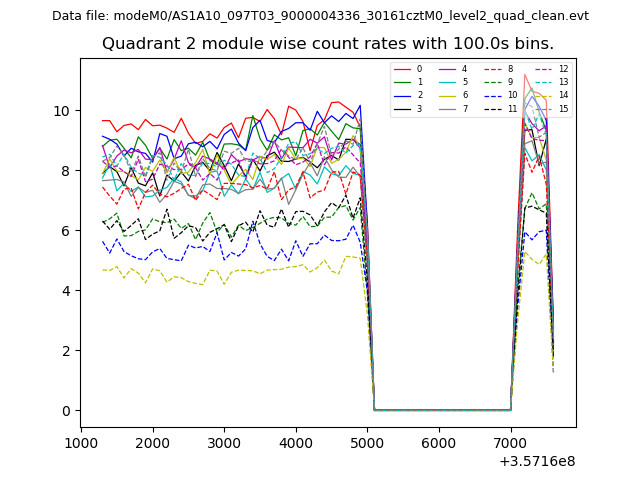 |
 |
| Module-wise count rates for Quadrant D Data is divided into 100 sec bins |
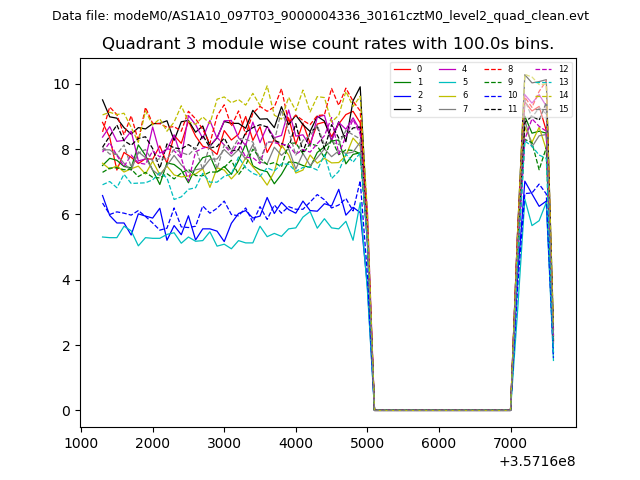 |
 |
| Parameter | Plot |
|---|---|
| CZT HV Monitor | 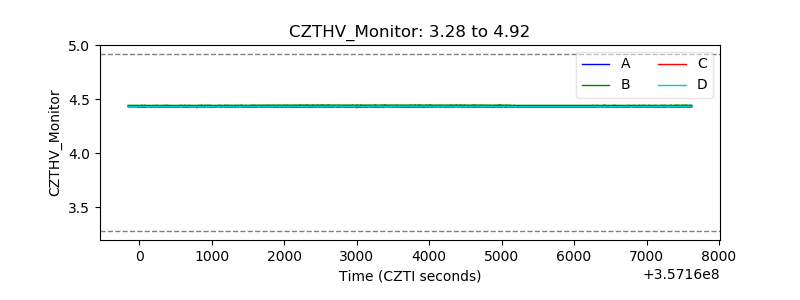 |
| D_VDD |  |
| Temperature 1 |  |
| Veto HV Monitor |  |
| Veto LLD |  |
| Alpha Counter | 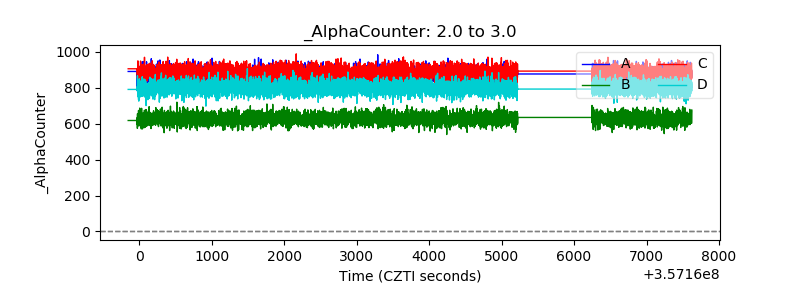 |
| _CPM_Rate | 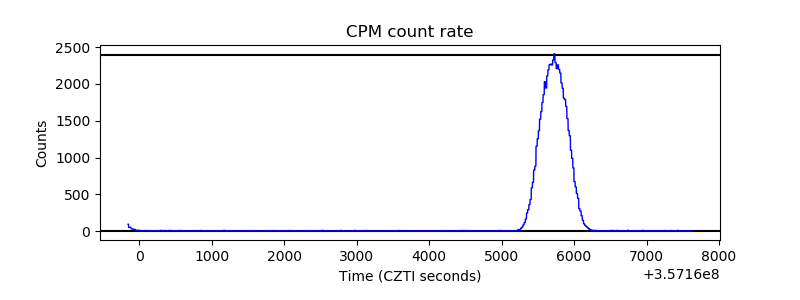 |
| CZT Counter |  |
| +2.5 Volts monitor |  |
| +5 Volts monitor |  |
| _ROLL_ROT | 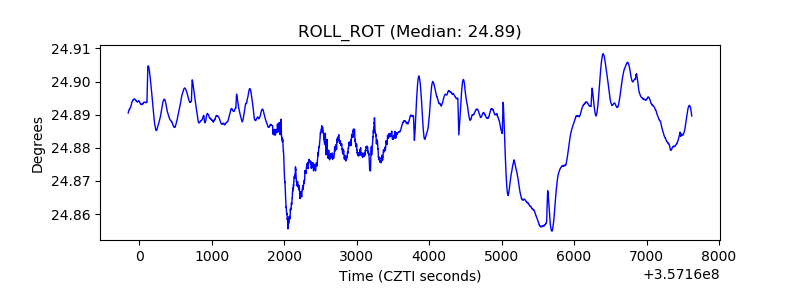 |
| _Roll_DEC | 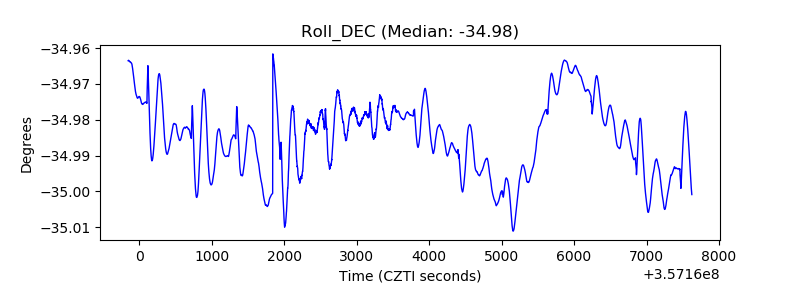 |
| _Roll_RA |  |
| Veto Counter | 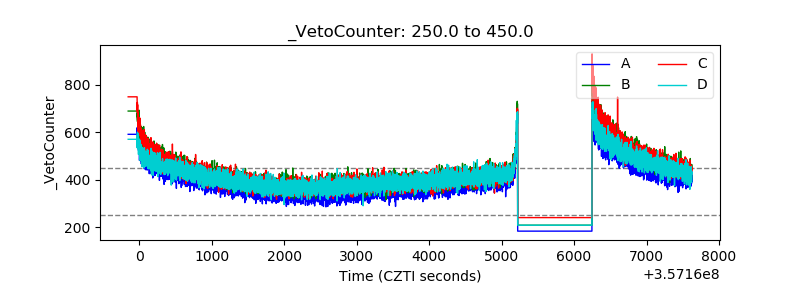 |