| Param | Original file | Final file |
|---|---|---|
| Filename | modeM0/AS1A10_097T03_9000004336_30163cztM0_level2.evt | modeM0/AS1A10_097T03_9000004336_30163cztM0_level2_quad_clean.evt |
| Size (bytes) | 543,225,600 | 97,761,600 |
| Size | 518.1 MB | 93.2 MB |
| Events in quadrant A | 3,292,244 | 640,900 |
| Events in quadrant B | 5,138,730 | 639,207 |
| Events in quadrant C | 3,861,793 | 616,447 |
| Events in quadrant D | 3,721,101 | 613,080 |
| Mode M9 | |||
|---|---|---|---|
| Quadrant | BADHDUFLAG | Total packets | Discarded packets |
| A | 0 | 18 | 0 |
| B | 0 | 19 | 0 |
| C | 0 | 19 | 0 |
| D | 0 | 19 | 0 |
| Mode SS | |||
|---|---|---|---|
| Quadrant | BADHDUFLAG | Total packets | Discarded packets |
| A | 0 | 134 | 0 |
| B | 0 | 134 | 0 |
| C | 0 | 134 | 0 |
| D | 0 | 134 | 0 |
| Mode M0 | |||
|---|---|---|---|
| Quadrant | BADHDUFLAG | Total packets | Discarded packets |
| A | 0 | 13884 | 2 |
| B | 0 | 19779 | 2 |
| C | 0 | 15766 | 2 |
| D | 0 | 15204 | 2 |
| Quadrant | Total seconds | Saturated seconds | Saturation percentage |
|---|---|---|---|
| A | 6458 | 61 | 0.944565% |
| B | 6458 | 101 | 1.563952% |
| C | 6458 | 90 | 1.393620% |
| D | 6458 | 70 | 1.083927% |
Noise dominated data is calculated using 1-second bins in cleaned event files. If a bin has >2000 counts, and if more than 50% of those come from <1% of pixels, then it is considered to be noise-dominated and hence unusable.
| Quadrant | # 1 sec bins | Bins with >0 counts | Bins with >2000 counts | High rate bins dominated by noise | Noise dominated (total time) | Noise dominated (detector-on time) | Marked lightcurve |
|---|---|---|---|---|---|---|---|
| A | 7618 | 6459 | 13 | 13 | 0.17% | 0.20% | 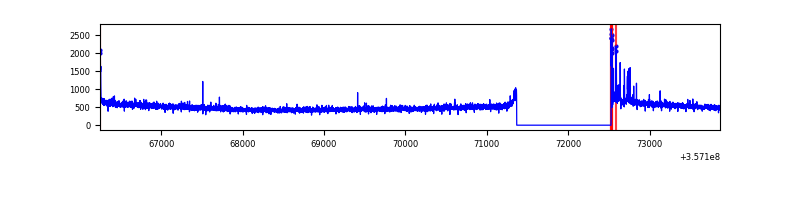 |
| B | 7618 | 6459 | 2 | 2 | 0.03% | 0.03% | 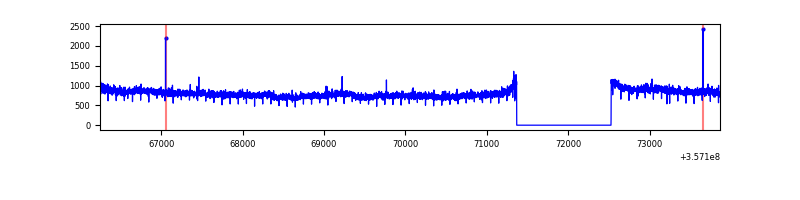 |
| C | 7618 | 6459 | 0 | 0 | 0.00% | 0.00% | 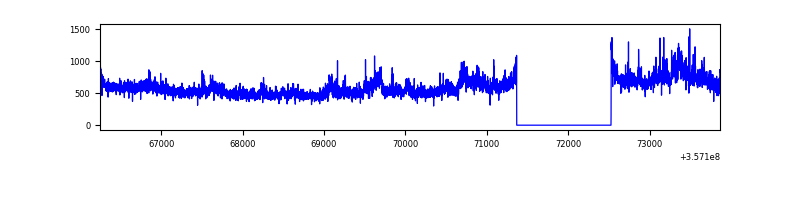 |
| D | 7618 | 6459 | 51 | 51 | 0.67% | 0.79% | 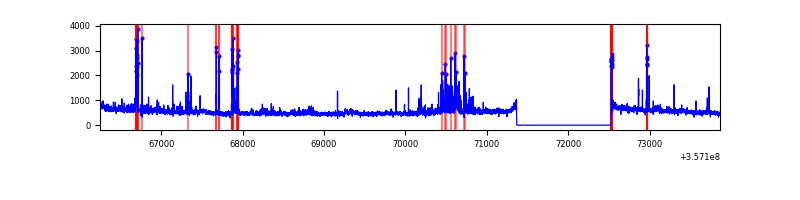 |
Top three noisy pixels from each quadrant. If the there are fewer than three noisy pixels in the level2.evt file, extra rows are filled as -1
| Pixel properties | Quadrant properties | ||||||
|---|---|---|---|---|---|---|---|
| Quadrant | DetID | PixID | Counts | Sigma | Mean | Median | Sigma |
| A | 0 | 13 | 65305 | 388.11 | 831 | 814 | 166.2 |
| A | 8 | 192 | 19249 | 110.94 | 831 | 814 | 166.2 |
| A | 13 | 254 | 12156 | 68.25 | 831 | 814 | 166.2 |
| B | 6 | 159 | 1855232 | 11853.86 | 826 | 805 | 156.4 |
| B | 0 | 190 | 26921 | 166.94 | 826 | 805 | 156.4 |
| B | 12 | 111 | 18762 | 114.78 | 826 | 805 | 156.4 |
| C | 3 | 233 | 578822 | 3078.58 | 805 | 812 | 187.8 |
| C | 14 | 238 | 130141 | 688.83 | 805 | 812 | 187.8 |
| C | 2 | 114 | 14931 | 75.2 | 805 | 812 | 187.8 |
| D | 12 | 233 | 188807 | 922.54 | 805 | 789 | 203.8 |
| D | 8 | 195 | 153224 | 747.95 | 805 | 789 | 203.8 |
| D | 12 | 227 | 90098 | 438.21 | 805 | 789 | 203.8 |
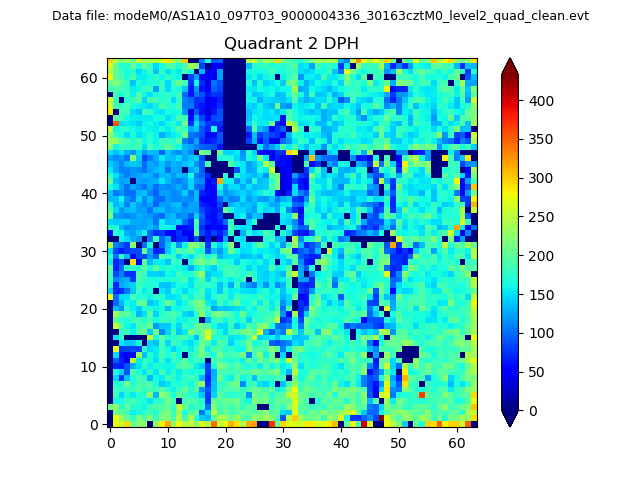
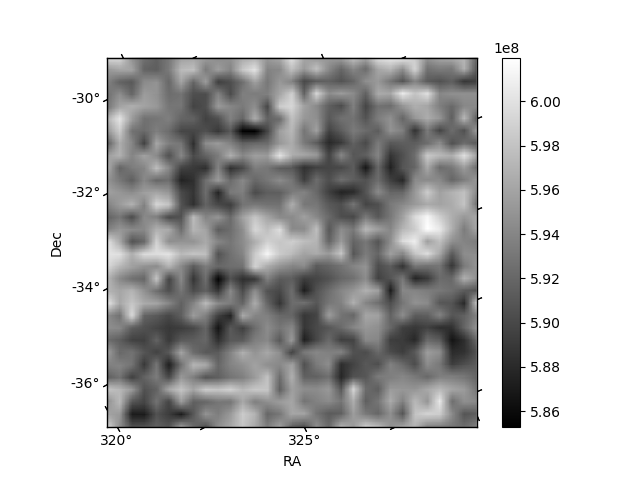
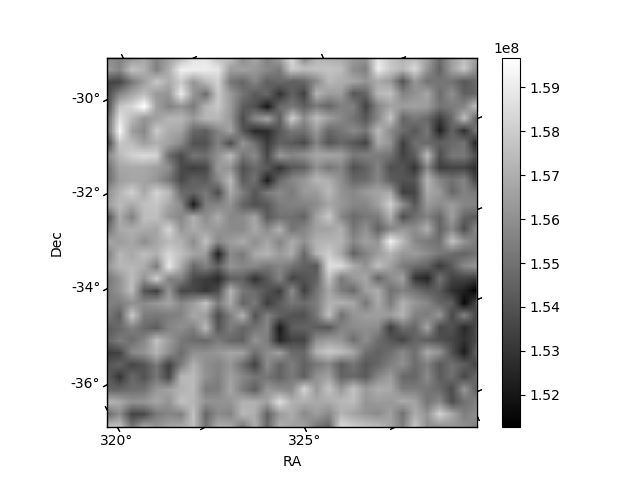
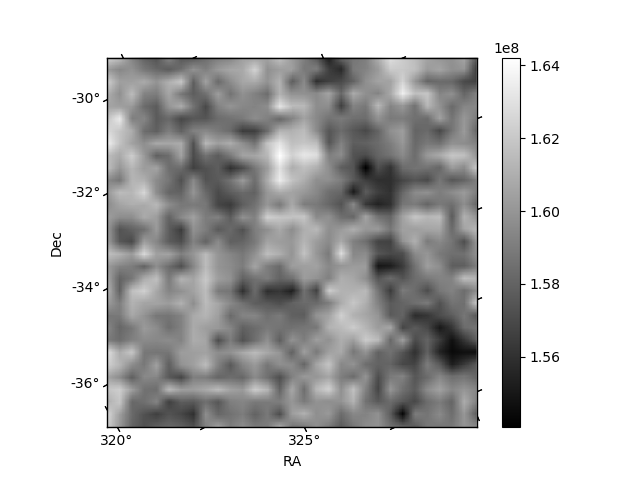
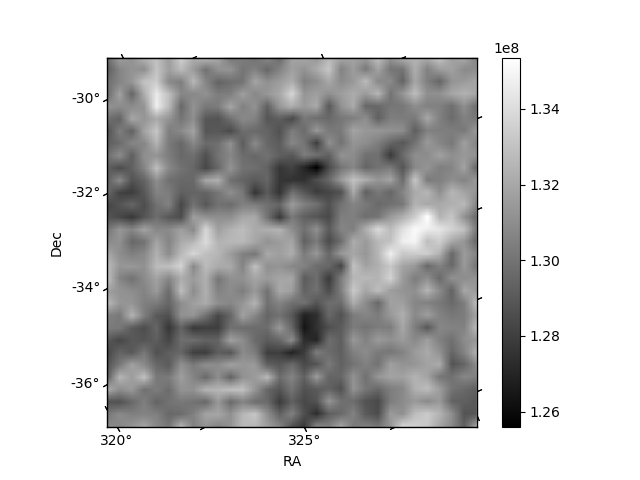
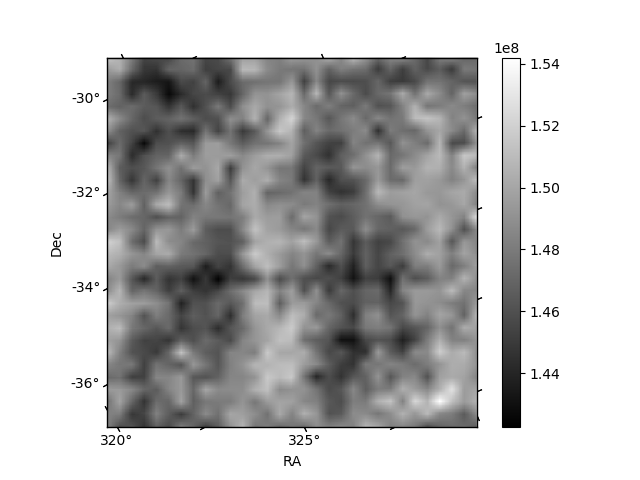
Histogram calculated using DETX and DETY for each event in the final _common_clean file
| Quadrant A | 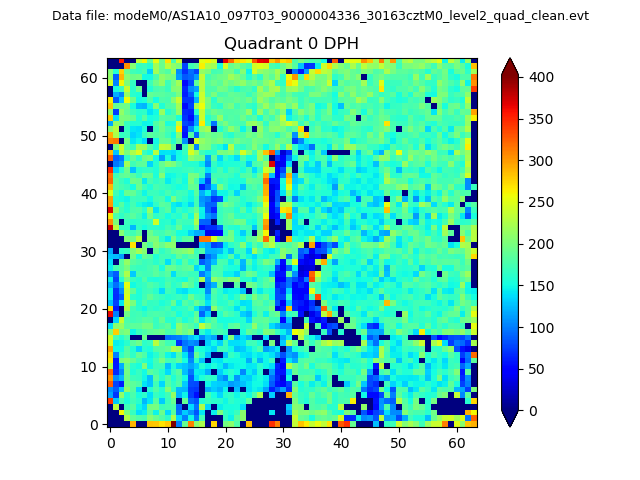 |
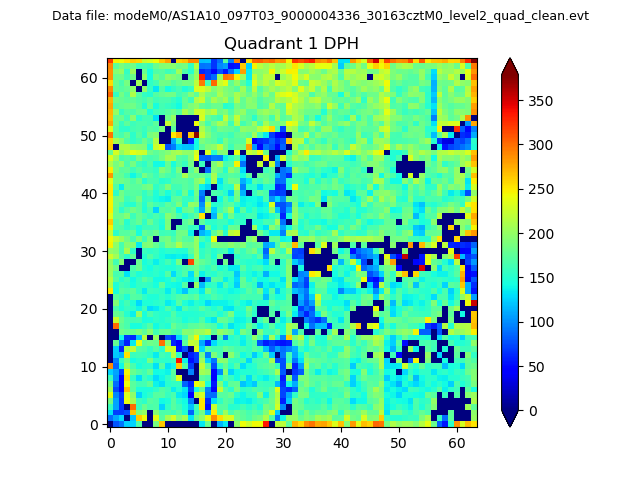 |
Quadrant B |
|---|---|---|---|
| Quadrant D | 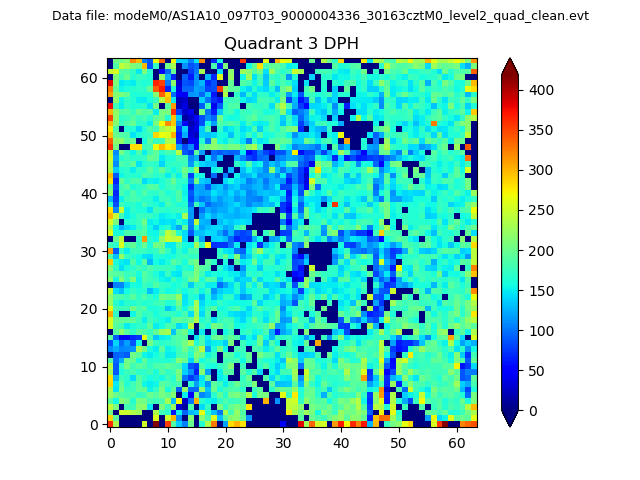 |
 |
Quadrant C |
| Plot type | Count rate plots | Images |
|---|---|---|
| Comparison with Poisson distribution Blue bars denote a histogram of data divided into 1 sec bins. Red curve is a Poisson curve with rate = median count rate of data. |
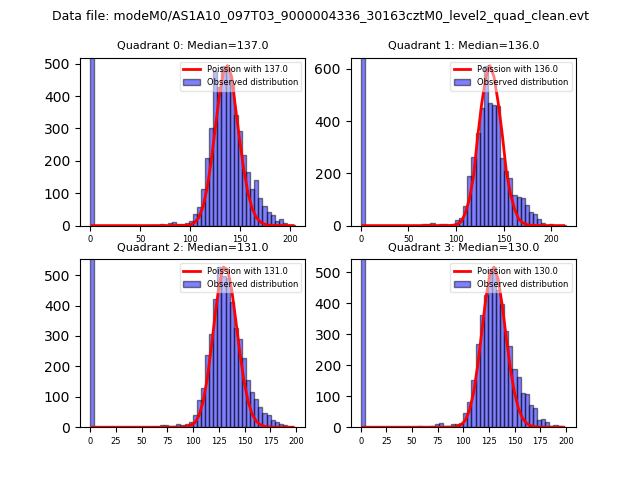 |
 |
| Quadrant-wise count rates Data is divided into 100 sec bins |
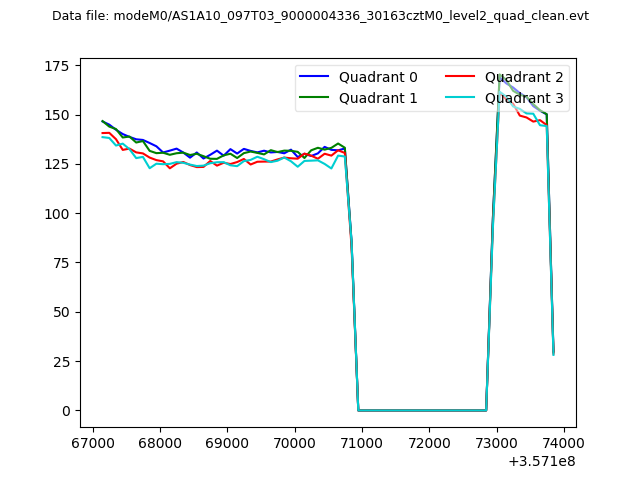 |
|
| Module-wise count rates for Quadrant A Data is divided into 100 sec bins |
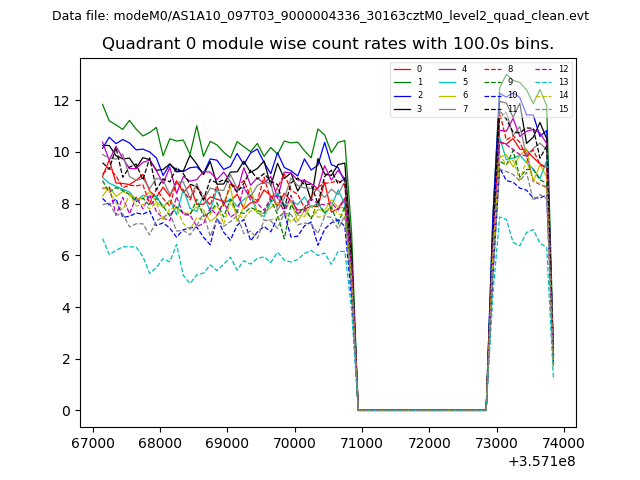 |
 |
| Module-wise count rates for Quadrant B Data is divided into 100 sec bins |
 |
 |
| Module-wise count rates for Quadrant C Data is divided into 100 sec bins |
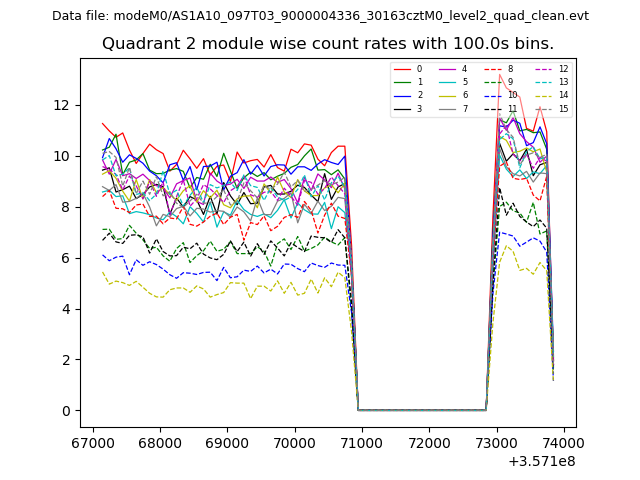 |
 |
| Module-wise count rates for Quadrant D Data is divided into 100 sec bins |
 |
 |
| Parameter | Plot |
|---|---|
| CZT HV Monitor | 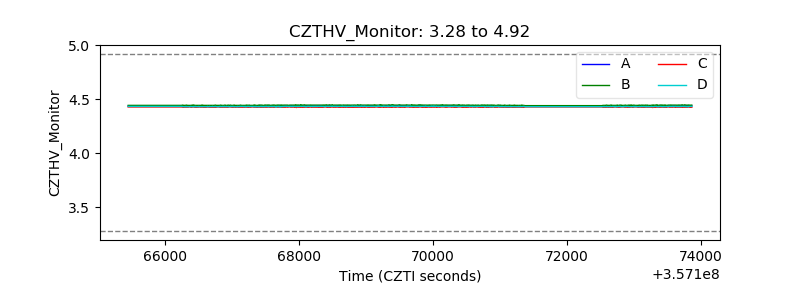 |
| D_VDD | 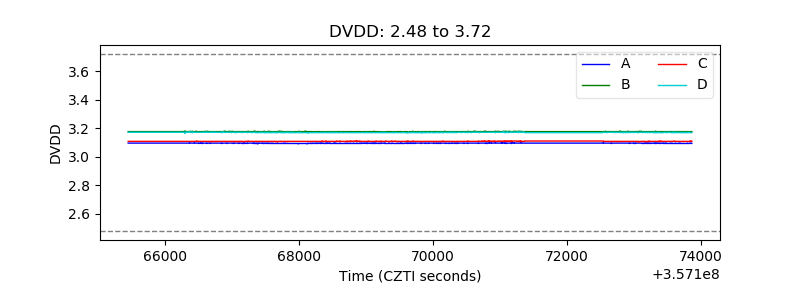 |
| Temperature 1 |  |
| Veto HV Monitor | 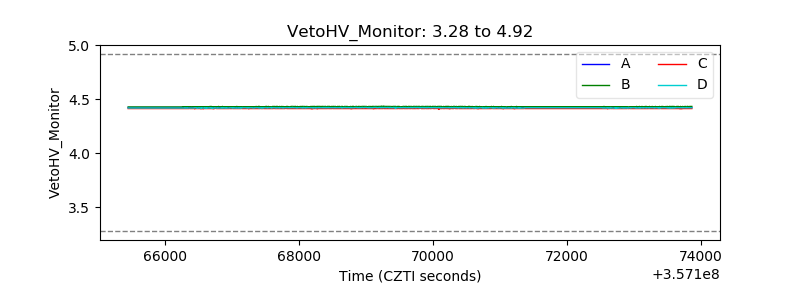 |
| Veto LLD |  |
| Alpha Counter | 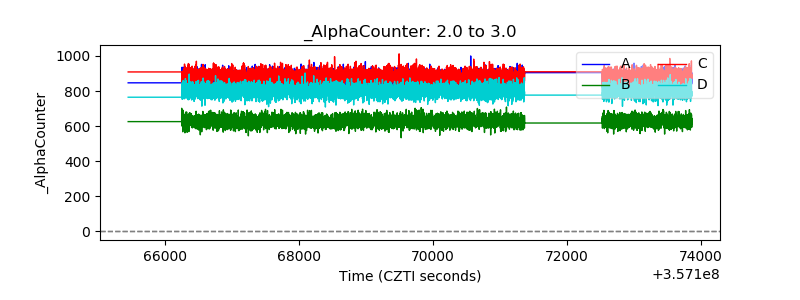 |
| _CPM_Rate | 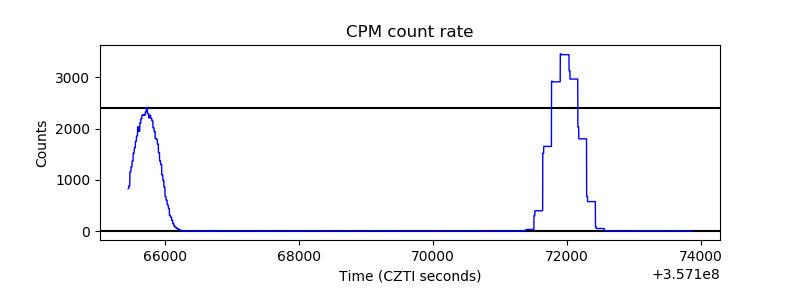 |
| CZT Counter | 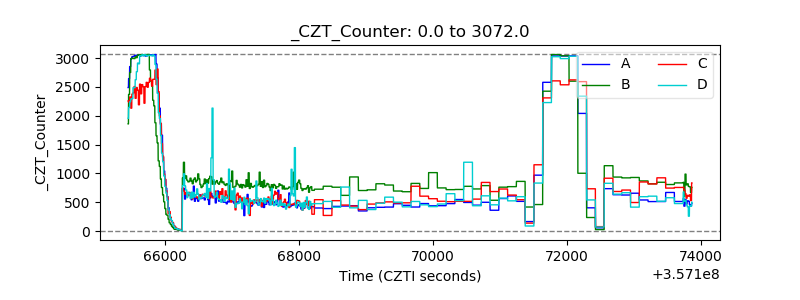 |
| +2.5 Volts monitor |  |
| +5 Volts monitor | 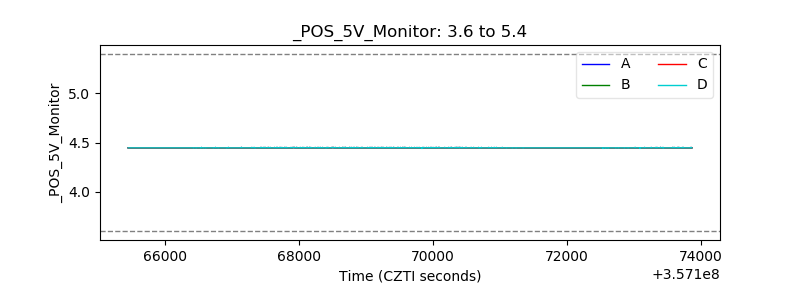 |
| _ROLL_ROT | 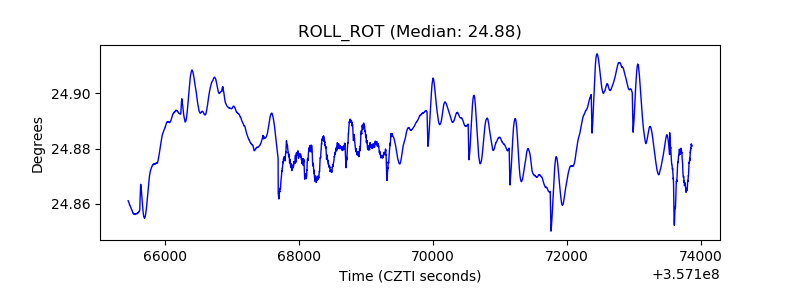 |
| _Roll_DEC | 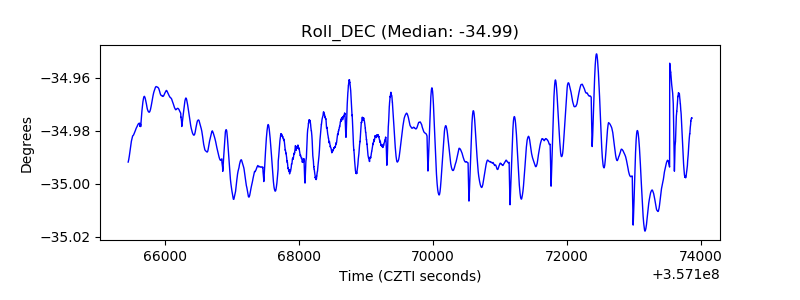 |
| _Roll_RA | 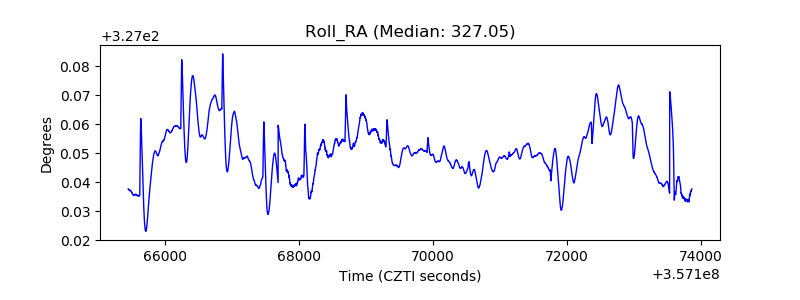 |
| Veto Counter | 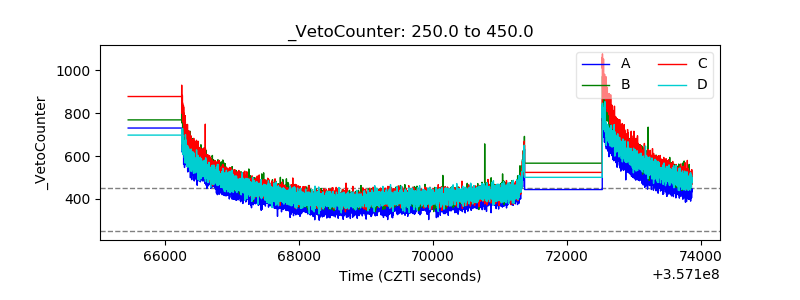 |