| Param | Original file | Final file |
|---|---|---|
| Filename | modeM0/AS1A10_097T03_9000004336_30167cztM0_level2.evt | modeM0/AS1A10_097T03_9000004336_30167cztM0_level2_quad_clean.evt |
| Size (bytes) | 645,071,040 | 101,825,280 |
| Size | 615.2 MB | 97.1 MB |
| Events in quadrant A | 3,244,092 | 669,396 |
| Events in quadrant B | 5,114,961 | 676,513 |
| Events in quadrant C | 6,762,864 | 638,868 |
| Events in quadrant D | 3,985,291 | 655,748 |
| Mode M9 | |||
|---|---|---|---|
| Quadrant | BADHDUFLAG | Total packets | Discarded packets |
| A | 0 | 15 | 0 |
| B | 0 | 16 | 0 |
| C | 0 | 16 | 0 |
| D | 0 | 16 | 0 |
| Mode SS | |||
|---|---|---|---|
| Quadrant | BADHDUFLAG | Total packets | Discarded packets |
| A | 0 | 128 | 0 |
| B | 0 | 128 | 0 |
| C | 0 | 128 | 0 |
| D | 0 | 128 | 0 |
| Mode M0 | |||
|---|---|---|---|
| Quadrant | BADHDUFLAG | Total packets | Discarded packets |
| A | 0 | 13422 | 2 |
| B | 0 | 19533 | 2 |
| C | 0 | 24719 | 2 |
| D | 0 | 15957 | 2 |
| Quadrant | Total seconds | Saturated seconds | Saturation percentage |
|---|---|---|---|
| A | 6354 | 54 | 0.849858% |
| B | 6354 | 120 | 1.888574% |
| C | 6354 | 842 | 13.251495% |
| D | 6354 | 119 | 1.872836% |
Noise dominated data is calculated using 1-second bins in cleaned event files. If a bin has >2000 counts, and if more than 50% of those come from <1% of pixels, then it is considered to be noise-dominated and hence unusable.
| Quadrant | # 1 sec bins | Bins with >0 counts | Bins with >2000 counts | High rate bins dominated by noise | Noise dominated (total time) | Noise dominated (detector-on time) | Marked lightcurve |
|---|---|---|---|---|---|---|---|
| A | 7589 | 6355 | 1 | 1 | 0.01% | 0.02% | 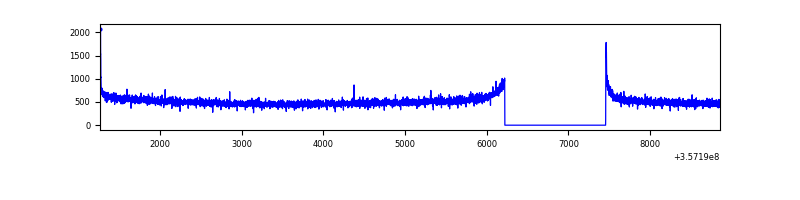 |
| B | 7589 | 6355 | 0 | 0 | 0.00% | 0.00% | 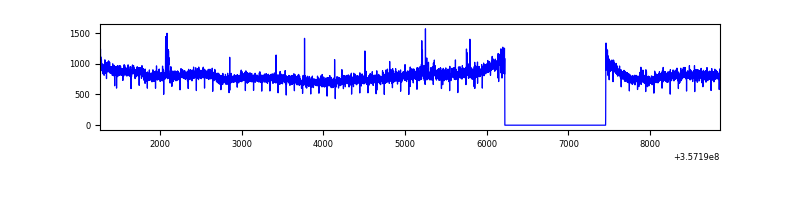 |
| C | 7589 | 6355 | 260 | 260 | 3.43% | 4.09% | 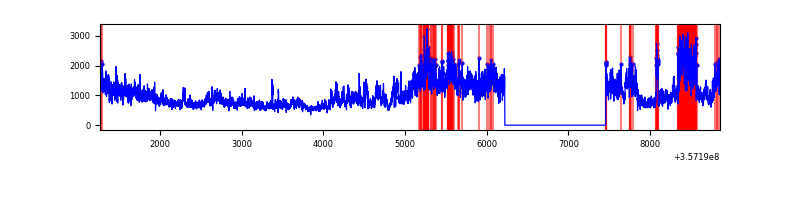 |
| D | 7589 | 6355 | 90 | 90 | 1.19% | 1.42% | 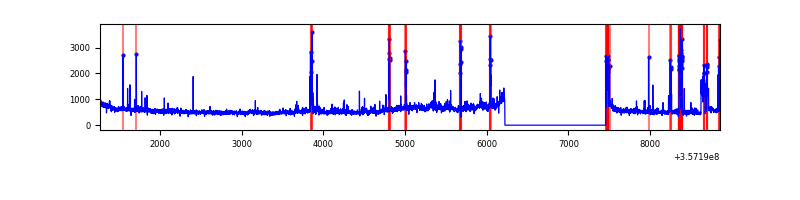 |
Top three noisy pixels from each quadrant. If the there are fewer than three noisy pixels in the level2.evt file, extra rows are filled as -1
| Pixel properties | Quadrant properties | ||||||
|---|---|---|---|---|---|---|---|
| Quadrant | DetID | PixID | Counts | Sigma | Mean | Median | Sigma |
| A | 8 | 192 | 22432 | 129.68 | 835 | 819 | 166.7 |
| A | 13 | 254 | 12203 | 68.31 | 835 | 819 | 166.7 |
| A | 3 | 137 | 7541 | 40.33 | 835 | 819 | 166.7 |
| B | 6 | 159 | 1822391 | 11609.8 | 827 | 806 | 156.9 |
| B | 0 | 190 | 27027 | 167.12 | 827 | 806 | 156.9 |
| B | 0 | 230 | 22878 | 140.68 | 827 | 806 | 156.9 |
| C | 3 | 233 | 3508142 | 18838.99 | 799 | 807 | 186.2 |
| C | 14 | 238 | 127112 | 678.42 | 799 | 807 | 186.2 |
| C | 2 | 114 | 14372 | 72.86 | 799 | 807 | 186.2 |
| D | 11 | 176 | 267376 | 1354.34 | 825 | 809 | 196.8 |
| D | 8 | 195 | 256170 | 1297.41 | 825 | 809 | 196.8 |
| D | 10 | 199 | 107546 | 542.29 | 825 | 809 | 196.8 |
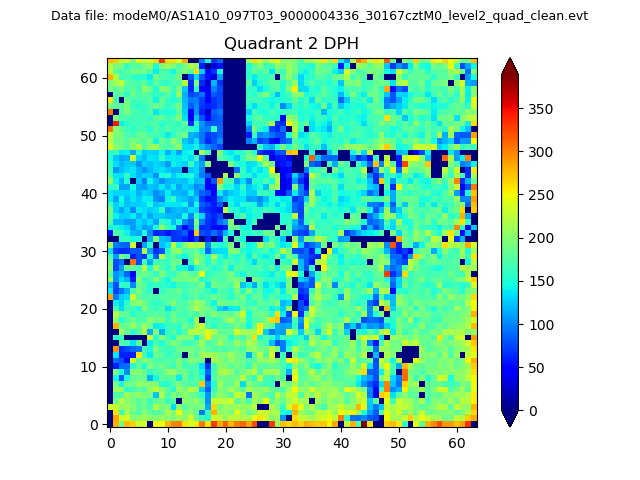
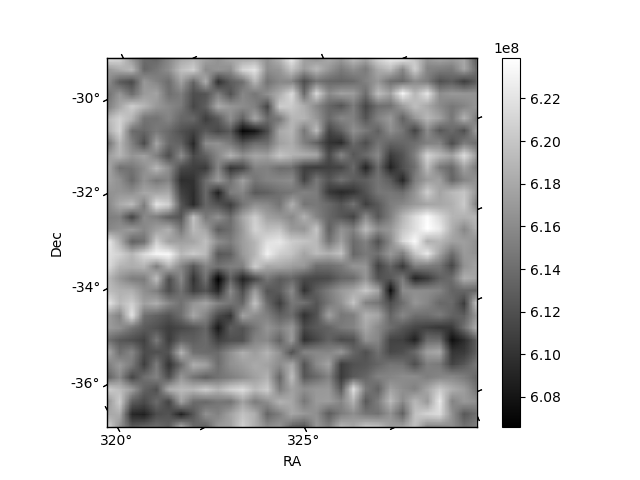
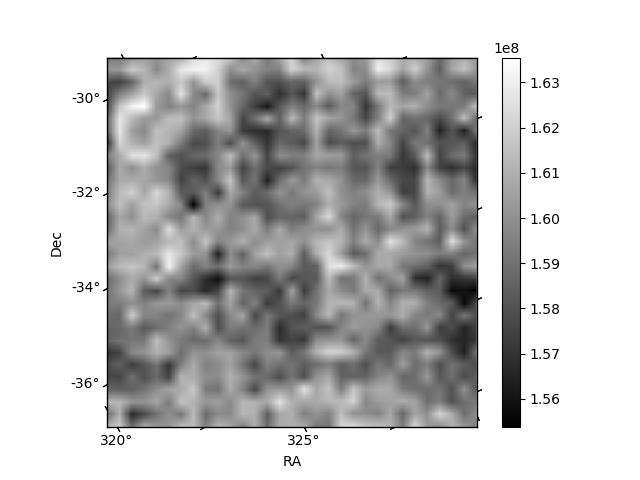
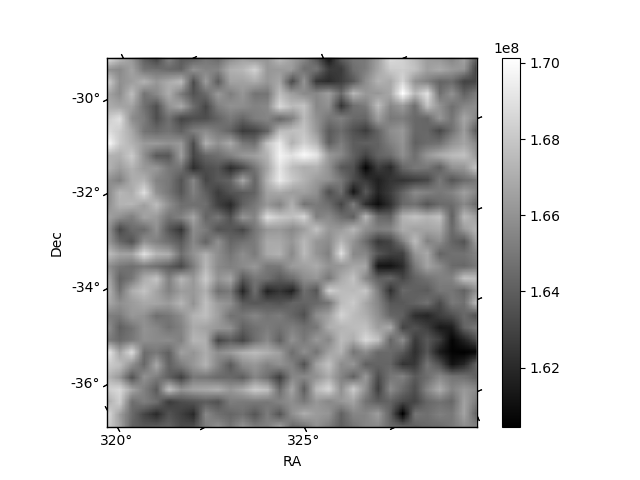
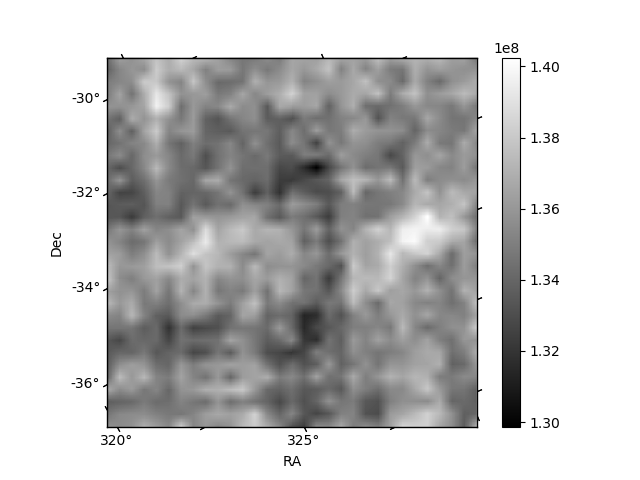
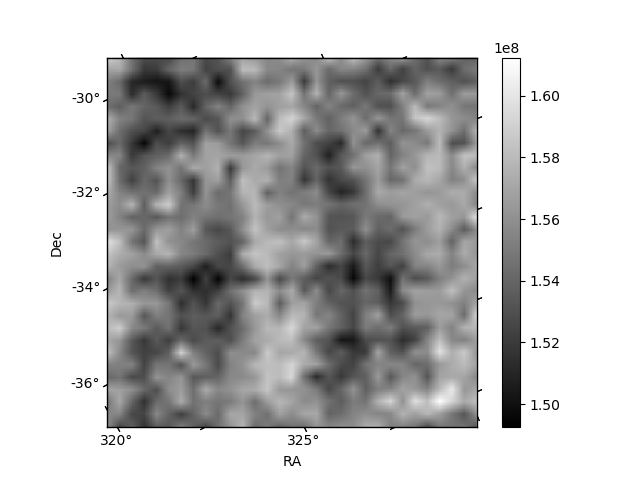
Histogram calculated using DETX and DETY for each event in the final _common_clean file
| Quadrant A | 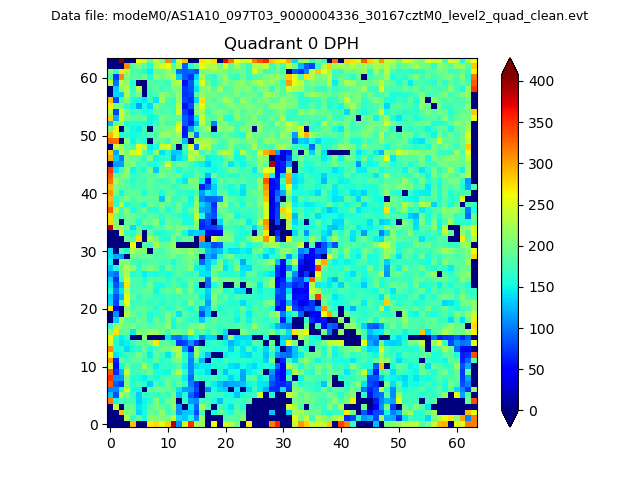 |
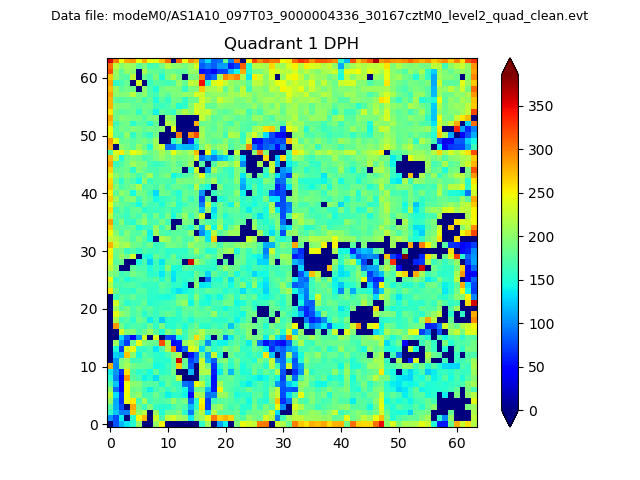 |
Quadrant B |
|---|---|---|---|
| Quadrant D | 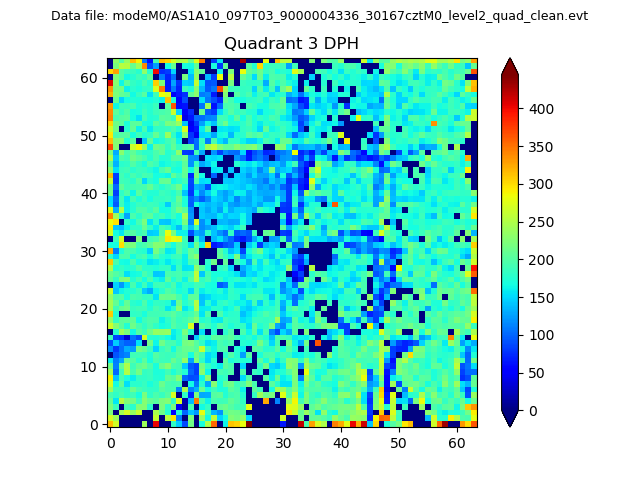 |
 |
Quadrant C |
| Plot type | Count rate plots | Images |
|---|---|---|
| Comparison with Poisson distribution Blue bars denote a histogram of data divided into 1 sec bins. Red curve is a Poisson curve with rate = median count rate of data. |
 |
 |
| Quadrant-wise count rates Data is divided into 100 sec bins |
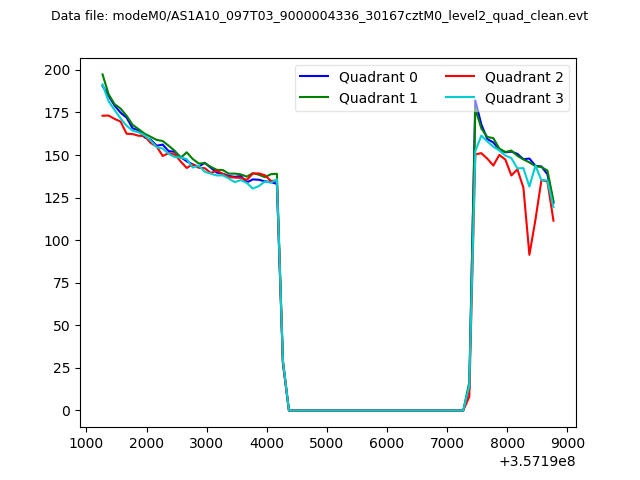 |
|
| Module-wise count rates for Quadrant A Data is divided into 100 sec bins |
 |
 |
| Module-wise count rates for Quadrant B Data is divided into 100 sec bins |
 |
 |
| Module-wise count rates for Quadrant C Data is divided into 100 sec bins |
 |
 |
| Module-wise count rates for Quadrant D Data is divided into 100 sec bins |
 |
 |
| Parameter | Plot |
|---|---|
| CZT HV Monitor |  |
| D_VDD | 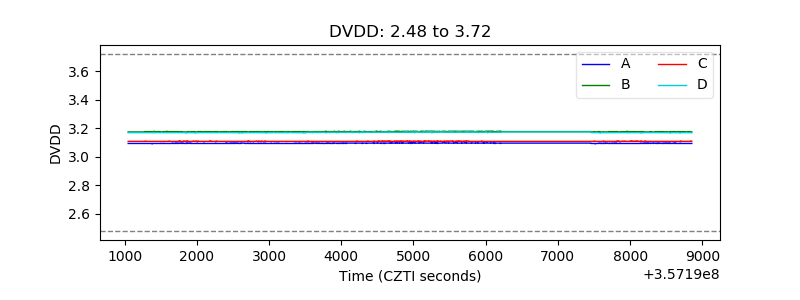 |
| Temperature 1 | 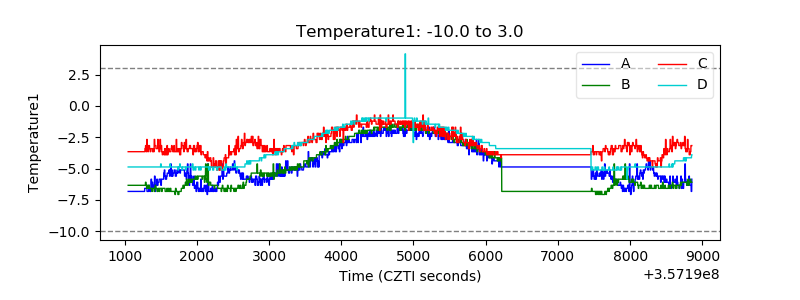 |
| Veto HV Monitor | 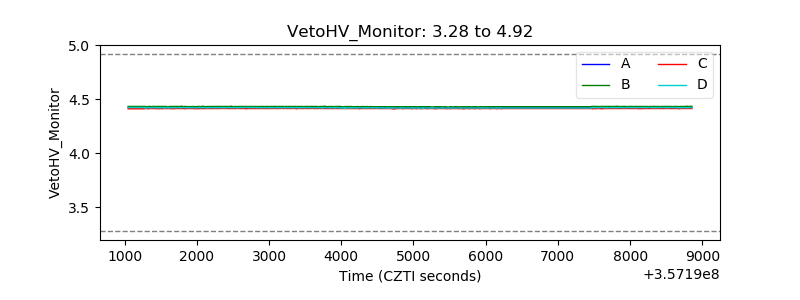 |
| Veto LLD | 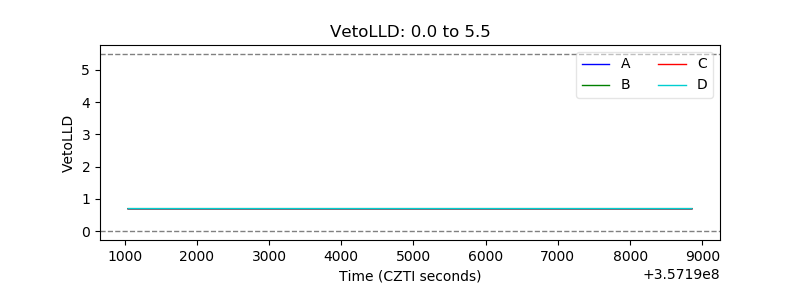 |
| Alpha Counter | 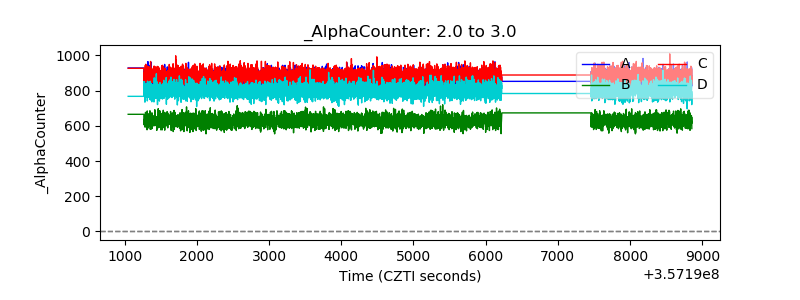 |
| _CPM_Rate | 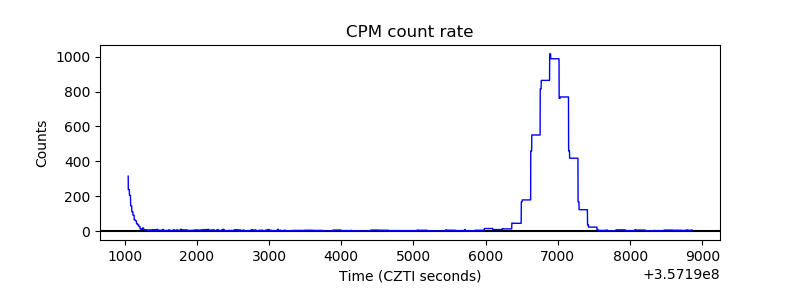 |
| CZT Counter | 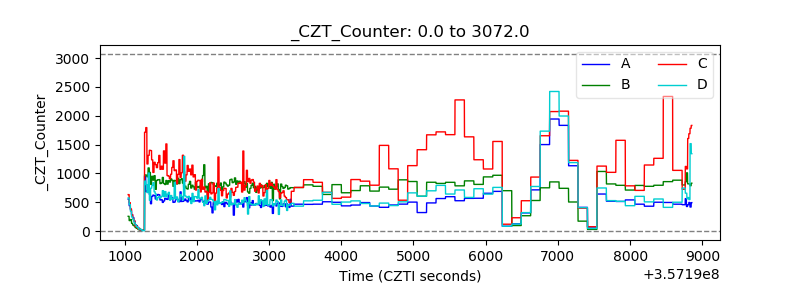 |
| +2.5 Volts monitor |  |
| +5 Volts monitor |  |
| _ROLL_ROT | 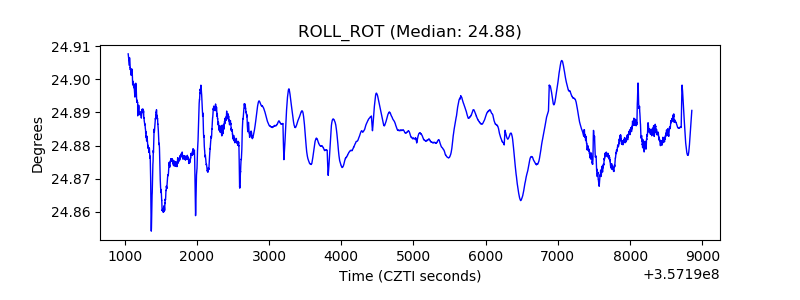 |
| _Roll_DEC | 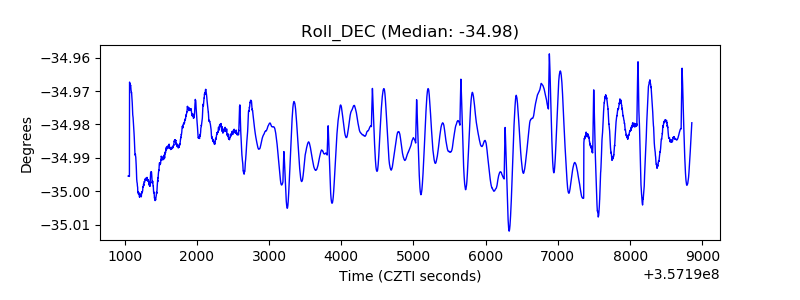 |
| _Roll_RA | 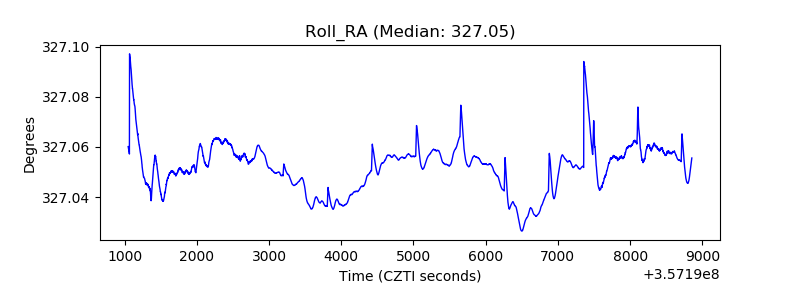 |
| Veto Counter |  |