| Param | Original file | Final file |
|---|---|---|
| Filename | modeM0/AS1A10_097T03_9000004336_30169cztM0_level2.evt | modeM0/AS1A10_097T03_9000004336_30169cztM0_level2_quad_clean.evt |
| Size (bytes) | 652,034,880 | 104,163,840 |
| Size | 621.8 MB | 99.3 MB |
| Events in quadrant A | 3,439,998 | 674,042 |
| Events in quadrant B | 5,504,704 | 676,745 |
| Events in quadrant C | 6,269,159 | 644,331 |
| Events in quadrant D | 4,046,405 | 657,942 |
| Mode M9 | |||
|---|---|---|---|
| Quadrant | BADHDUFLAG | Total packets | Discarded packets |
| A | 0 | 5 | 0 |
| B | 0 | 5 | 0 |
| C | 0 | 5 | 0 |
| D | 0 | 5 | 0 |
| Mode SS | |||
|---|---|---|---|
| Quadrant | BADHDUFLAG | Total packets | Discarded packets |
| A | 0 | 144 | 0 |
| B | 0 | 144 | 0 |
| C | 0 | 144 | 0 |
| D | 0 | 144 | 0 |
| Mode M0 | |||
|---|---|---|---|
| Quadrant | BADHDUFLAG | Total packets | Discarded packets |
| A | 0 | 14862 | 1 |
| B | 0 | 21714 | 1 |
| C | 0 | 23691 | 1 |
| D | 0 | 16447 | 1 |
| Quadrant | Total seconds | Saturated seconds | Saturation percentage |
|---|---|---|---|
| A | 7205 | 186 | 2.581541% |
| B | 7206 | 226 | 3.136275% |
| C | 7206 | 445 | 6.175409% |
| D | 7206 | 191 | 2.650569% |
Noise dominated data is calculated using 1-second bins in cleaned event files. If a bin has >2000 counts, and if more than 50% of those come from <1% of pixels, then it is considered to be noise-dominated and hence unusable.
| Quadrant | # 1 sec bins | Bins with >0 counts | Bins with >2000 counts | High rate bins dominated by noise | Noise dominated (total time) | Noise dominated (detector-on time) | Marked lightcurve |
|---|---|---|---|---|---|---|---|
| A | 7645 | 7205 | 0 | 0 | 0.00% | 0.00% | 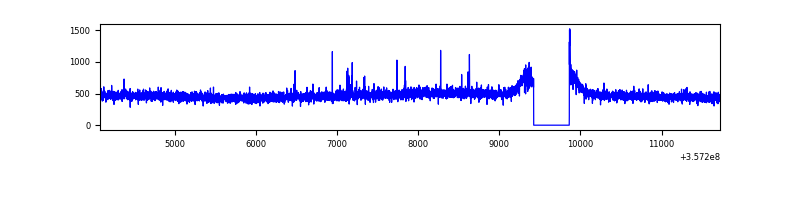 |
| B | 7646 | 7207 | 0 | 0 | 0.00% | 0.00% | 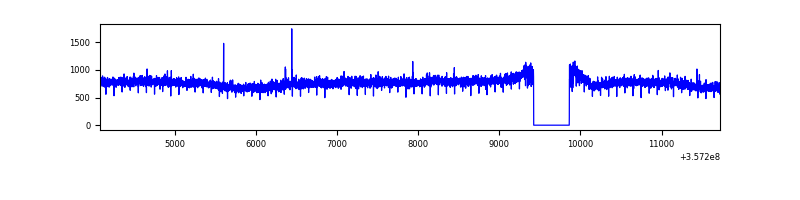 |
| C | 7646 | 7206 | 38 | 38 | 0.50% | 0.53% | 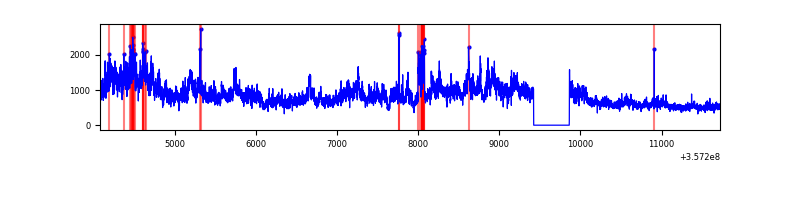 |
| D | 7646 | 7207 | 36 | 36 | 0.47% | 0.50% | 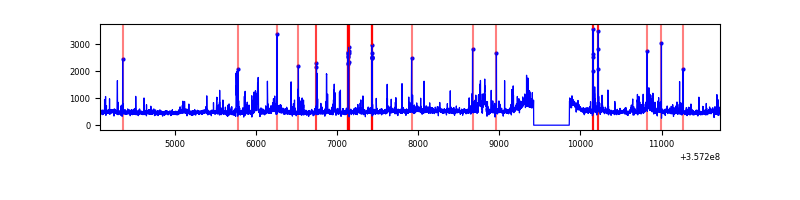 |
Top three noisy pixels from each quadrant. If the there are fewer than three noisy pixels in the level2.evt file, extra rows are filled as -1
| Pixel properties | Quadrant properties | ||||||
|---|---|---|---|---|---|---|---|
| Quadrant | DetID | PixID | Counts | Sigma | Mean | Median | Sigma |
| A | 0 | 13 | 16927 | 90.3 | 884 | 864 | 177.9 |
| A | 13 | 254 | 13363 | 70.27 | 884 | 864 | 177.9 |
| A | 8 | 192 | 9842 | 50.47 | 884 | 864 | 177.9 |
| B | 6 | 159 | 2063242 | 12210.48 | 869 | 844 | 168.9 |
| B | 0 | 190 | 24491 | 140.0 | 869 | 844 | 168.9 |
| B | 12 | 111 | 20769 | 117.97 | 869 | 844 | 168.9 |
| C | 3 | 233 | 2794966 | 14092.4 | 847 | 850 | 198.3 |
| C | 14 | 238 | 133625 | 669.66 | 847 | 850 | 198.3 |
| C | 15 | 208 | 22734 | 110.37 | 847 | 850 | 198.3 |
| D | 1 | 52 | 331393 | 1524.64 | 867 | 845 | 216.8 |
| D | 8 | 195 | 178681 | 820.26 | 867 | 845 | 216.8 |
| D | 11 | 176 | 138900 | 636.77 | 867 | 845 | 216.8 |
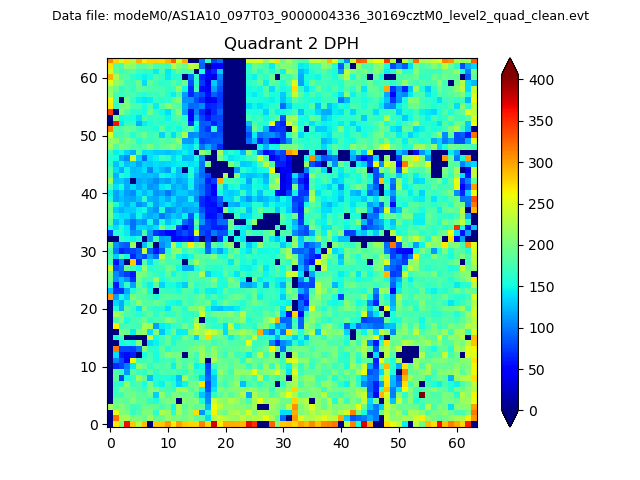
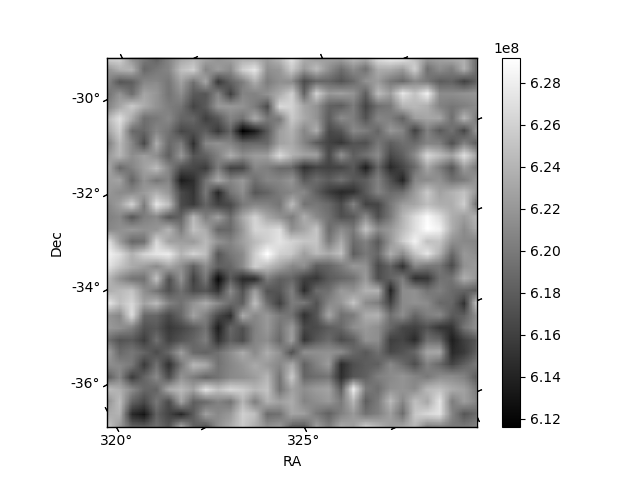
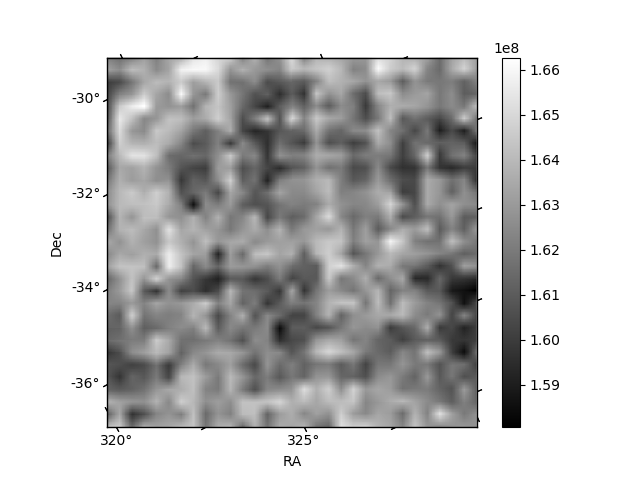
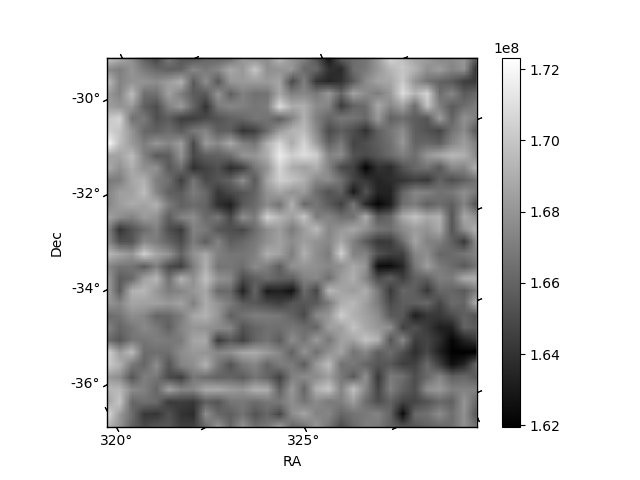
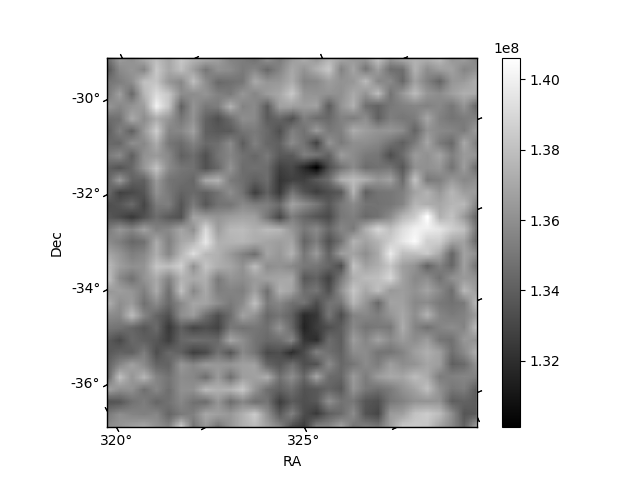
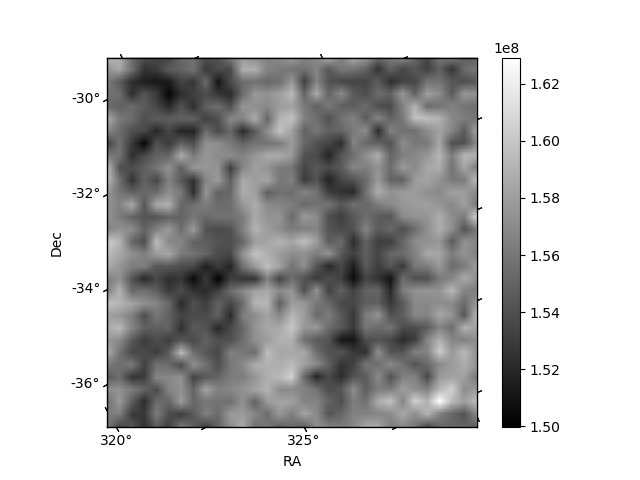
Histogram calculated using DETX and DETY for each event in the final _common_clean file
| Quadrant A | 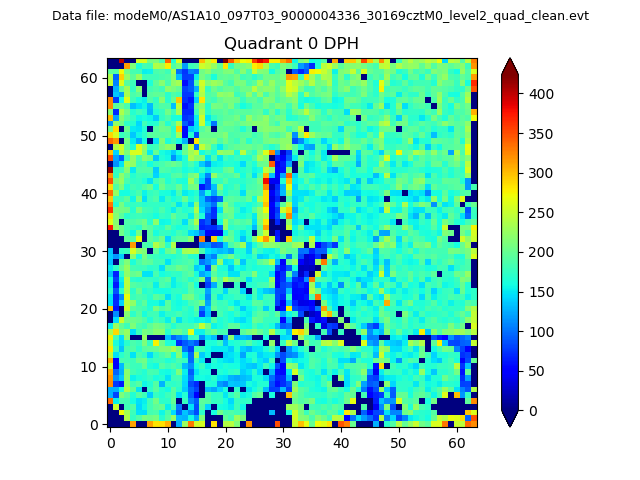 |
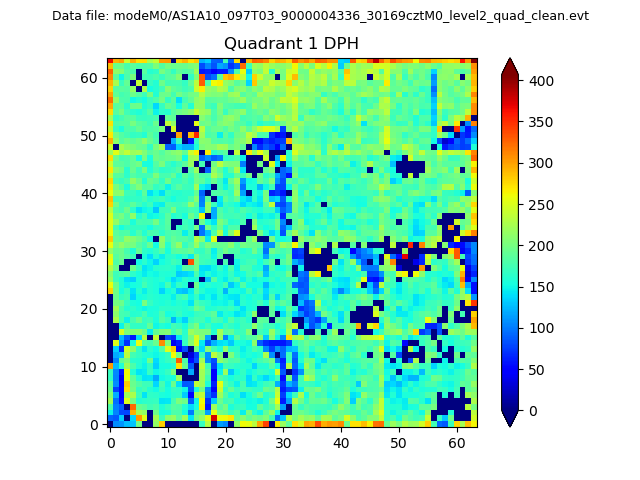 |
Quadrant B |
|---|---|---|---|
| Quadrant D | 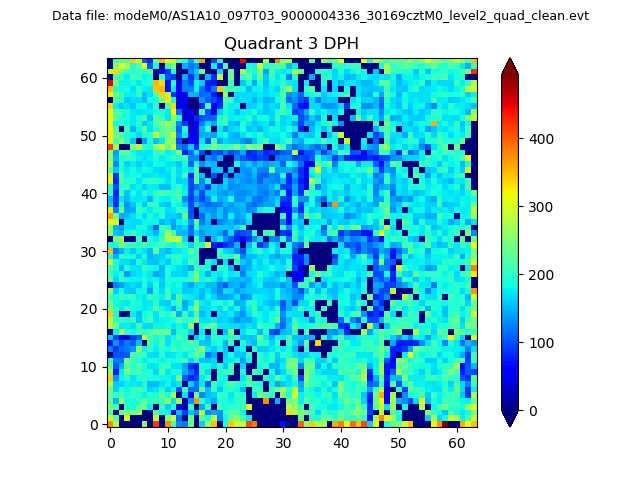 |
 |
Quadrant C |
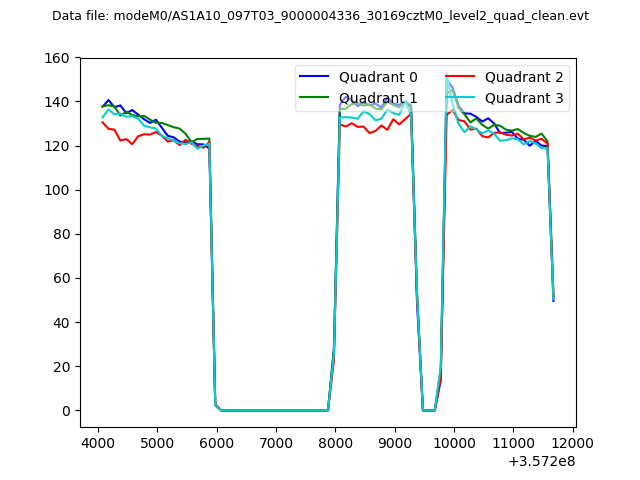
| Plot type | Count rate plots | Images |
|---|---|---|
| Comparison with Poisson distribution Blue bars denote a histogram of data divided into 1 sec bins. Red curve is a Poisson curve with rate = median count rate of data. |
 |
 |
| Quadrant-wise count rates Data is divided into 100 sec bins |
 |
|
| Module-wise count rates for Quadrant A Data is divided into 100 sec bins |
 |
 |
| Module-wise count rates for Quadrant B Data is divided into 100 sec bins |
 |
 |
| Module-wise count rates for Quadrant C Data is divided into 100 sec bins |
 |
 |
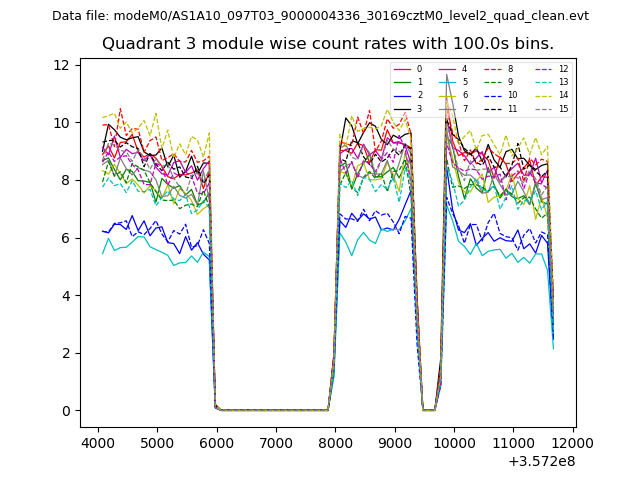
| Module-wise count rates for Quadrant D Data is divided into 100 sec bins |
 |
 |
| Parameter | Plot |
|---|---|
| CZT HV Monitor |  |
| D_VDD | 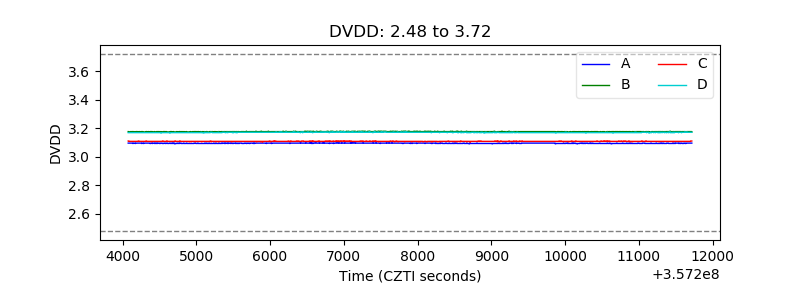 |
| Temperature 1 | 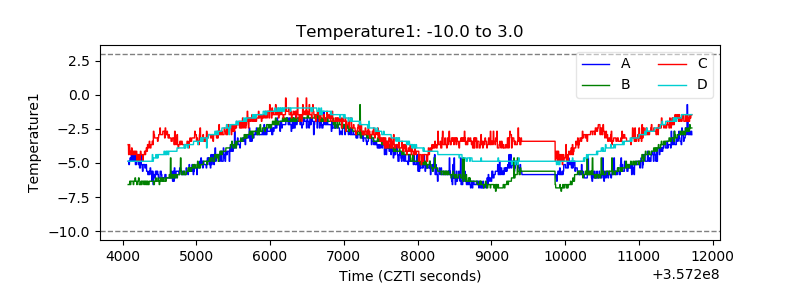 |
| Veto HV Monitor | 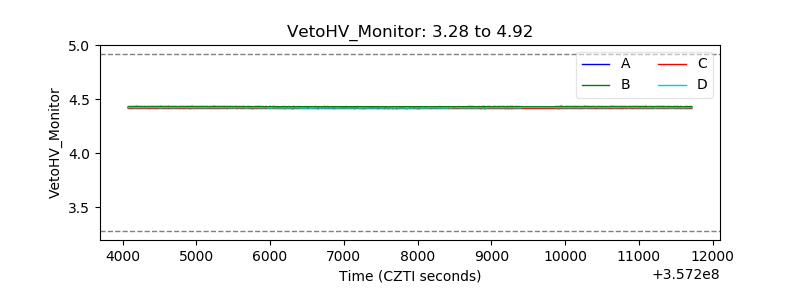 |
| Veto LLD | 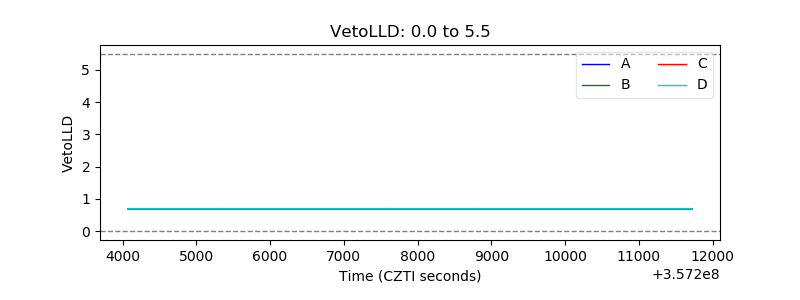 |
| Alpha Counter | 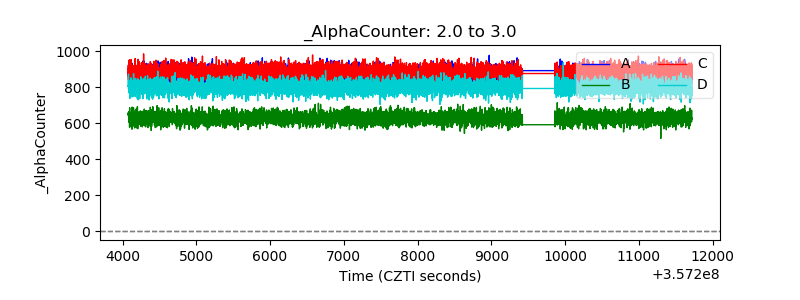 |
| _CPM_Rate | 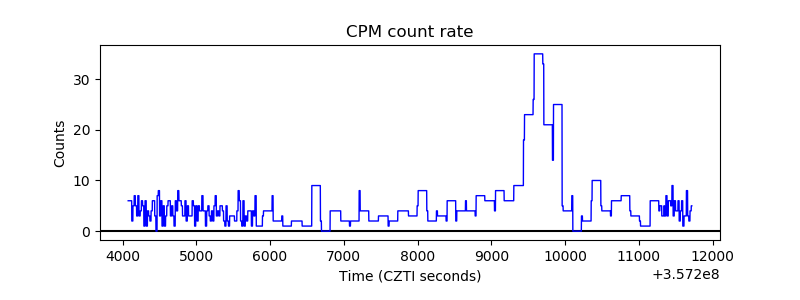 |
| CZT Counter | 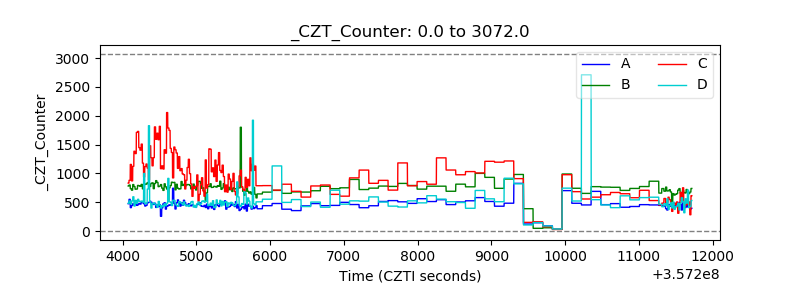 |
| +2.5 Volts monitor |  |
| +5 Volts monitor |  |
| _ROLL_ROT | 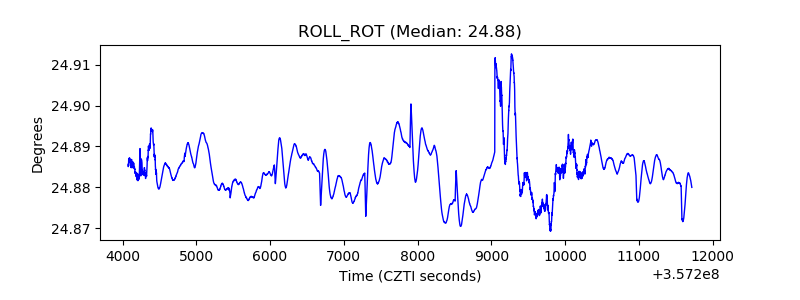 |
| _Roll_DEC | 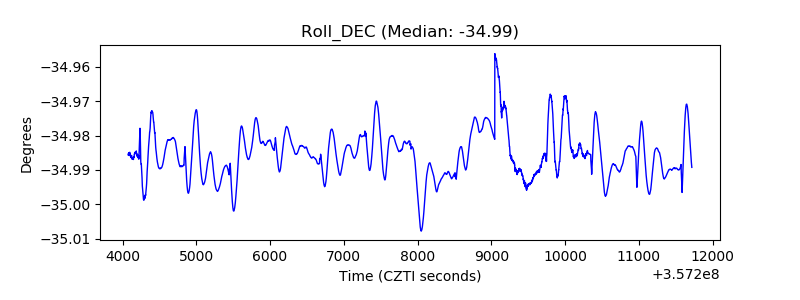 |
| _Roll_RA | 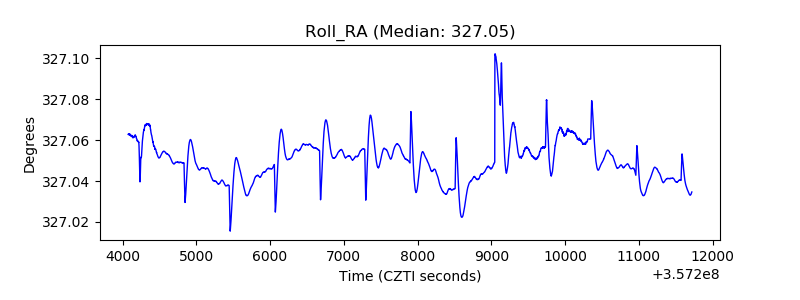 |
| Veto Counter |  |