| Param | Original file | Final file |
|---|---|---|
| Filename | modeM0/AS1A10_097T03_9000004336_30170cztM0_level2.evt | modeM0/AS1A10_097T03_9000004336_30170cztM0_level2_quad_clean.evt |
| Size (bytes) | 333,126,720 | 43,165,440 |
| Size | 317.7 MB | 41.2 MB |
| Events in quadrant A | 1,988,820 | 258,253 |
| Events in quadrant B | 3,052,110 | 259,839 |
| Events in quadrant C | 2,296,832 | 252,180 |
| Events in quadrant D | 2,471,638 | 247,068 |
| Mode SS | |||
|---|---|---|---|
| Quadrant | BADHDUFLAG | Total packets | Discarded packets |
| A | 0 | 82 | 0 |
| B | 0 | 82 | 0 |
| C | 0 | 82 | 0 |
| D | 0 | 82 | 0 |
| Mode M0 | |||
|---|---|---|---|
| Quadrant | BADHDUFLAG | Total packets | Discarded packets |
| A | 0 | 8668 | 0 |
| B | 0 | 12285 | 0 |
| C | 0 | 9348 | 0 |
| D | 0 | 9873 | 0 |
| Quadrant | Total seconds | Saturated seconds | Saturation percentage |
|---|---|---|---|
| A | 4103 | 32 | 0.779917% |
| B | 4103 | 12 | 0.292469% |
| C | 4103 | 35 | 0.853034% |
| D | 4104 | 133 | 3.240741% |
Noise dominated data is calculated using 1-second bins in cleaned event files. If a bin has >2000 counts, and if more than 50% of those come from <1% of pixels, then it is considered to be noise-dominated and hence unusable.
| Quadrant | # 1 sec bins | Bins with >0 counts | Bins with >2000 counts | High rate bins dominated by noise | Noise dominated (total time) | Noise dominated (detector-on time) | Marked lightcurve |
|---|---|---|---|---|---|---|---|
| A | 4103 | 4103 | 18 | 18 | 0.44% | 0.44% | 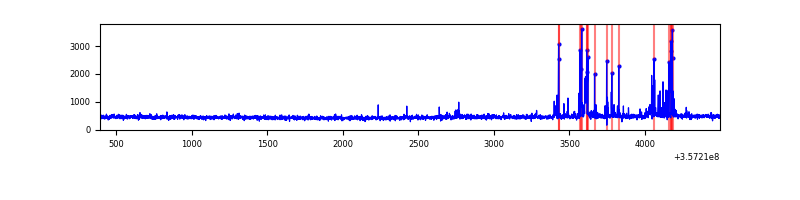 |
| B | 4103 | 4103 | 2 | 2 | 0.05% | 0.05% | 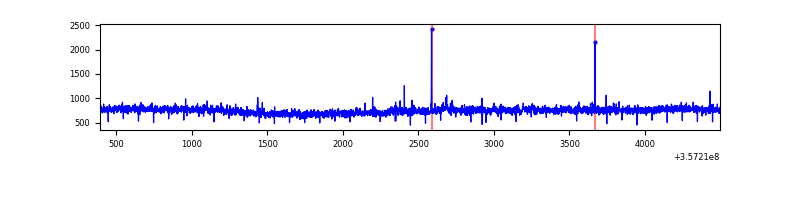 |
| C | 4103 | 4103 | 6 | 6 | 0.15% | 0.15% | 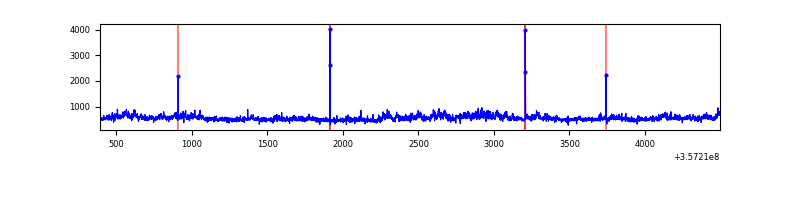 |
| D | 4104 | 4104 | 116 | 116 | 2.83% | 2.83% | 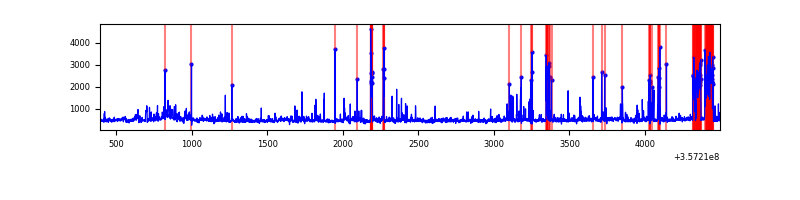 |
Top three noisy pixels from each quadrant. If the there are fewer than three noisy pixels in the level2.evt file, extra rows are filled as -1
| Pixel properties | Quadrant properties | ||||||
|---|---|---|---|---|---|---|---|
| Quadrant | DetID | PixID | Counts | Sigma | Mean | Median | Sigma |
| A | 0 | 13 | 151045 | 1545.69 | 476 | 465 | 97.4 |
| A | 13 | 254 | 7692 | 74.18 | 476 | 465 | 97.4 |
| A | 3 | 137 | 4771 | 44.2 | 476 | 465 | 97.4 |
| B | 6 | 159 | 1174537 | 12861.56 | 469 | 457 | 91.3 |
| B | 0 | 190 | 24212 | 260.23 | 469 | 457 | 91.3 |
| B | 12 | 111 | 11068 | 116.24 | 469 | 457 | 91.3 |
| C | 3 | 233 | 432681 | 3976.86 | 456 | 458 | 108.7 |
| C | 14 | 238 | 74522 | 681.46 | 456 | 458 | 108.7 |
| C | 2 | 114 | 9531 | 83.48 | 456 | 458 | 108.7 |
| D | 11 | 176 | 308478 | 2547.8 | 458 | 447 | 120.9 |
| D | 1 | 52 | 224906 | 1856.55 | 458 | 447 | 120.9 |
| D | 8 | 195 | 122661 | 1010.86 | 458 | 447 | 120.9 |
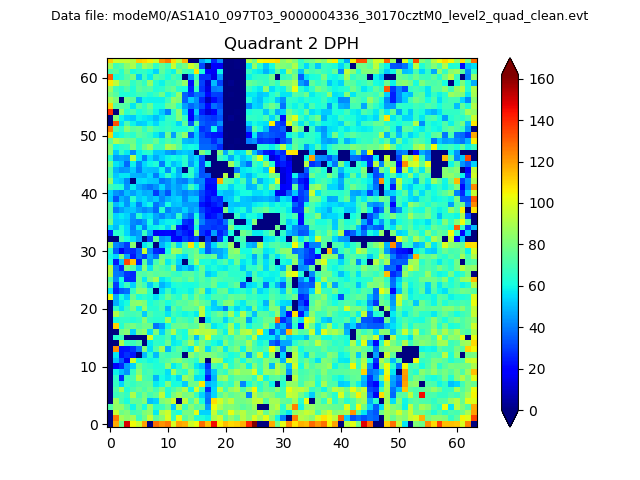
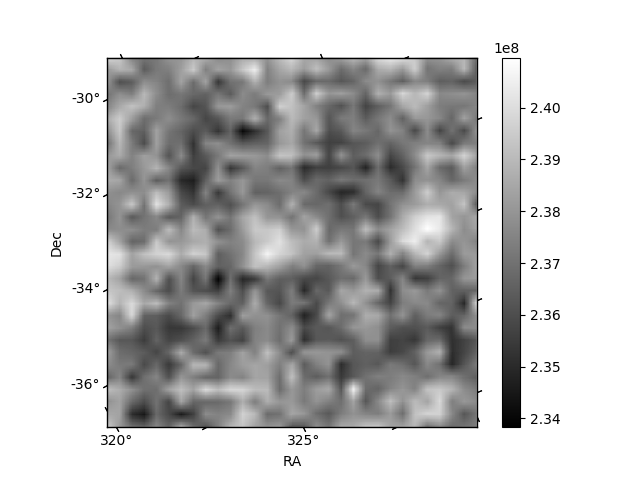
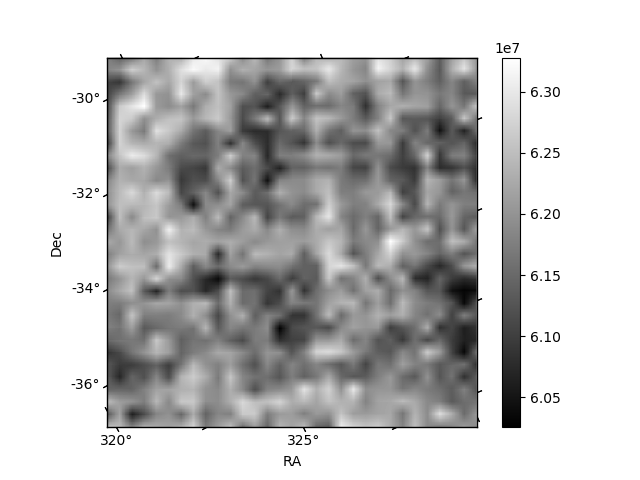
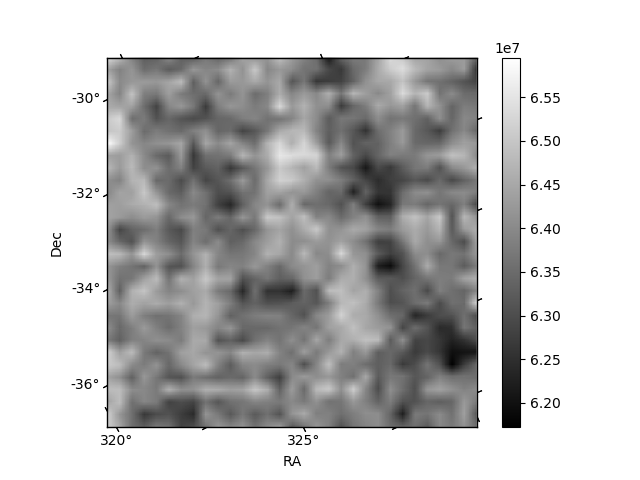
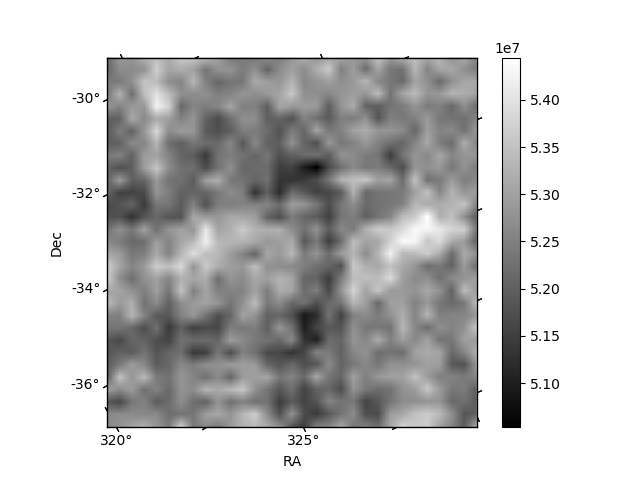
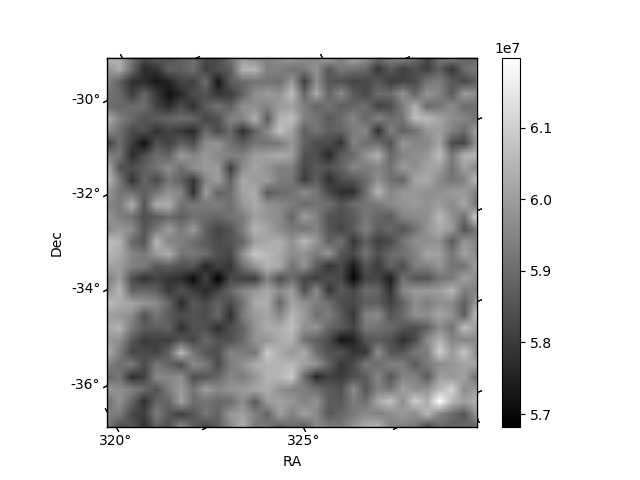
Histogram calculated using DETX and DETY for each event in the final _common_clean file
| Quadrant A | 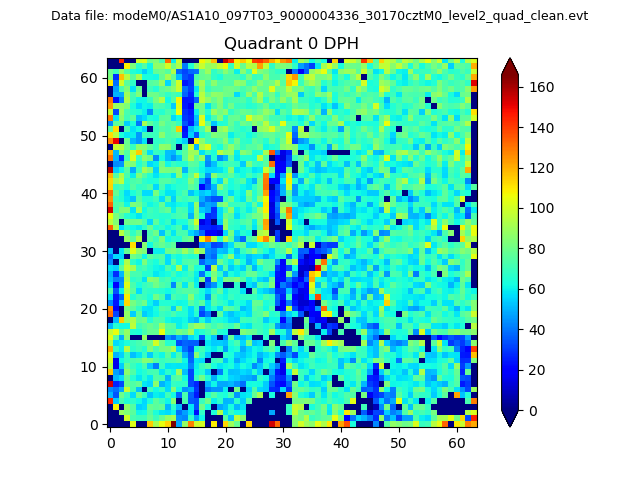 |
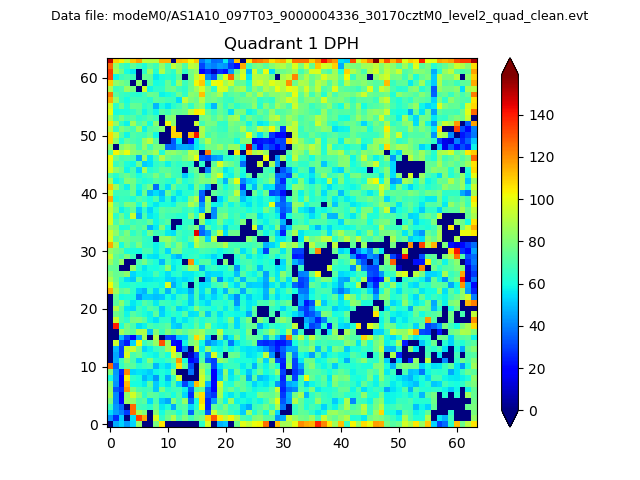 |
Quadrant B |
|---|---|---|---|
| Quadrant D | 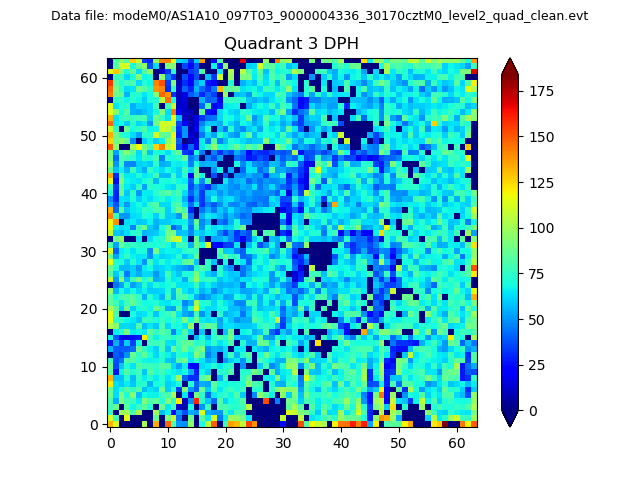 |
 |
Quadrant C |
| Plot type | Count rate plots | Images |
|---|---|---|
| Comparison with Poisson distribution Blue bars denote a histogram of data divided into 1 sec bins. Red curve is a Poisson curve with rate = median count rate of data. |
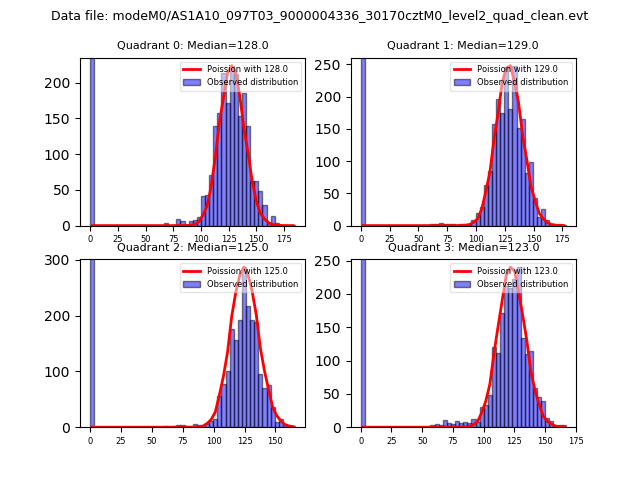 |
 |
| Quadrant-wise count rates Data is divided into 100 sec bins |
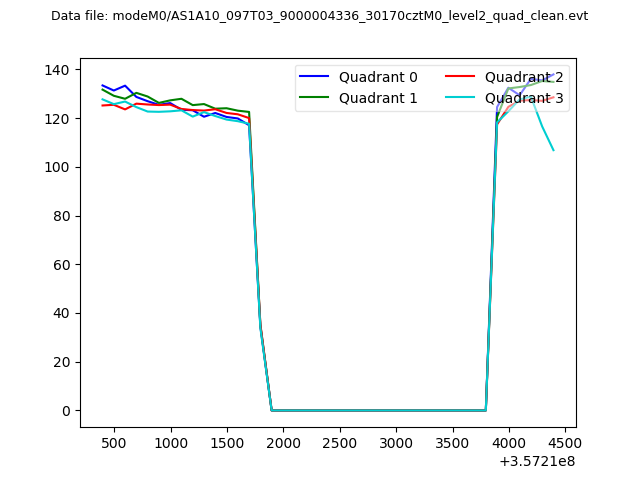 |
|
| Module-wise count rates for Quadrant A Data is divided into 100 sec bins |
 |
 |
| Module-wise count rates for Quadrant B Data is divided into 100 sec bins |
 |
 |
| Module-wise count rates for Quadrant C Data is divided into 100 sec bins |
 |
 |
| Module-wise count rates for Quadrant D Data is divided into 100 sec bins |
 |
 |
| Parameter | Plot |
|---|---|
| CZT HV Monitor | 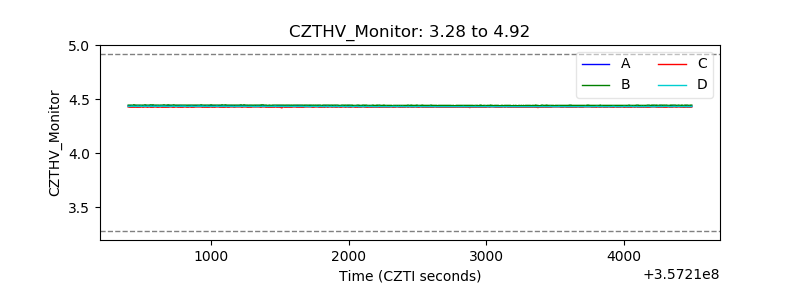 |
| D_VDD |  |
| Temperature 1 | 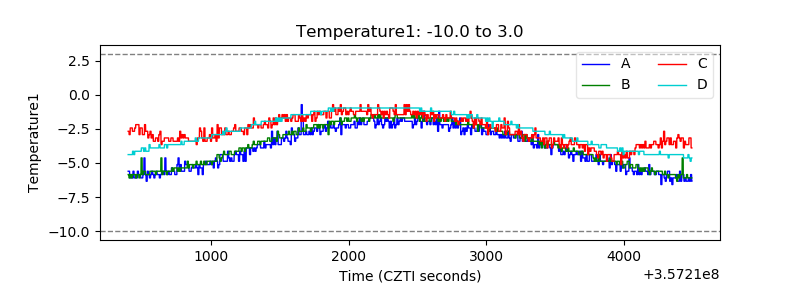 |
| Veto HV Monitor | 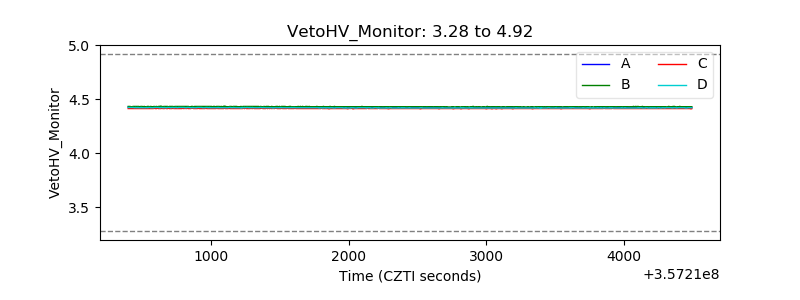 |
| Veto LLD | 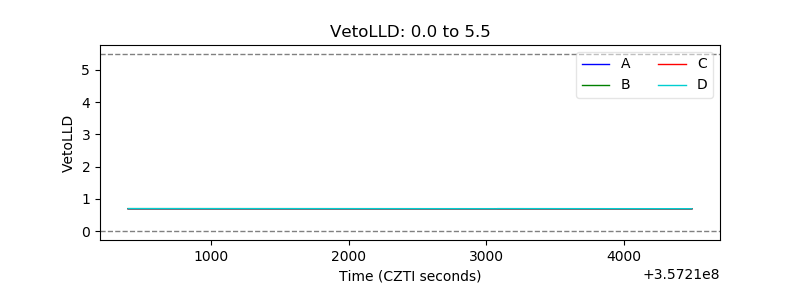 |
| Alpha Counter | 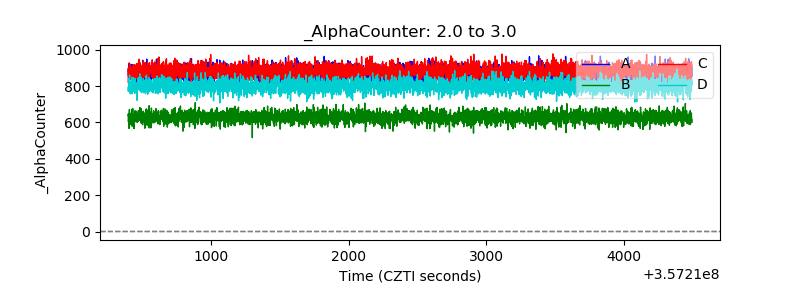 |
| _CPM_Rate | 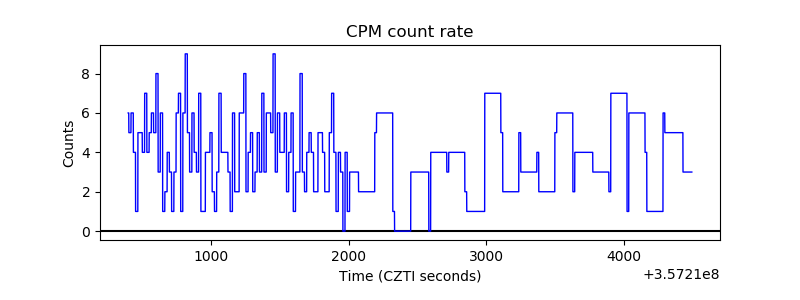 |
| CZT Counter | 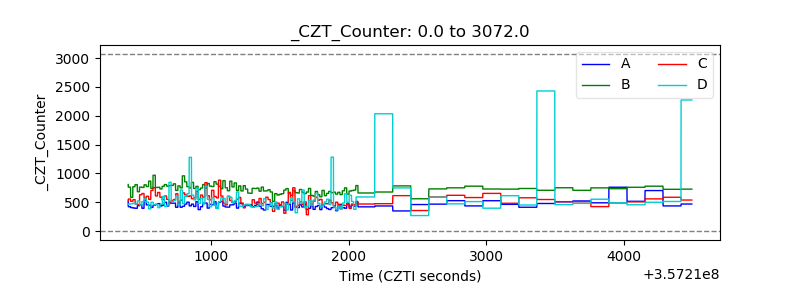 |
| +2.5 Volts monitor |  |
| +5 Volts monitor | 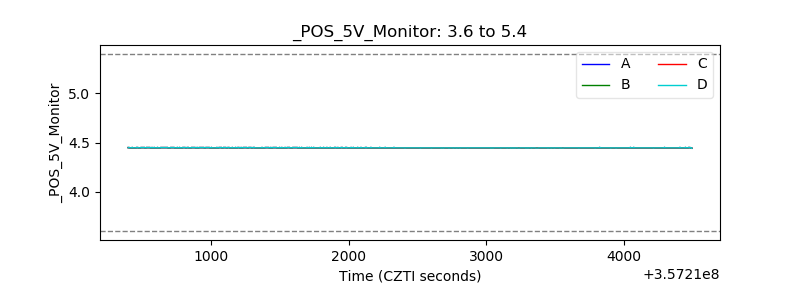 |
| _ROLL_ROT | 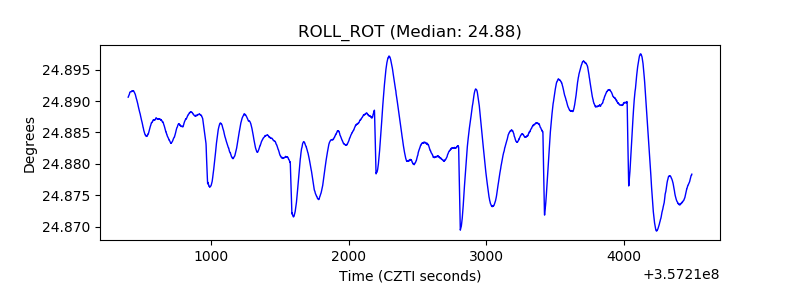 |
| _Roll_DEC | 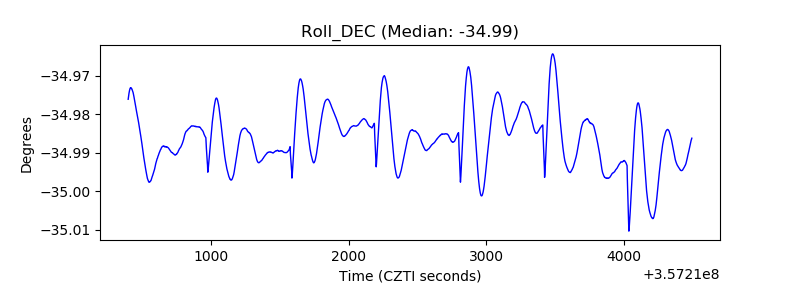 |
| _Roll_RA | 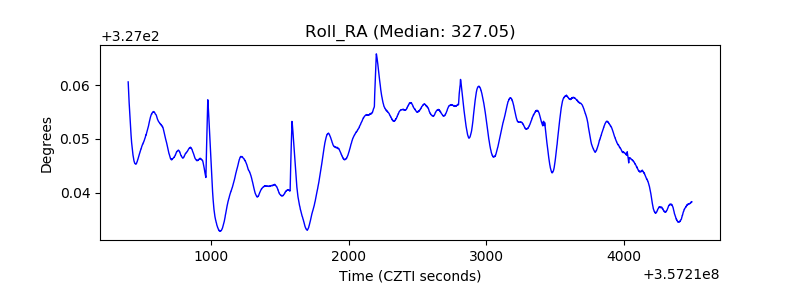 |
| Veto Counter | 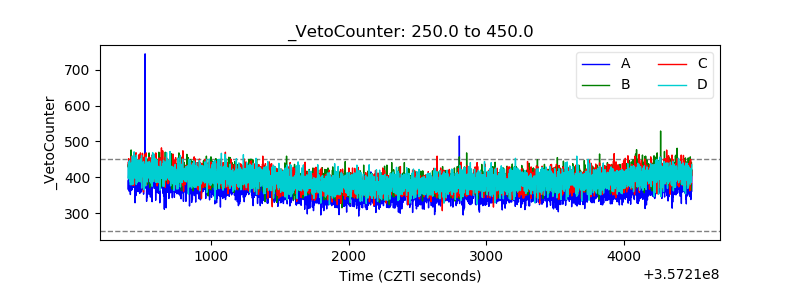 |