| Param | Original file | Final file |
|---|---|---|
| Filename | modeM0/AS1A10_021T06_9000004338cztM0_level2.fits | modeM0/AS1A10_021T06_9000004338cztM0_level2_quad_clean.evt |
| Size (bytes) | 149,719,680 | 146,854,080 |
| Size | 142.8 MB | 140.1 MB |
| Events in quadrant A | 917,058 | 893,254 |
| Events in quadrant B | 866,452 | 883,477 |
| Events in quadrant C | 859,784 | 790,004 |
| Events in quadrant D | 793,774 | 783,903 |
| Mode SS | |||
|---|---|---|---|
| Quadrant | BADHDUFLAG | Total packets | Discarded packets |
| A | 0 | 320 | 0 |
| B | 0 | 320 | 0 |
| C | 0 | 320 | 0 |
| D | 0 | 320 | 0 |
| Mode M9 | |||
|---|---|---|---|
| Quadrant | BADHDUFLAG | Total packets | Discarded packets |
| A | 0 | 5 | 0 |
| B | 0 | 5 | 0 |
| C | 0 | 5 | 0 |
| D | 0 | 5 | 0 |
| Mode M0 | |||
|---|---|---|---|
| Quadrant | BADHDUFLAG | Total packets | Discarded packets |
| A | 0 | 35470 | 0 |
| B | 0 | 48033 | 0 |
| C | 0 | 55242 | 0 |
| D | 0 | 37076 | 0 |
| Quadrant | Total seconds | Saturated seconds | Saturation percentage |
|---|---|---|---|
| A | 15896 | 578 | 3.636135% |
| B | 15896 | 635 | 3.994716% |
| C | 15896 | 1590 | 10.002516% |
| D | 15896 | 504 | 3.170609% |
Noise dominated data is calculated using 1-second bins in cleaned event files. If a bin has >2000 counts, and if more than 50% of those come from <1% of pixels, then it is considered to be noise-dominated and hence unusable.
| Quadrant | # 1 sec bins | Bins with >0 counts | Bins with >2000 counts | High rate bins dominated by noise | Noise dominated (total time) | Noise dominated (detector-on time) | Marked lightcurve |
|---|---|---|---|---|---|---|---|
| A | 16271 | 15895 | 0 | 0 | 0.00% | 0.00% | 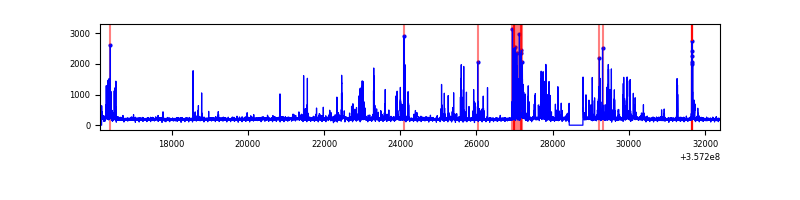 |
| B | 16271 | 15895 | 0 | 0 | 0.00% | 0.00% | 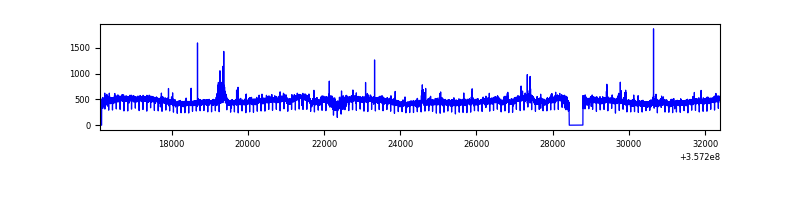 |
| C | 16271 | 15894 | 0 | 0 | 0.00% | 0.00% | 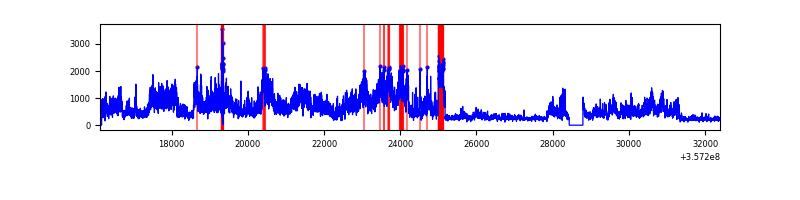 |
| D | 16271 | 15893 | 0 | 0 | 0.00% | 0.00% |  |
Top three noisy pixels from each quadrant. If the there are fewer than three noisy pixels in the level2.evt file, extra rows are filled as -1
| Pixel properties | Quadrant properties | ||||||
|---|---|---|---|---|---|---|---|
| Quadrant | DetID | PixID | Counts | Sigma | Mean | Median | Sigma |
| A | 0 | 29 | 778 | 8.92 | 239 | 223 | 62.2 |
| A | 7 | 110 | 696 | 7.6 | 239 | 223 | 62.2 |
| A | 15 | 236 | 675 | 7.26 | 239 | 223 | 62.2 |
| B | 2 | 9 | 725 | 10.53 | 228 | 216 | 48.3 |
| B | 5 | 232 | 611 | 8.17 | 228 | 216 | 48.3 |
| B | 5 | 128 | 608 | 8.11 | 228 | 216 | 48.3 |
| C | 12 | 241 | 647 | 7.38 | 227 | 211 | 59.1 |
| C | 9 | 209 | 610 | 6.75 | 227 | 211 | 59.1 |
| C | 7 | 111 | 581 | 6.26 | 227 | 211 | 59.1 |
| D | 15 | 46 | 586 | 6.14 | 226 | 205 | 62.0 |
| D | 7 | 3 | 571 | 5.9 | 226 | 205 | 62.0 |
| D | 3 | 14 | 557 | 5.68 | 226 | 205 | 62.0 |
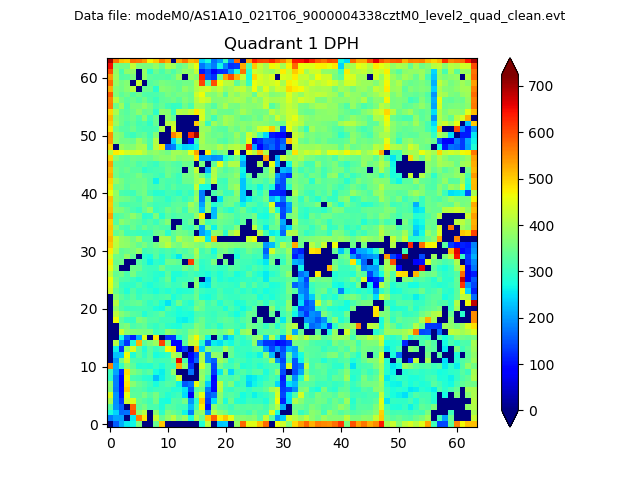
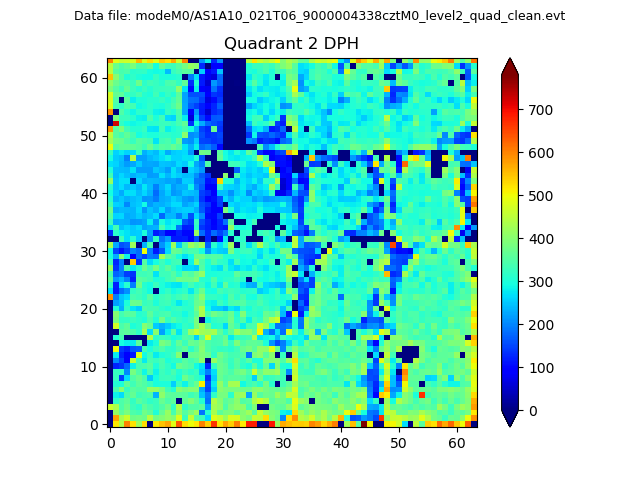
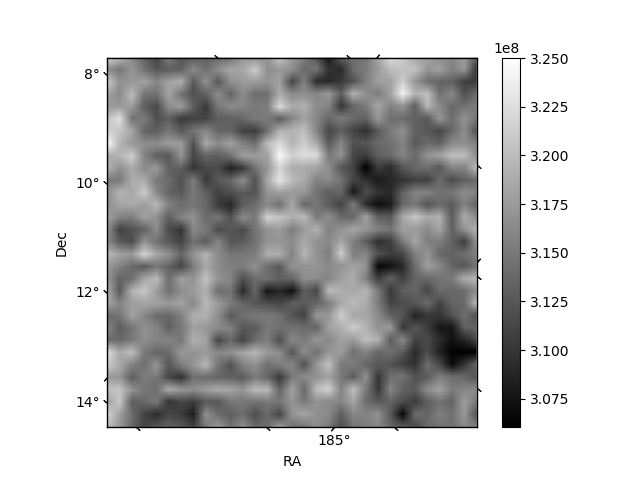
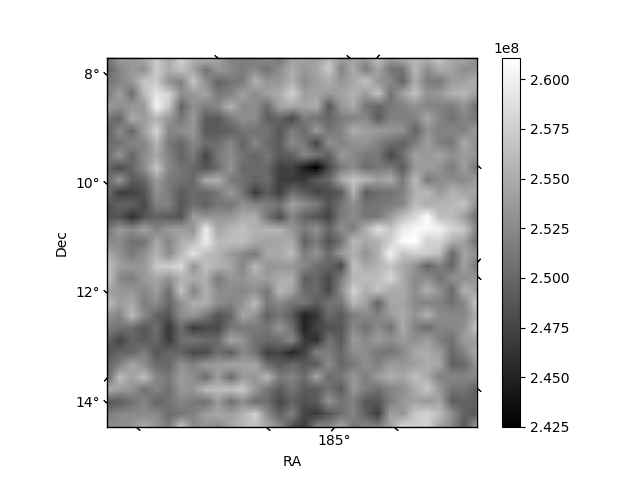
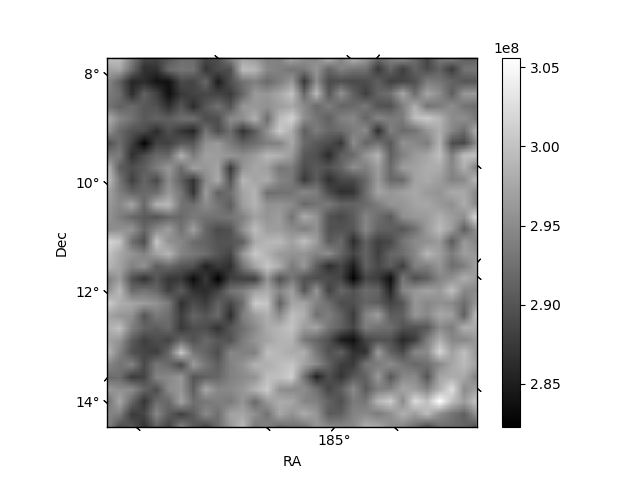
Histogram calculated using DETX and DETY for each event in the final _common_clean file
| Quadrant A | 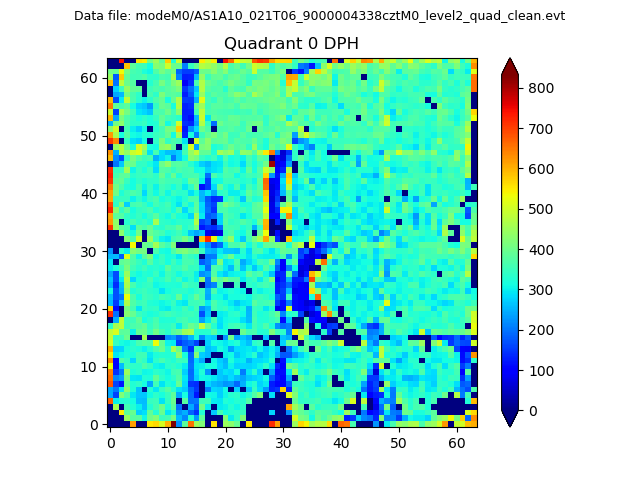 |
 |
Quadrant B |
|---|---|---|---|
| Quadrant D | 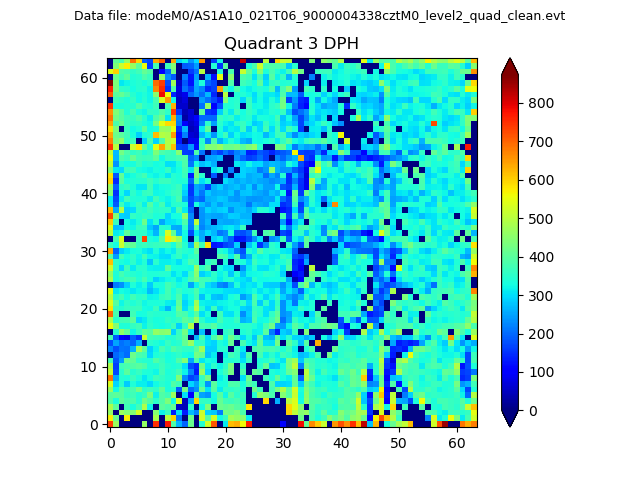 |
 |
Quadrant C |
| Plot type | Count rate plots | Images |
|---|---|---|
| Comparison with Poisson distribution Blue bars denote a histogram of data divided into 1 sec bins. Red curve is a Poisson curve with rate = median count rate of data. |
 |
 |
| Quadrant-wise count rates Data is divided into 100 sec bins |
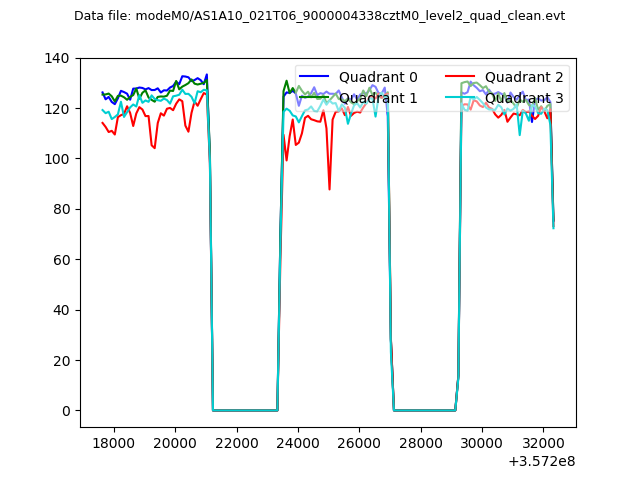 |
|
| Module-wise count rates for Quadrant A Data is divided into 100 sec bins |
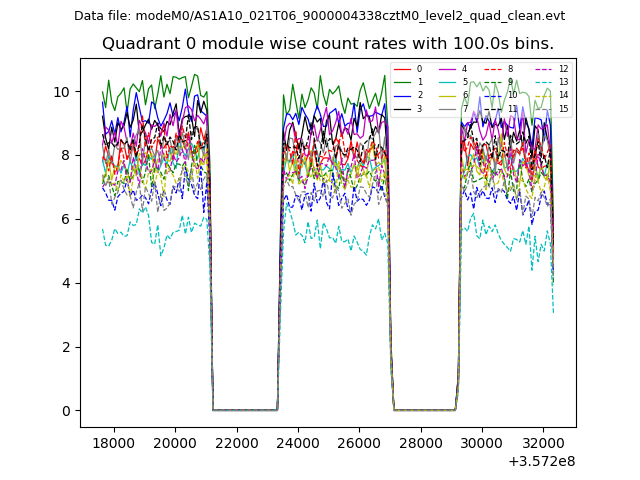 |
 |
| Module-wise count rates for Quadrant B Data is divided into 100 sec bins |
 |
 |
| Module-wise count rates for Quadrant C Data is divided into 100 sec bins |
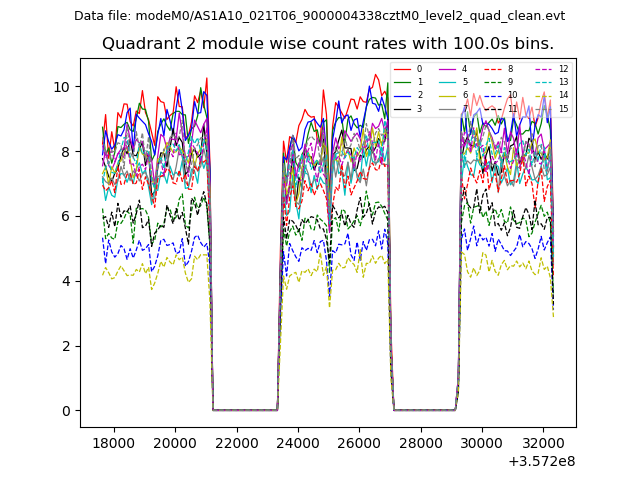 |
 |
| Module-wise count rates for Quadrant D Data is divided into 100 sec bins |
 |
 |
| Parameter | Plot |
|---|---|
| CZT HV Monitor | 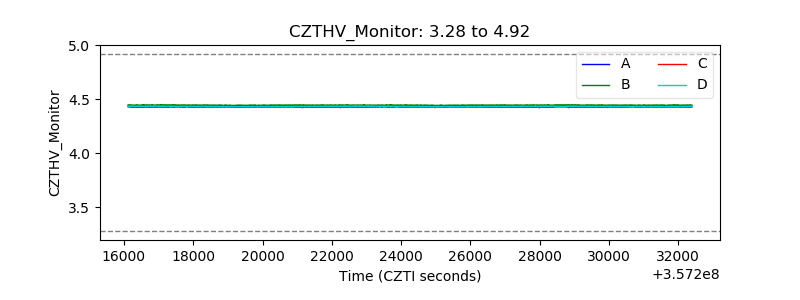 |
| D_VDD | 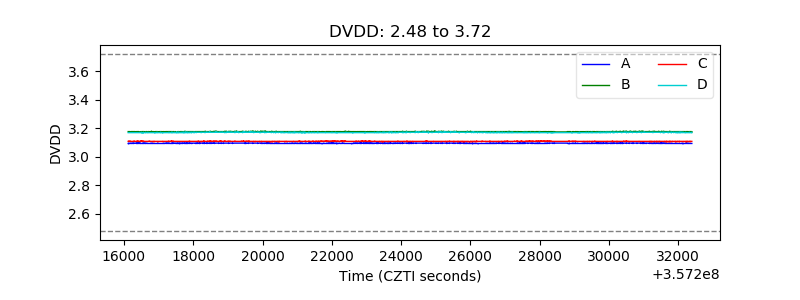 |
| Temperature 1 |  |
| Veto HV Monitor | 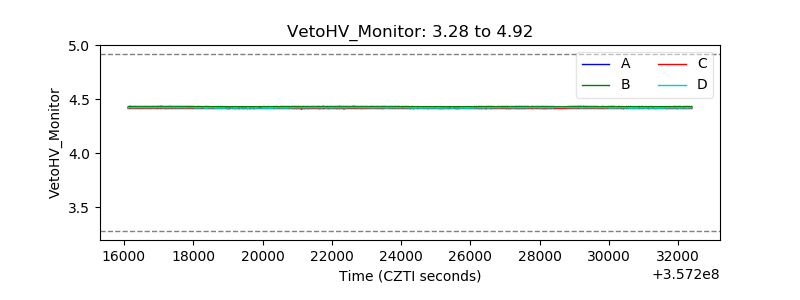 |
| Veto LLD | 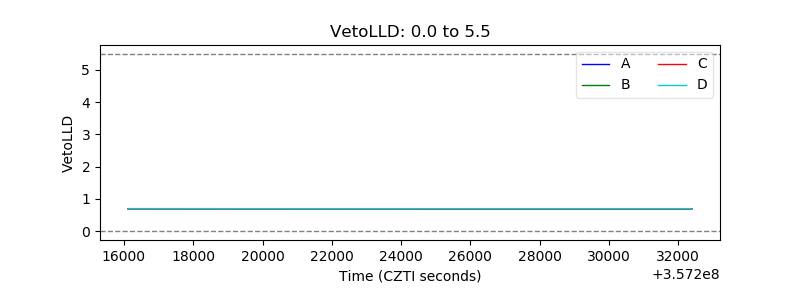 |
| Alpha Counter |  |
| _CPM_Rate | 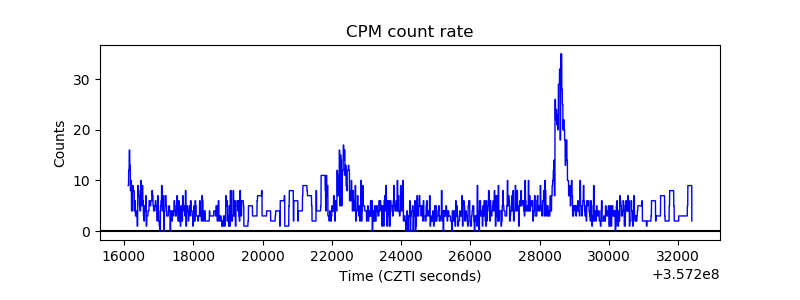 |
| CZT Counter |  |
| +2.5 Volts monitor | 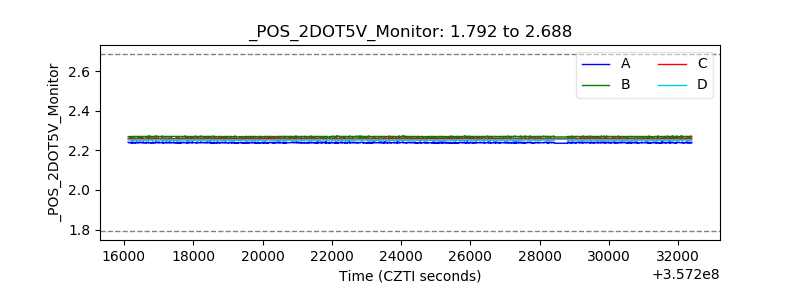 |
| +5 Volts monitor | 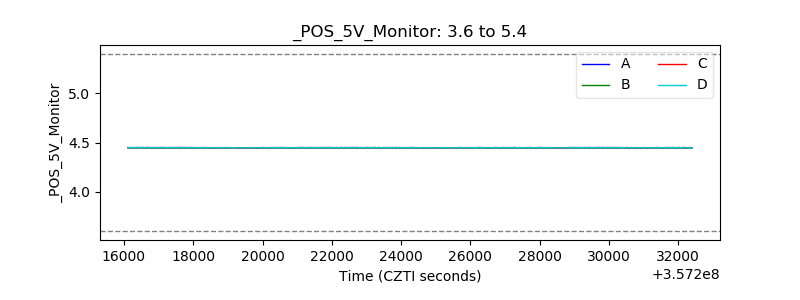 |
| _ROLL_ROT | 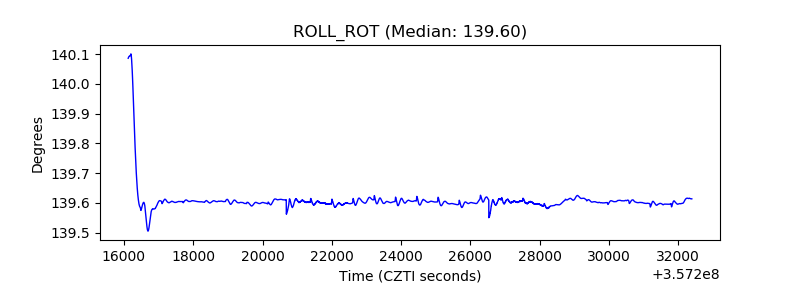 |
| _Roll_DEC | 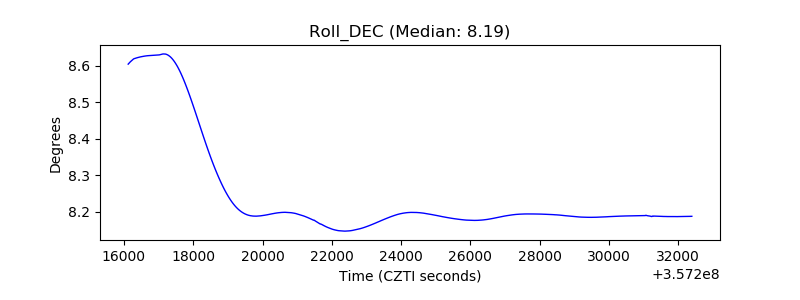 |
| _Roll_RA | 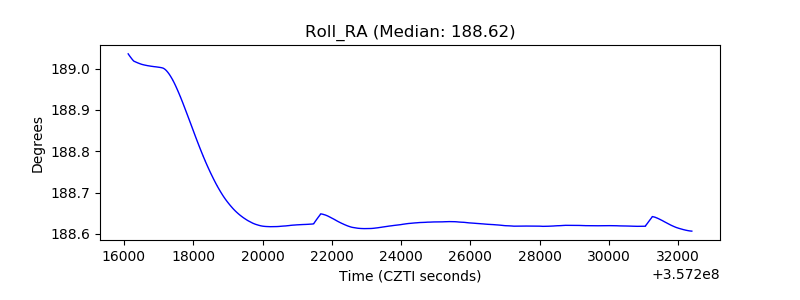 |
| Veto Counter |  |