| Param | Original file | Final file |
|---|---|---|
| Filename | modeM0/AS1A10_021T06_9000004338_30171cztM0_level2.evt | modeM0/AS1A10_021T06_9000004338_30171cztM0_level2_quad_clean.evt |
| Size (bytes) | 793,923,840 | 86,564,160 |
| Size | 757.1 MB | 82.6 MB |
| Events in quadrant A | 4,089,358 | 535,474 |
| Events in quadrant B | 6,139,519 | 533,627 |
| Events in quadrant C | 9,018,955 | 486,962 |
| Events in quadrant D | 4,260,094 | 512,808 |
| Mode SS | |||
|---|---|---|---|
| Quadrant | BADHDUFLAG | Total packets | Discarded packets |
| A | 0 | 160 | 0 |
| B | 0 | 160 | 0 |
| C | 0 | 160 | 0 |
| D | 0 | 160 | 0 |
| Mode M9 | |||
|---|---|---|---|
| Quadrant | BADHDUFLAG | Total packets | Discarded packets |
| A | 0 | 1 | 0 |
| B | 0 | 1 | 0 |
| C | 0 | 1 | 0 |
| D | 0 | 1 | 0 |
| Mode M0 | |||
|---|---|---|---|
| Quadrant | BADHDUFLAG | Total packets | Discarded packets |
| A | 0 | 17237 | 1 |
| B | 0 | 24152 | 1 |
| C | 0 | 32519 | 1 |
| D | 0 | 17582 | 1 |
| Quadrant | Total seconds | Saturated seconds | Saturation percentage |
|---|---|---|---|
| A | 7947 | 344 | 4.328677% |
| B | 7948 | 453 | 5.699547% |
| C | 7947 | 1168 | 14.697370% |
| D | 7947 | 248 | 3.120674% |
Noise dominated data is calculated using 1-second bins in cleaned event files. If a bin has >2000 counts, and if more than 50% of those come from <1% of pixels, then it is considered to be noise-dominated and hence unusable.
| Quadrant | # 1 sec bins | Bins with >0 counts | Bins with >2000 counts | High rate bins dominated by noise | Noise dominated (total time) | Noise dominated (detector-on time) | Marked lightcurve |
|---|---|---|---|---|---|---|---|
| A | 7962 | 7948 | 24 | 24 | 0.30% | 0.30% | 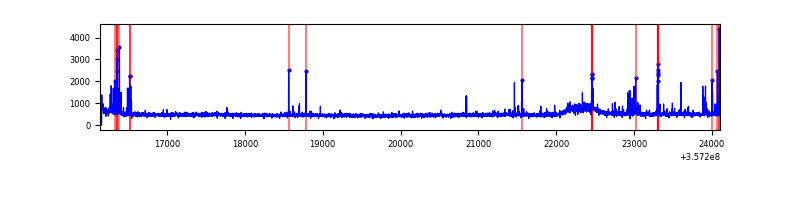 |
| B | 7963 | 7949 | 1 | 1 | 0.01% | 0.01% | 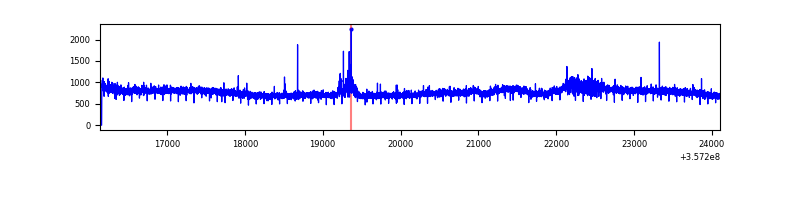 |
| C | 7962 | 7948 | 290 | 290 | 3.64% | 3.65% | 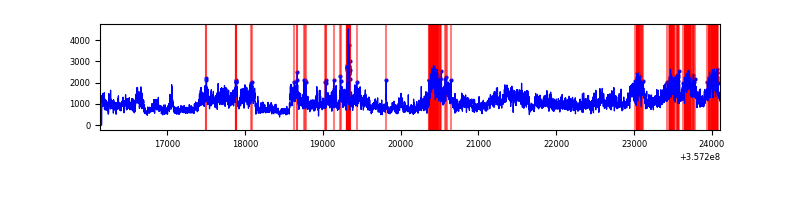 |
| D | 7962 | 7948 | 45 | 45 | 0.57% | 0.57% | 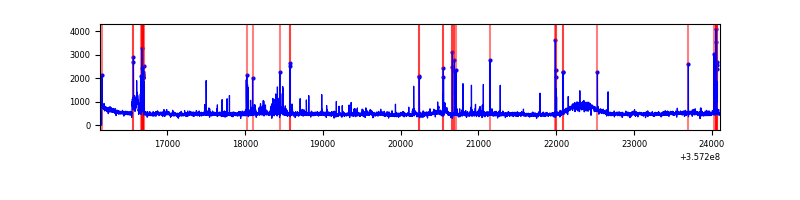 |
Top three noisy pixels from each quadrant. If the there are fewer than three noisy pixels in the level2.evt file, extra rows are filled as -1
| Pixel properties | Quadrant properties | ||||||
|---|---|---|---|---|---|---|---|
| Quadrant | DetID | PixID | Counts | Sigma | Mean | Median | Sigma |
| A | 0 | 13 | 232040 | 1143.11 | 1000 | 975 | 202.1 |
| A | 13 | 254 | 13795 | 63.42 | 1000 | 975 | 202.1 |
| A | 3 | 137 | 10454 | 46.89 | 1000 | 975 | 202.1 |
| B | 6 | 159 | 2217565 | 11493.63 | 981 | 952 | 192.9 |
| B | 6 | 36 | 60520 | 308.87 | 981 | 952 | 192.9 |
| B | 12 | 111 | 24470 | 121.94 | 981 | 952 | 192.9 |
| C | 3 | 233 | 5137856 | 23424.52 | 931 | 937 | 219.3 |
| C | 14 | 238 | 148145 | 671.27 | 931 | 937 | 219.3 |
| C | 15 | 208 | 91447 | 412.73 | 931 | 937 | 219.3 |
| D | 1 | 52 | 256725 | 1080.79 | 971 | 945 | 236.7 |
| D | 8 | 195 | 167966 | 705.74 | 971 | 945 | 236.7 |
| D | 2 | 250 | 63401 | 263.91 | 971 | 945 | 236.7 |
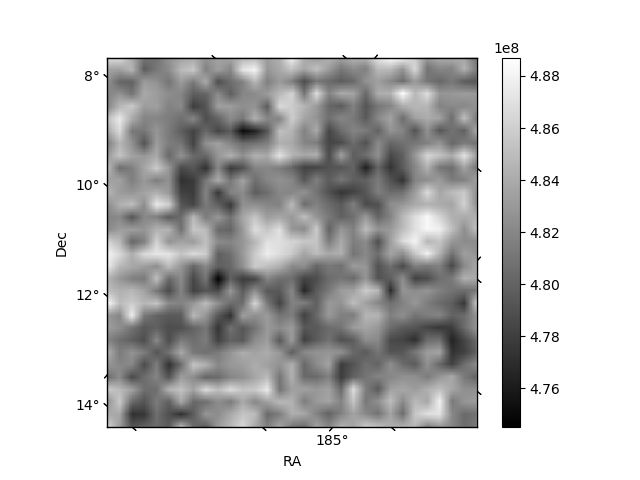
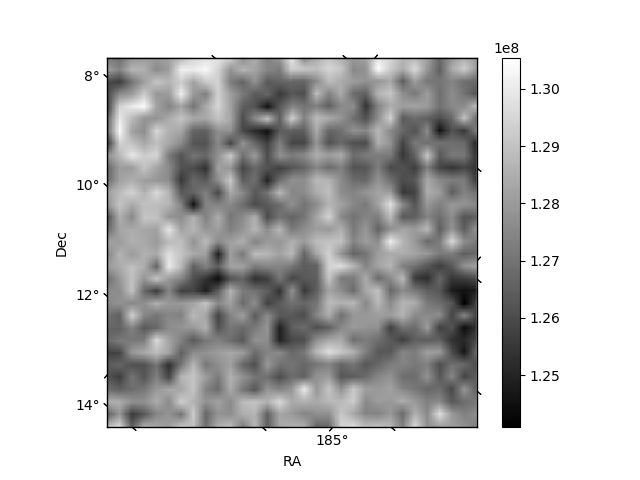
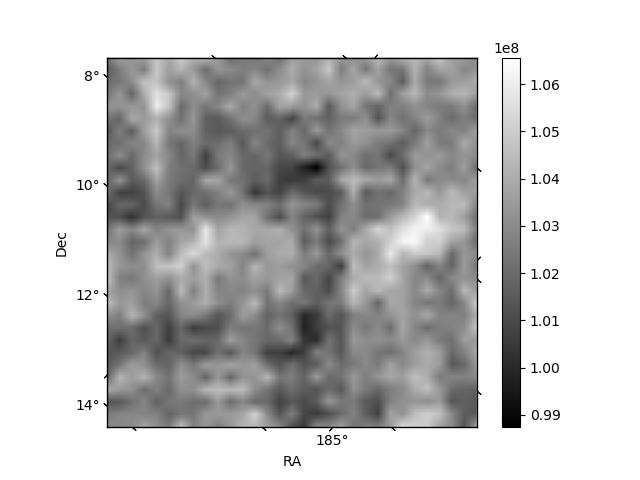
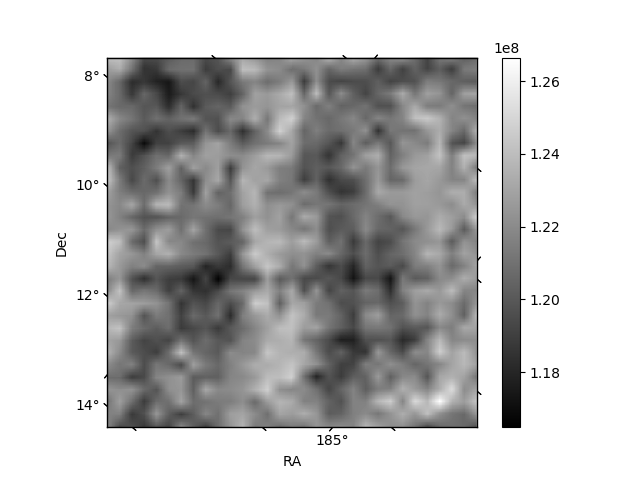
Histogram calculated using DETX and DETY for each event in the final _common_clean file
| Quadrant A | 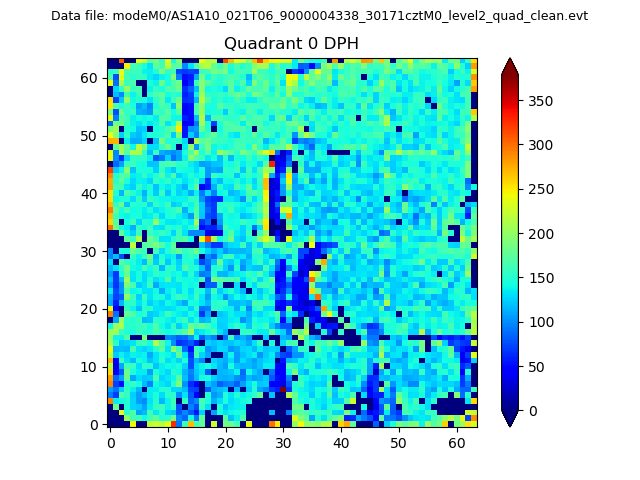 |
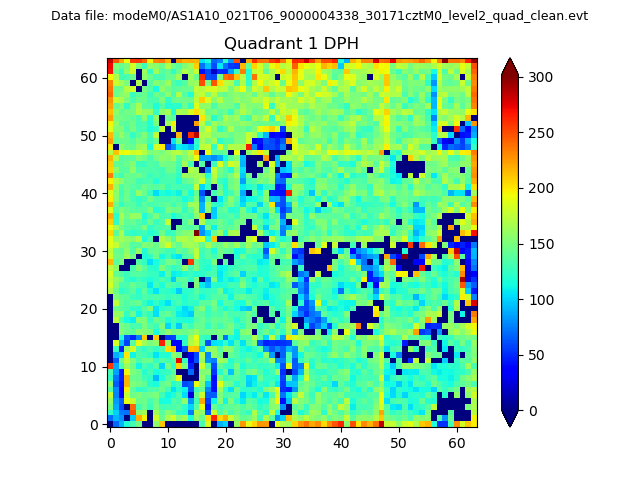 |
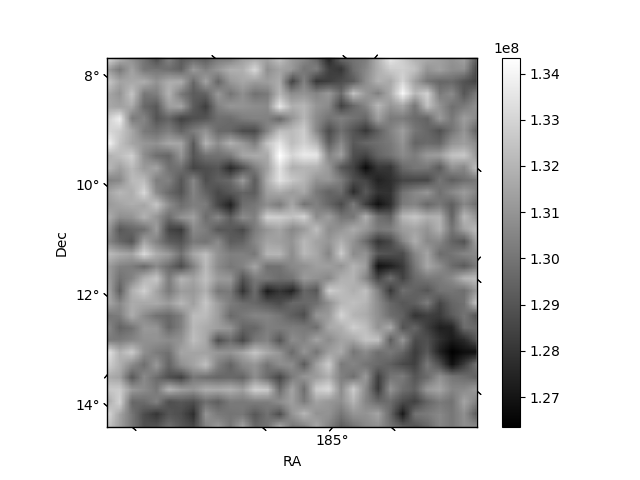
Quadrant B |
|---|---|---|---|
| Quadrant D | 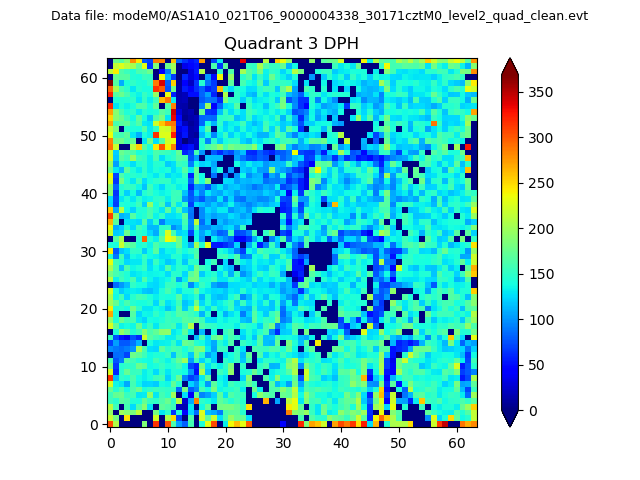 |
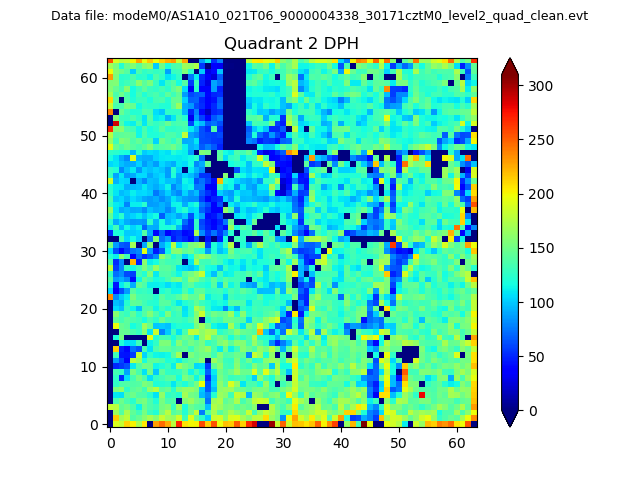 |
Quadrant C |
| Plot type | Count rate plots | Images |
|---|---|---|
| Comparison with Poisson distribution Blue bars denote a histogram of data divided into 1 sec bins. Red curve is a Poisson curve with rate = median count rate of data. |
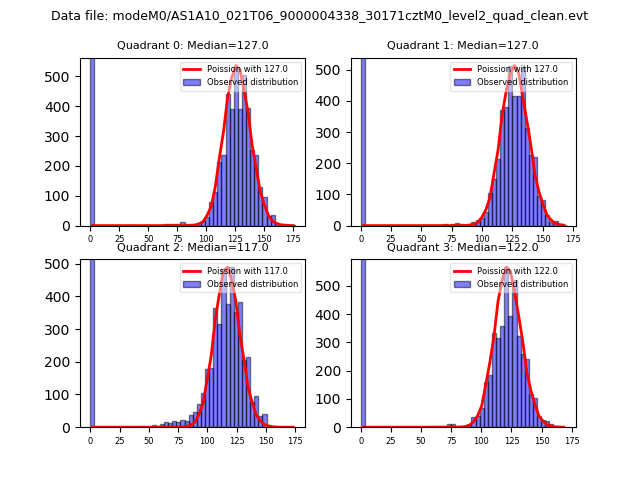 |
 |
| Quadrant-wise count rates Data is divided into 100 sec bins |
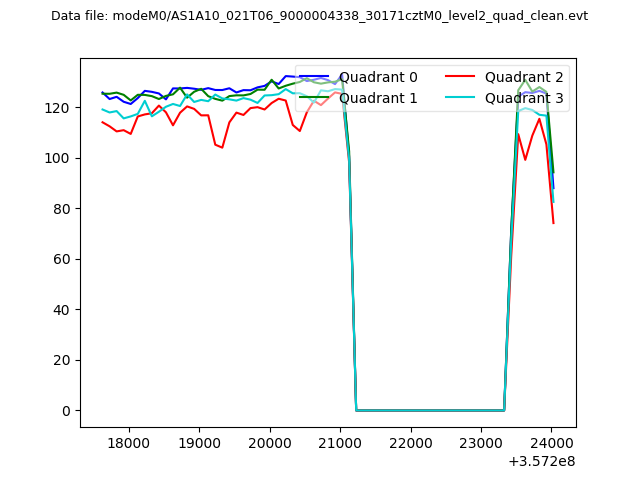 |
|
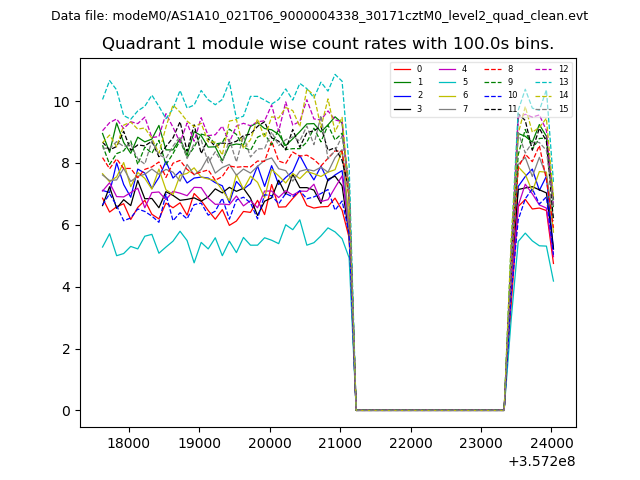
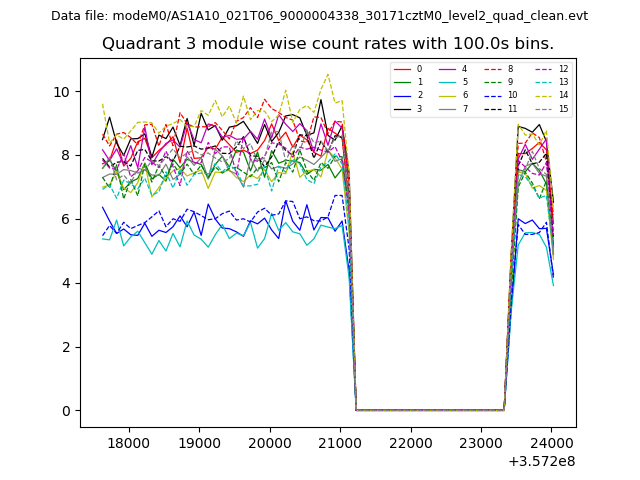
| Module-wise count rates for Quadrant A Data is divided into 100 sec bins |
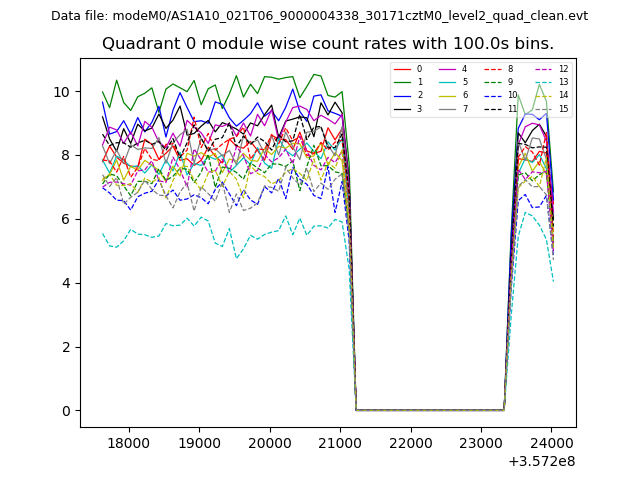 |
 |
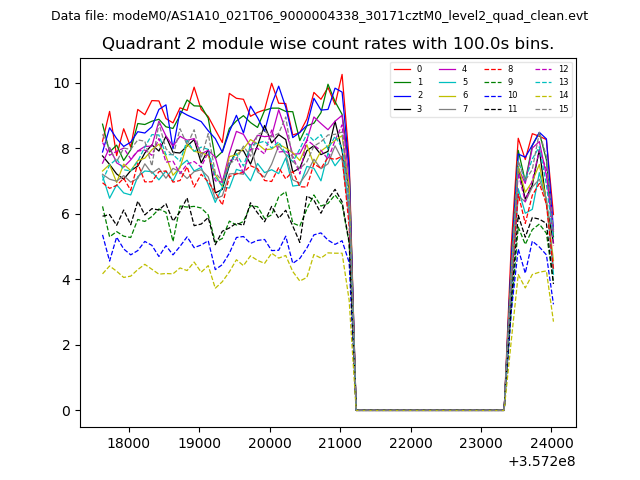
| Module-wise count rates for Quadrant B Data is divided into 100 sec bins |
 |
 |
| Module-wise count rates for Quadrant C Data is divided into 100 sec bins |
 |
 |
| Module-wise count rates for Quadrant D Data is divided into 100 sec bins |
 |
 |
| Parameter | Plot |
|---|---|
| CZT HV Monitor | 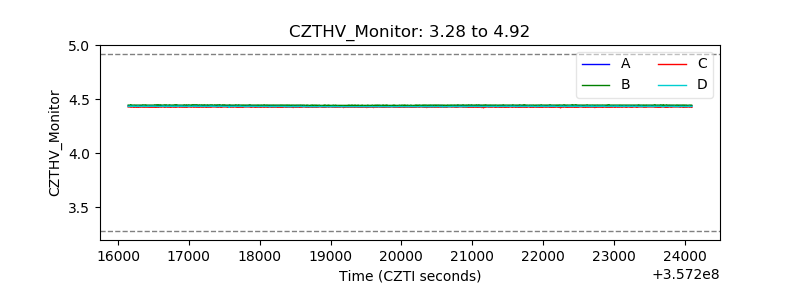 |
| D_VDD | 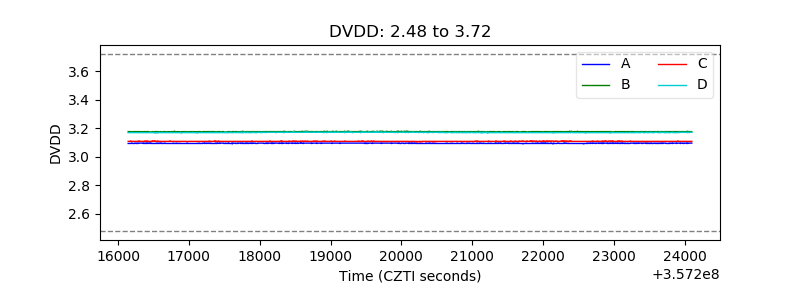 |
| Temperature 1 | 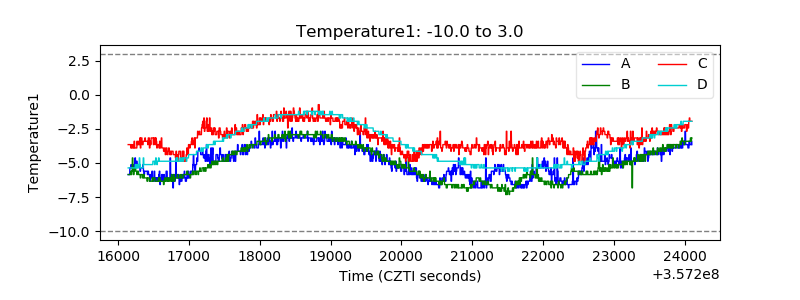 |
| Veto HV Monitor |  |
| Veto LLD | 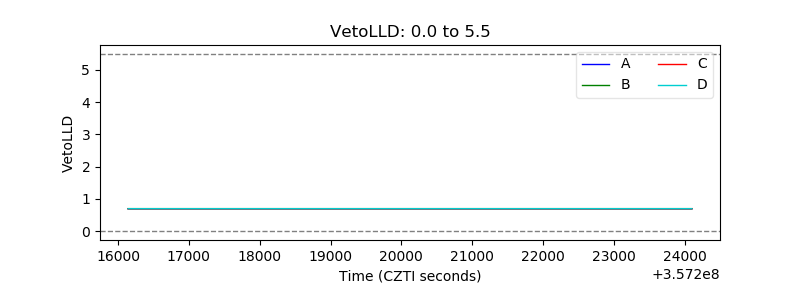 |
| Alpha Counter | 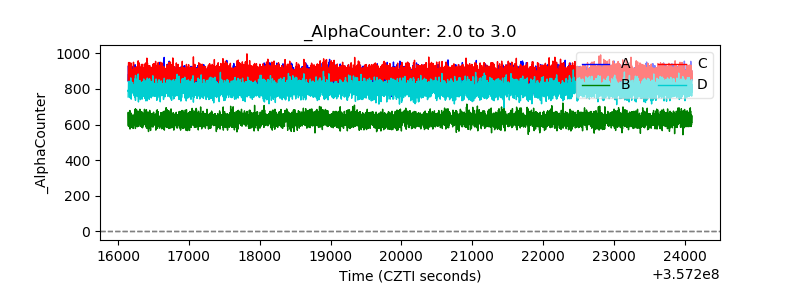 |
| _CPM_Rate | 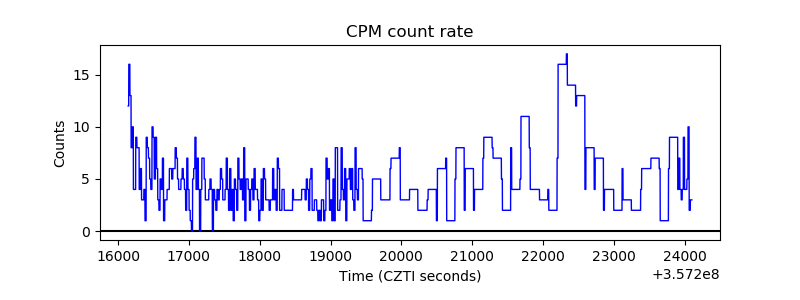 |
| CZT Counter | 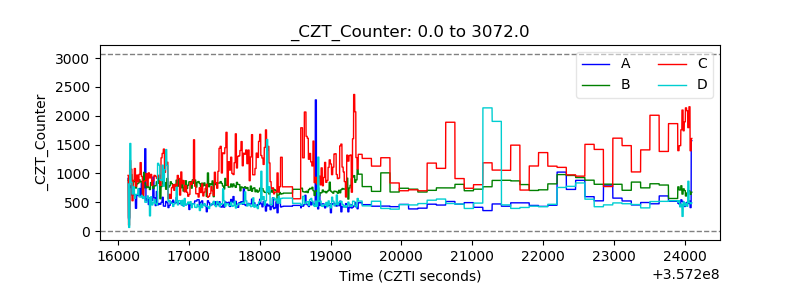 |
| +2.5 Volts monitor | 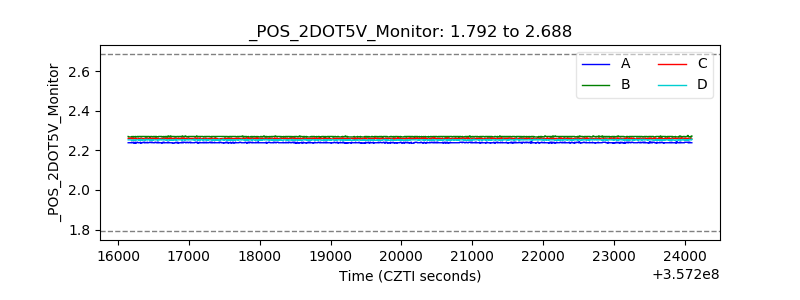 |
| +5 Volts monitor |  |
| _ROLL_ROT | 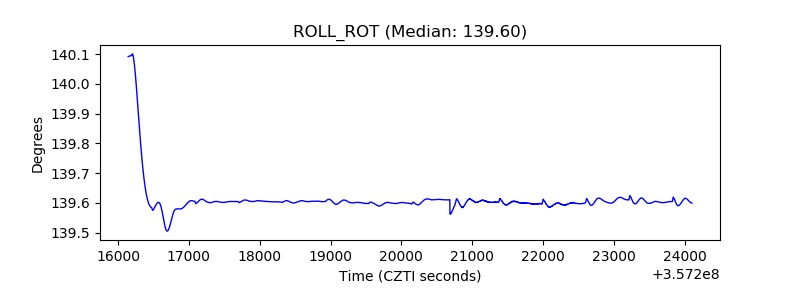 |
| _Roll_DEC | 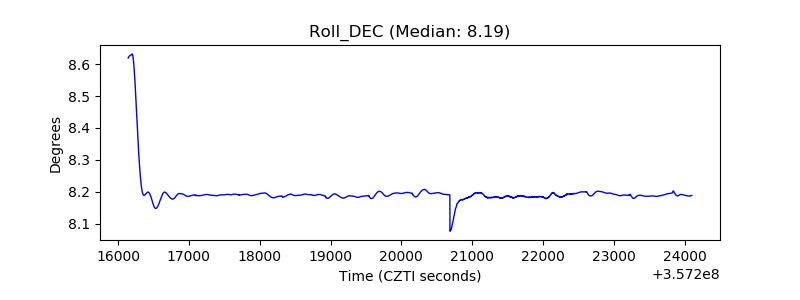 |
| _Roll_RA | 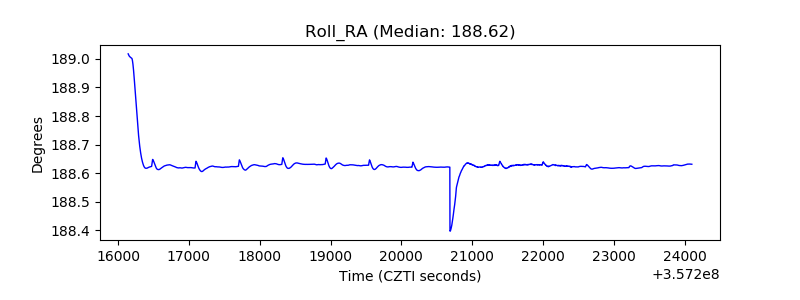 |
| Veto Counter | 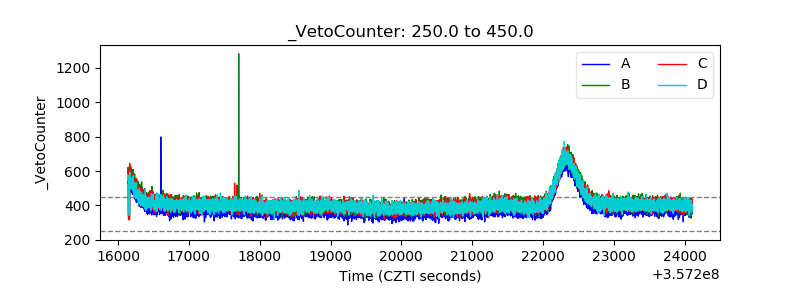 |