| Param | Original file | Final file |
|---|---|---|
| Filename | modeM0/AS1A10_021T06_9000004338_30172cztM0_level2.evt | modeM0/AS1A10_021T06_9000004338_30172cztM0_level2_quad_clean.evt |
| Size (bytes) | 726,488,640 | 92,016,000 |
| Size | 692.8 MB | 87.8 MB |
| Events in quadrant A | 4,362,420 | 579,588 |
| Events in quadrant B | 5,739,253 | 581,682 |
| Events in quadrant C | 6,824,269 | 541,161 |
| Events in quadrant D | 4,564,102 | 556,939 |
| Mode SS | |||
|---|---|---|---|
| Quadrant | BADHDUFLAG | Total packets | Discarded packets |
| A | 0 | 154 | 0 |
| B | 0 | 154 | 0 |
| C | 0 | 154 | 0 |
| D | 0 | 154 | 0 |
| Mode M9 | |||
|---|---|---|---|
| Quadrant | BADHDUFLAG | Total packets | Discarded packets |
| A | 0 | 4 | 0 |
| B | 0 | 4 | 0 |
| C | 0 | 4 | 0 |
| D | 0 | 4 | 0 |
| Mode M0 | |||
|---|---|---|---|
| Quadrant | BADHDUFLAG | Total packets | Discarded packets |
| A | 0 | 17816 | 1 |
| B | 0 | 22892 | 1 |
| C | 0 | 25413 | 1 |
| D | 0 | 18340 | 1 |
| Quadrant | Total seconds | Saturated seconds | Saturation percentage |
|---|---|---|---|
| A | 7572 | 277 | 3.658214% |
| B | 7572 | 269 | 3.552562% |
| C | 7572 | 888 | 11.727417% |
| D | 7572 | 245 | 3.235605% |
Noise dominated data is calculated using 1-second bins in cleaned event files. If a bin has >2000 counts, and if more than 50% of those come from <1% of pixels, then it is considered to be noise-dominated and hence unusable.
| Quadrant | # 1 sec bins | Bins with >0 counts | Bins with >2000 counts | High rate bins dominated by noise | Noise dominated (total time) | Noise dominated (detector-on time) | Marked lightcurve |
|---|---|---|---|---|---|---|---|
| A | 7932 | 7572 | 94 | 94 | 1.19% | 1.24% | 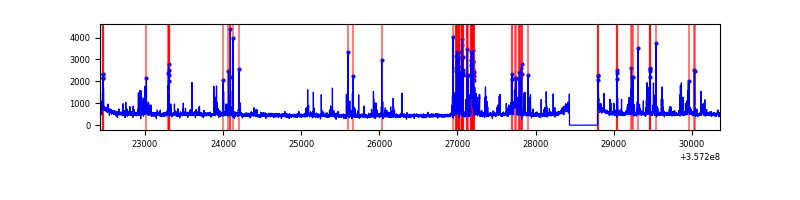 |
| B | 7932 | 7572 | 1 | 1 | 0.01% | 0.01% | 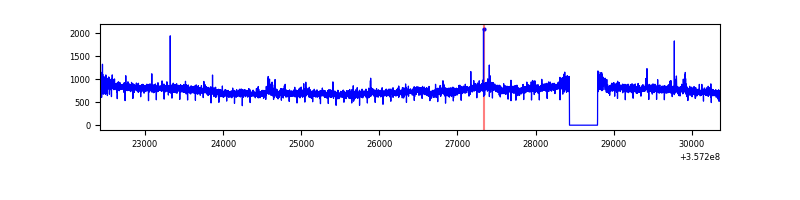 |
| C | 7932 | 7572 | 290 | 290 | 3.66% | 3.83% | 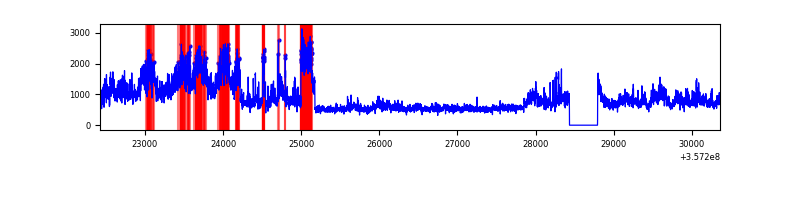 |
| D | 7932 | 7573 | 127 | 127 | 1.60% | 1.68% | 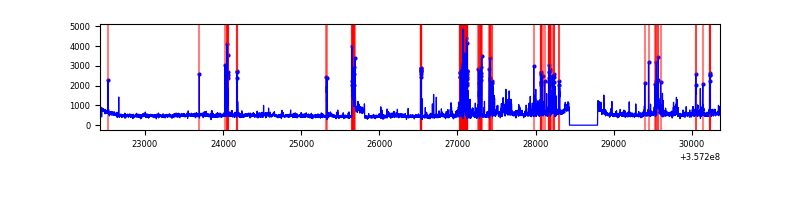 |
Top three noisy pixels from each quadrant. If the there are fewer than three noisy pixels in the level2.evt file, extra rows are filled as -1
| Pixel properties | Quadrant properties | ||||||
|---|---|---|---|---|---|---|---|
| Quadrant | DetID | PixID | Counts | Sigma | Mean | Median | Sigma |
| A | 0 | 13 | 745435 | 3923.52 | 935 | 913 | 189.8 |
| A | 13 | 254 | 11791 | 57.33 | 935 | 913 | 189.8 |
| A | 3 | 137 | 9852 | 47.11 | 935 | 913 | 189.8 |
| B | 6 | 159 | 2059189 | 11400.2 | 925 | 899 | 180.5 |
| B | 12 | 111 | 22951 | 122.14 | 925 | 899 | 180.5 |
| B | 11 | 111 | 21226 | 112.58 | 925 | 899 | 180.5 |
| C | 3 | 233 | 3189855 | 15289.93 | 886 | 892 | 208.6 |
| C | 14 | 238 | 139732 | 665.69 | 886 | 892 | 208.6 |
| C | 15 | 208 | 26760 | 124.03 | 886 | 892 | 208.6 |
| D | 1 | 52 | 680701 | 3131.6 | 909 | 887 | 217.1 |
| D | 8 | 195 | 238108 | 1092.77 | 909 | 887 | 217.1 |
| D | 13 | 104 | 123696 | 565.73 | 909 | 887 | 217.1 |
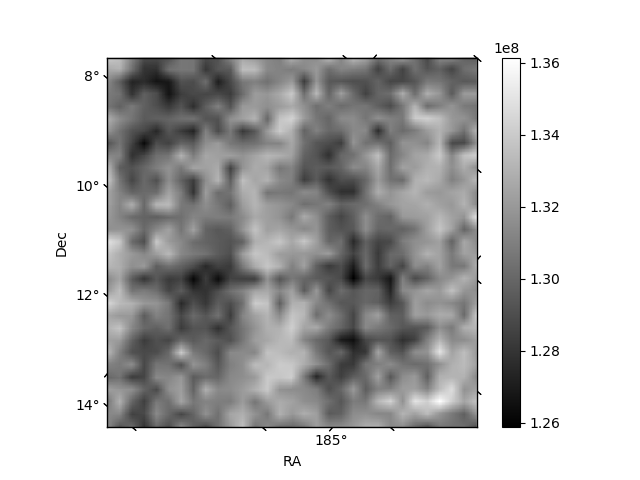
Histogram calculated using DETX and DETY for each event in the final _common_clean file
| Quadrant A | 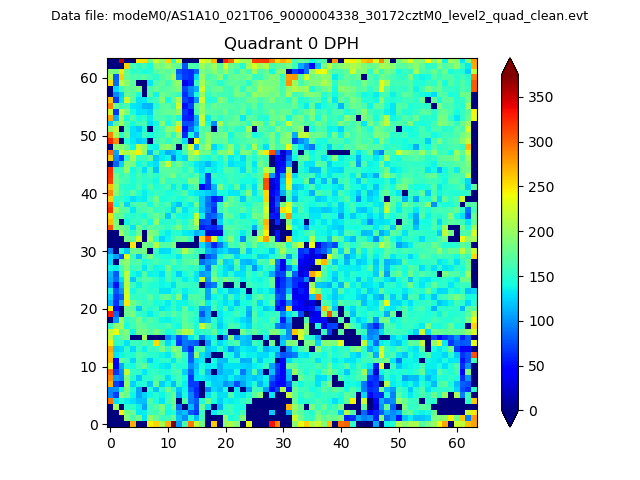 |
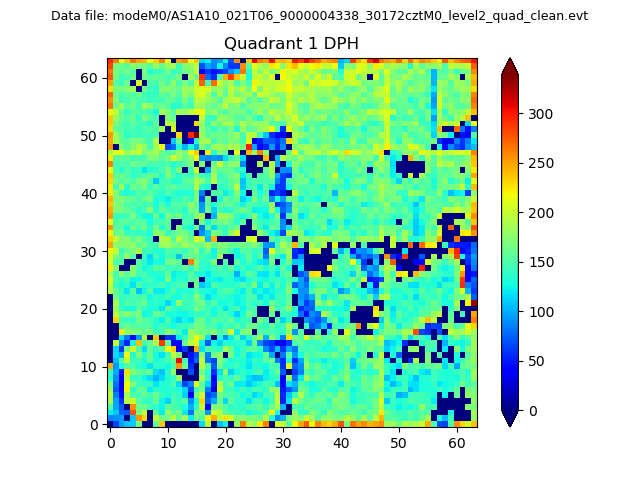 |
Quadrant B |
|---|---|---|---|
| Quadrant D | 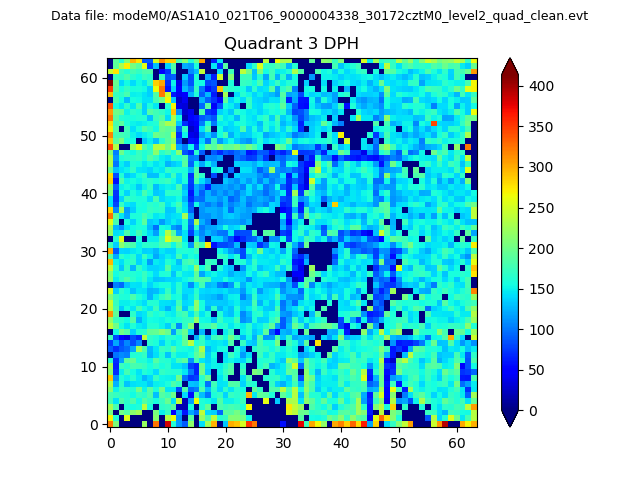 |
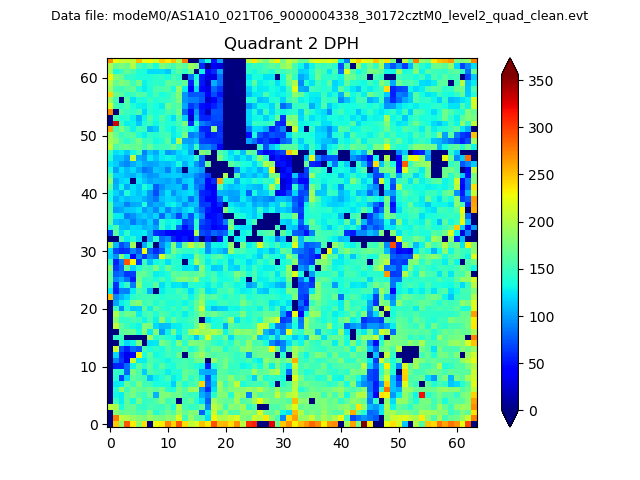 |
Quadrant C |
| Plot type | Count rate plots | Images |
|---|---|---|
| Comparison with Poisson distribution Blue bars denote a histogram of data divided into 1 sec bins. Red curve is a Poisson curve with rate = median count rate of data. |
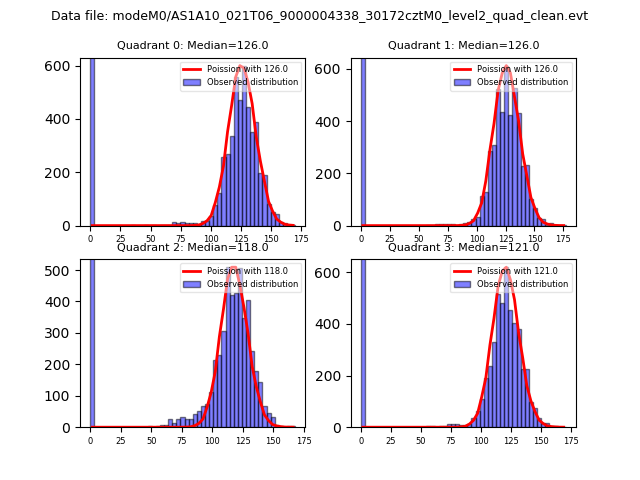 |
 |
| Quadrant-wise count rates Data is divided into 100 sec bins |
 |
|
| Module-wise count rates for Quadrant A Data is divided into 100 sec bins |
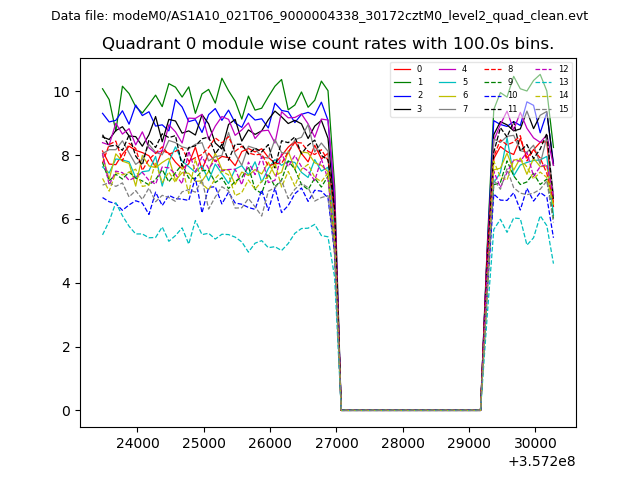 |
 |
| Module-wise count rates for Quadrant B Data is divided into 100 sec bins |
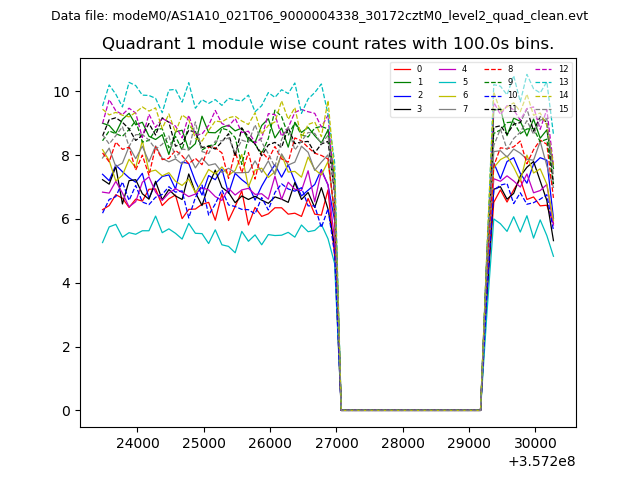 |
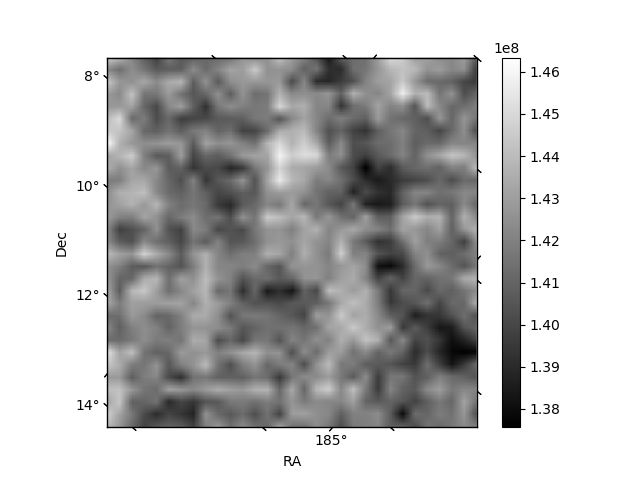 |
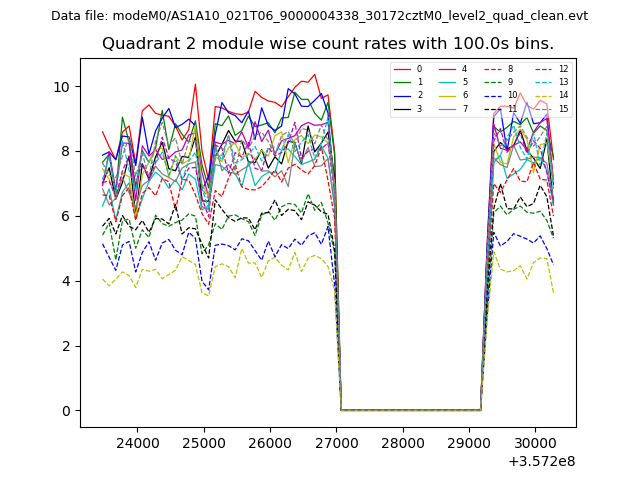
| Module-wise count rates for Quadrant C Data is divided into 100 sec bins |
 |
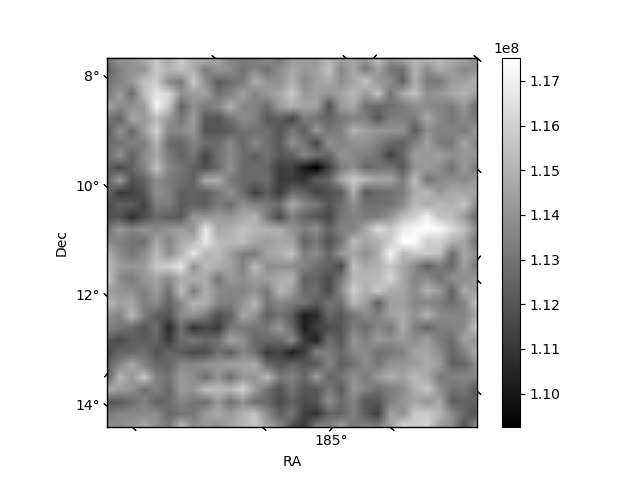 |
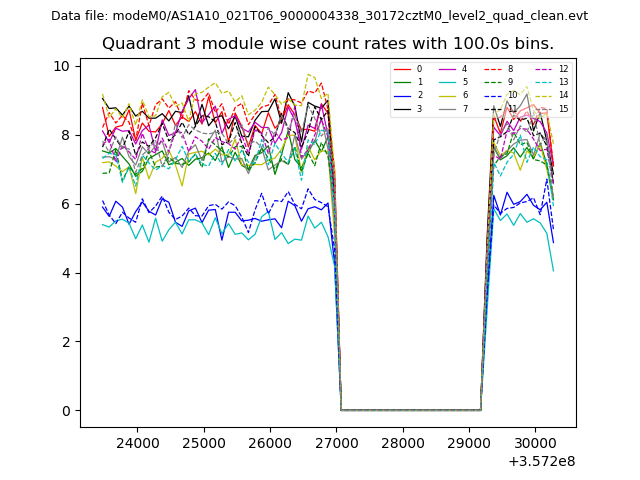
| Module-wise count rates for Quadrant D Data is divided into 100 sec bins |
 |
 |
| Parameter | Plot |
|---|---|
| CZT HV Monitor | 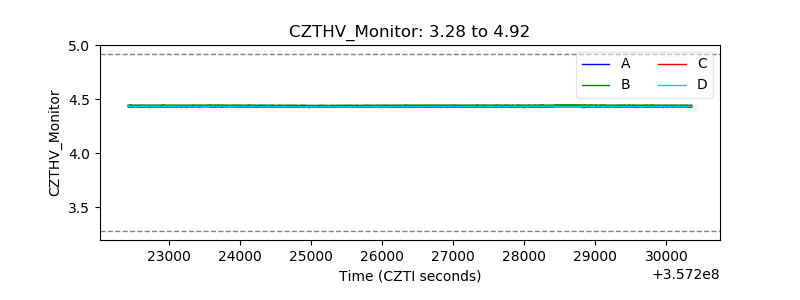 |
| D_VDD | 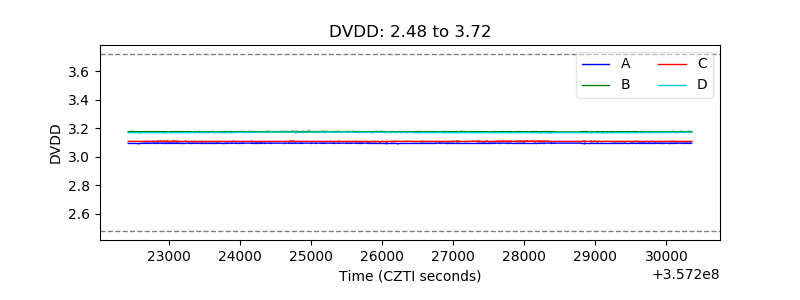 |
| Temperature 1 | 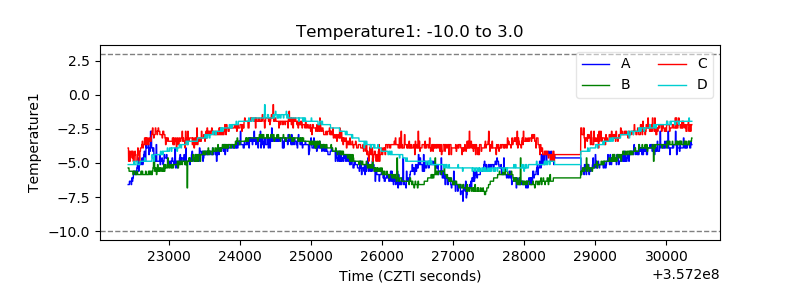 |
| Veto HV Monitor | 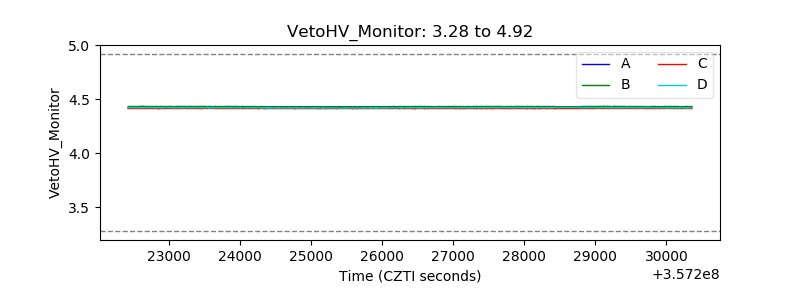 |
| Veto LLD | 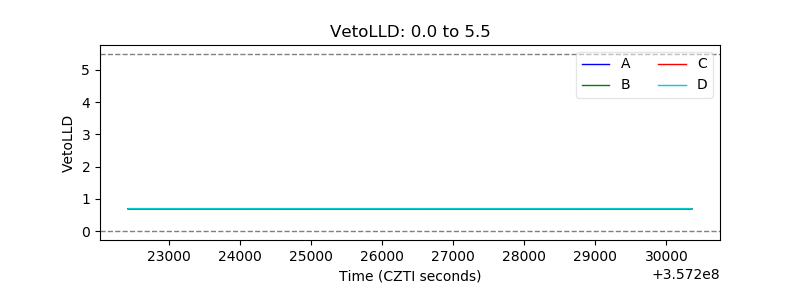 |
| Alpha Counter | 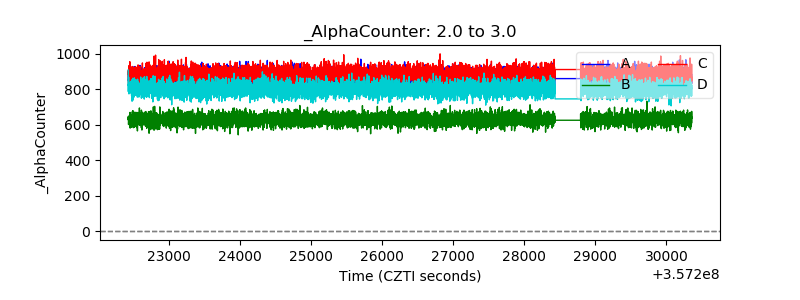 |
| _CPM_Rate | 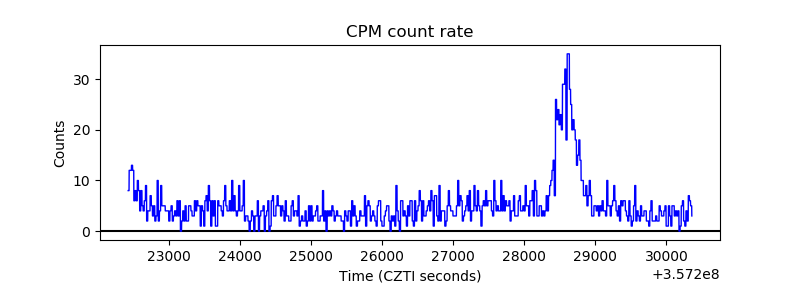 |
| CZT Counter |  |
| +2.5 Volts monitor |  |
| +5 Volts monitor |  |
| _ROLL_ROT | 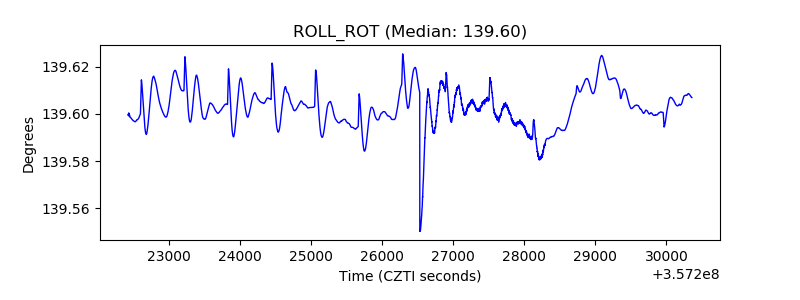 |
| _Roll_DEC | 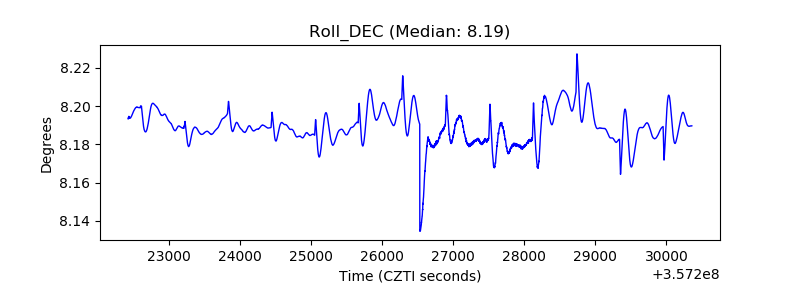 |
| _Roll_RA |  |
| Veto Counter | 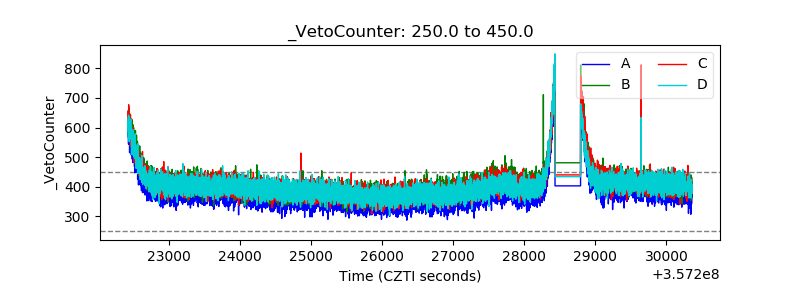 |