| Param | Original file | Final file |
|---|---|---|
| Filename | modeM0/AS1A10_021T06_9000004338_30174cztM0_level2.evt | modeM0/AS1A10_021T06_9000004338_30174cztM0_level2_quad_clean.evt |
| Size (bytes) | 302,037,120 | 57,660,480 |
| Size | 288.0 MB | 55.0 MB |
| Events in quadrant A | 1,839,241 | 383,289 |
| Events in quadrant B | 2,520,999 | 382,975 |
| Events in quadrant C | 2,522,153 | 364,946 |
| Events in quadrant D | 2,027,170 | 367,675 |
| Mode SS | |||
|---|---|---|---|
| Quadrant | BADHDUFLAG | Total packets | Discarded packets |
| A | 0 | 70 | 0 |
| B | 0 | 70 | 0 |
| C | 0 | 70 | 0 |
| D | 0 | 70 | 0 |
| Mode M0 | |||
|---|---|---|---|
| Quadrant | BADHDUFLAG | Total packets | Discarded packets |
| A | 0 | 7789 | 0 |
| B | 0 | 10411 | 0 |
| C | 0 | 9983 | 0 |
| D | 0 | 8275 | 0 |
| Quadrant | Total seconds | Saturated seconds | Saturation percentage |
|---|---|---|---|
| A | 3486 | 44 | 1.262192% |
| B | 3487 | 14 | 0.401491% |
| C | 3487 | 56 | 1.605965% |
| D | 3487 | 57 | 1.634643% |
Noise dominated data is calculated using 1-second bins in cleaned event files. If a bin has >2000 counts, and if more than 50% of those come from <1% of pixels, then it is considered to be noise-dominated and hence unusable.
| Quadrant | # 1 sec bins | Bins with >0 counts | Bins with >2000 counts | High rate bins dominated by noise | Noise dominated (total time) | Noise dominated (detector-on time) | Marked lightcurve |
|---|---|---|---|---|---|---|---|
| A | 3486 | 3486 | 27 | 27 | 0.77% | 0.77% | 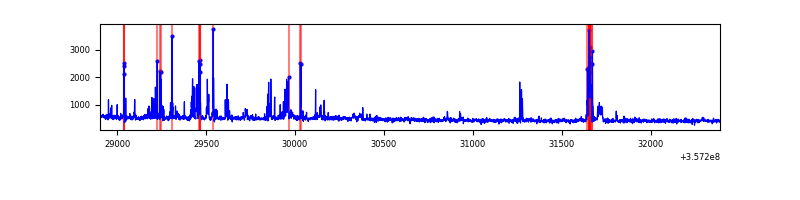 |
| B | 3487 | 3487 | 1 | 1 | 0.03% | 0.03% | 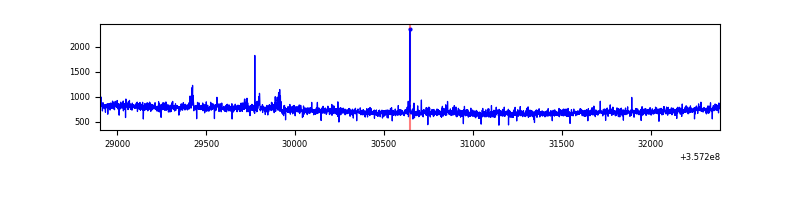 |
| C | 3487 | 3487 | 0 | 0 | 0.00% | 0.00% | 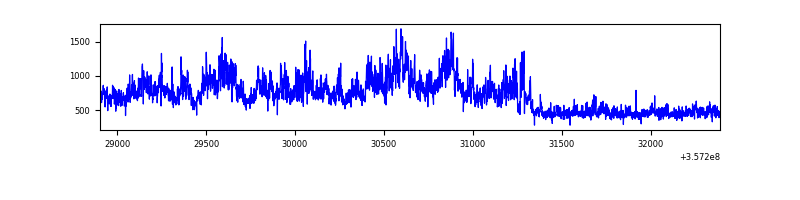 |
| D | 3487 | 3487 | 54 | 54 | 1.55% | 1.55% | 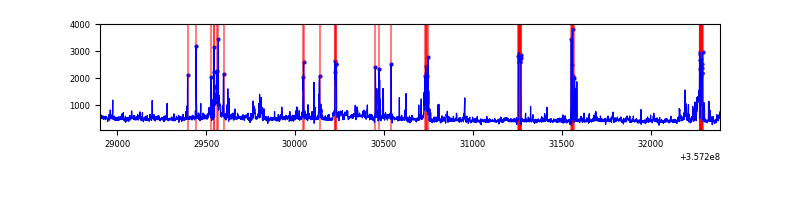 |
Top three noisy pixels from each quadrant. If the there are fewer than three noisy pixels in the level2.evt file, extra rows are filled as -1
| Pixel properties | Quadrant properties | ||||||
|---|---|---|---|---|---|---|---|
| Quadrant | DetID | PixID | Counts | Sigma | Mean | Median | Sigma |
| A | 0 | 13 | 257486 | 3052.8 | 410 | 400 | 84.2 |
| A | 13 | 254 | 5777 | 63.85 | 410 | 400 | 84.2 |
| A | 3 | 137 | 4215 | 45.3 | 410 | 400 | 84.2 |
| B | 6 | 159 | 915330 | 11527.27 | 402 | 391 | 79.4 |
| B | 0 | 190 | 21765 | 269.29 | 402 | 391 | 79.4 |
| B | 12 | 111 | 9547 | 115.36 | 402 | 391 | 79.4 |
| C | 3 | 233 | 899539 | 9574.2 | 392 | 394 | 93.9 |
| C | 14 | 238 | 63302 | 669.85 | 392 | 394 | 93.9 |
| C | 15 | 208 | 18959 | 197.68 | 392 | 394 | 93.9 |
| D | 1 | 52 | 345649 | 3541.11 | 398 | 389 | 97.5 |
| D | 8 | 195 | 80145 | 818.01 | 398 | 389 | 97.5 |
| D | 2 | 120 | 37493 | 380.55 | 398 | 389 | 97.5 |
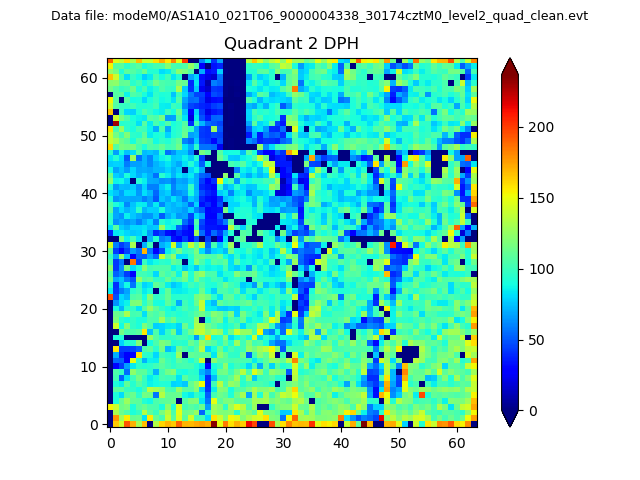
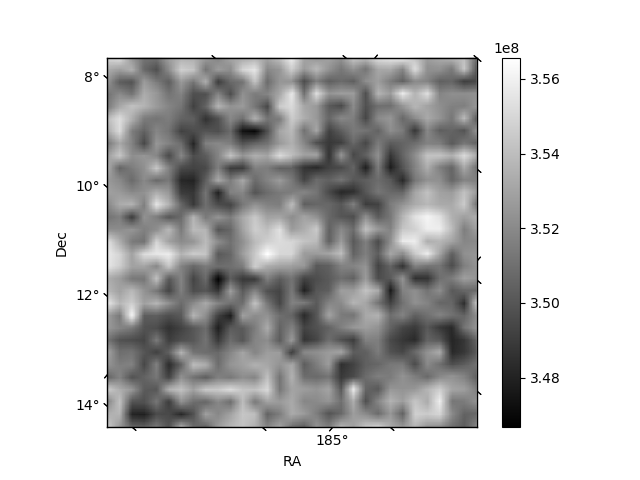
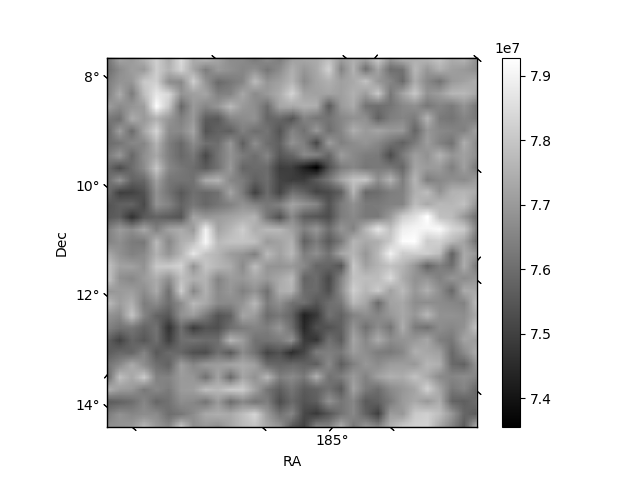
Histogram calculated using DETX and DETY for each event in the final _common_clean file
| Quadrant A | 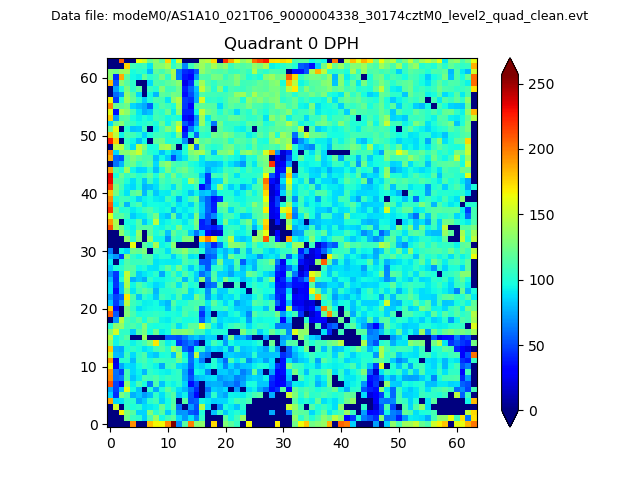 |
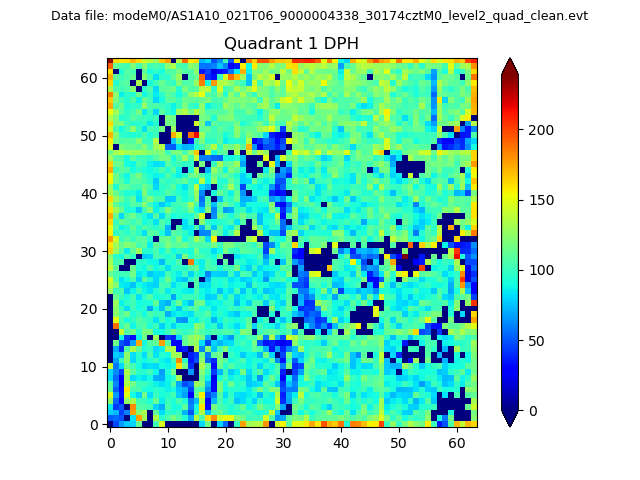 |
Quadrant B |
|---|---|---|---|
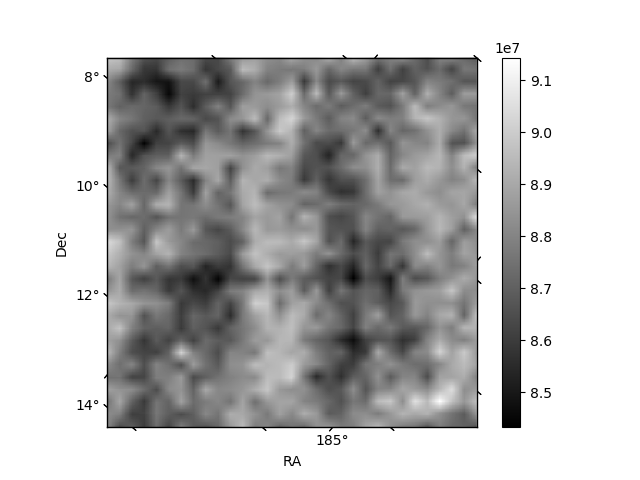
| Quadrant D | 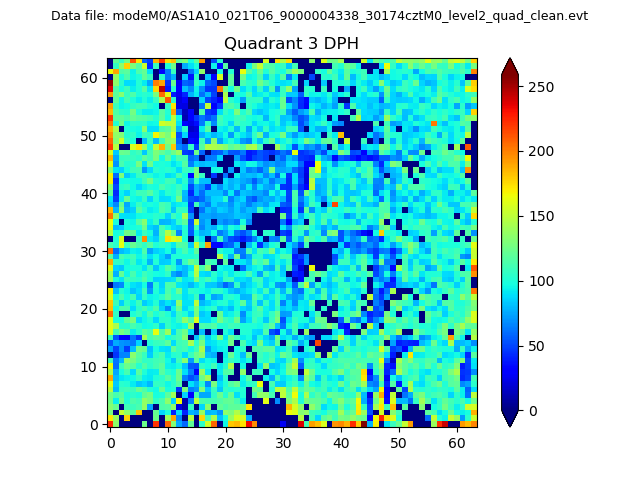 |
 |
Quadrant C |
| Plot type | Count rate plots | Images |
|---|---|---|
| Comparison with Poisson distribution Blue bars denote a histogram of data divided into 1 sec bins. Red curve is a Poisson curve with rate = median count rate of data. |
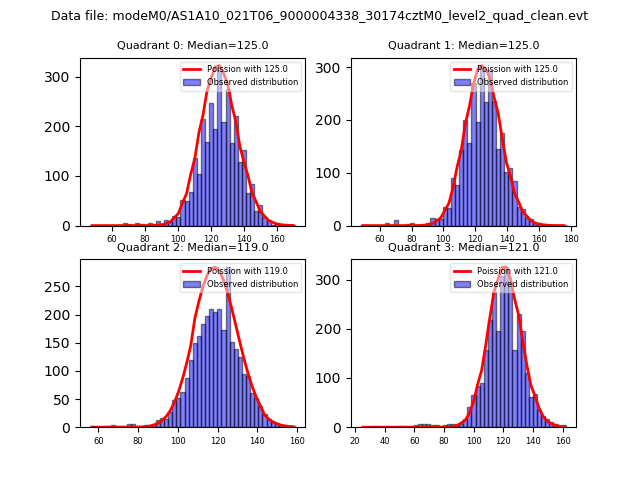 |
 |
| Quadrant-wise count rates Data is divided into 100 sec bins |
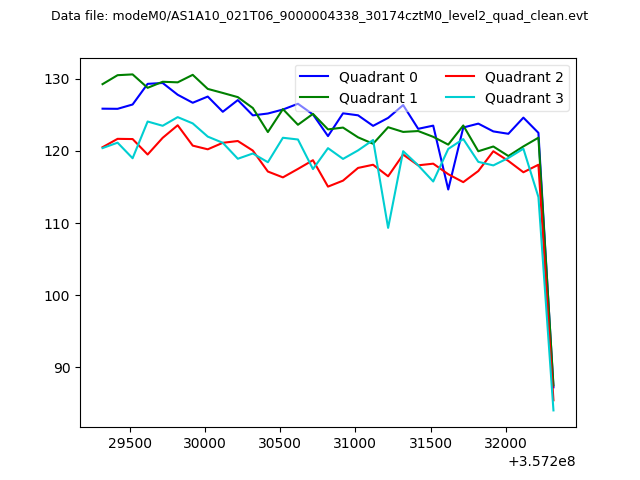 |
|
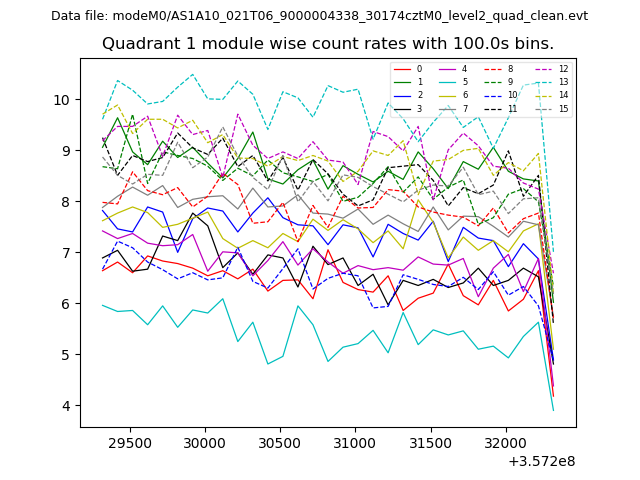
| Module-wise count rates for Quadrant A Data is divided into 100 sec bins |
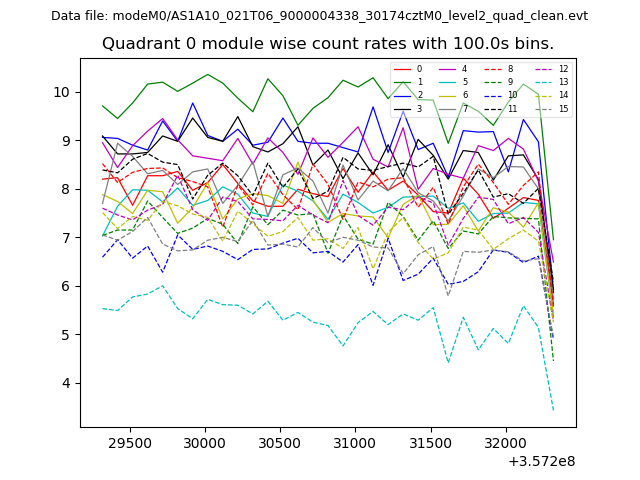 |
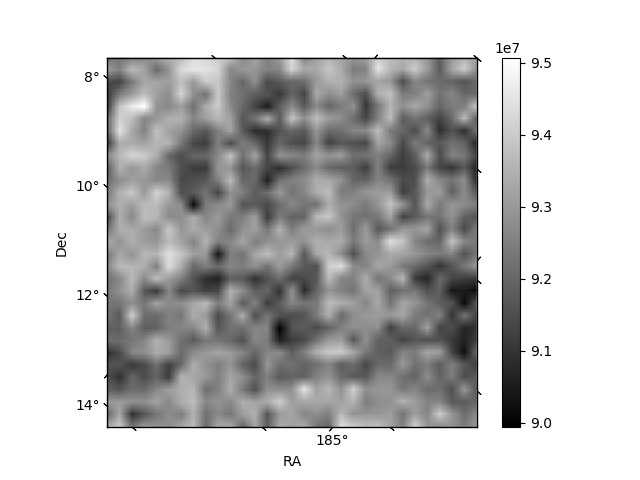 |
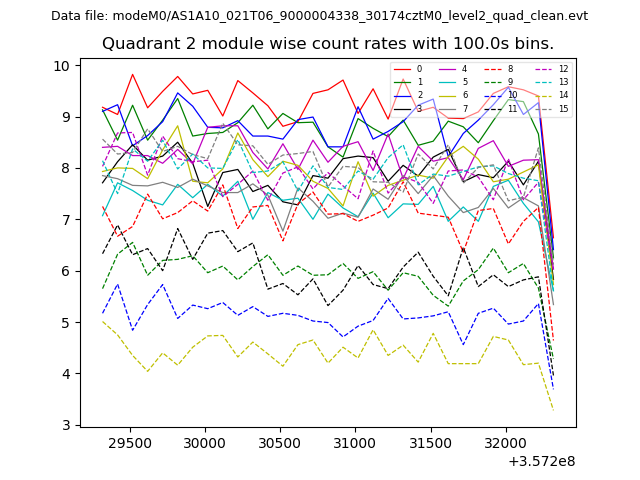
| Module-wise count rates for Quadrant B Data is divided into 100 sec bins |
 |
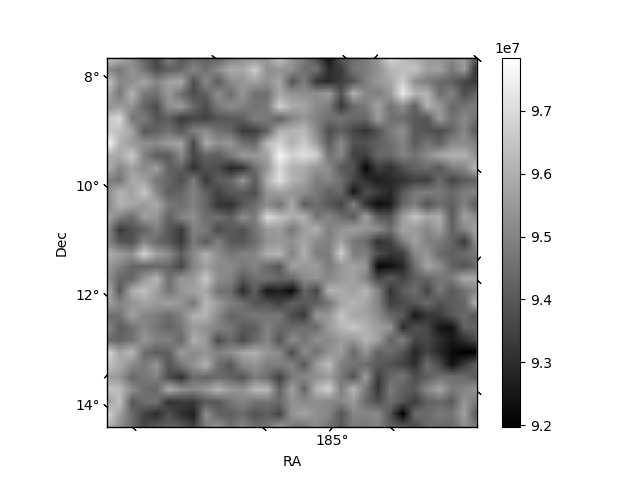 |
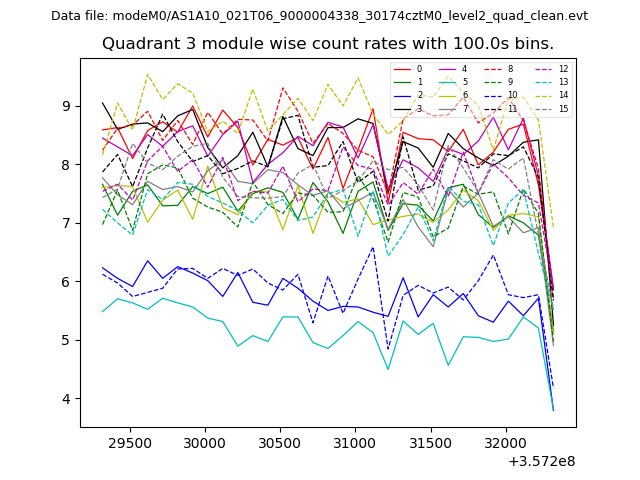
| Module-wise count rates for Quadrant C Data is divided into 100 sec bins |
 |
 |
| Module-wise count rates for Quadrant D Data is divided into 100 sec bins |
 |
 |
| Parameter | Plot |
|---|---|
| CZT HV Monitor | 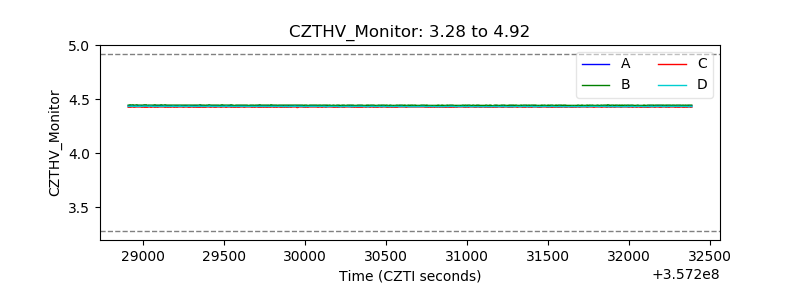 |
| D_VDD | 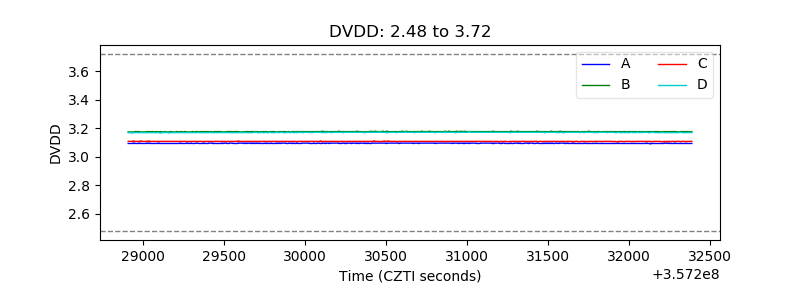 |
| Temperature 1 | 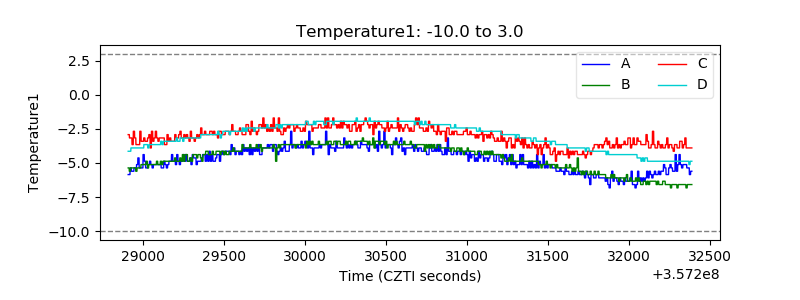 |
| Veto HV Monitor | 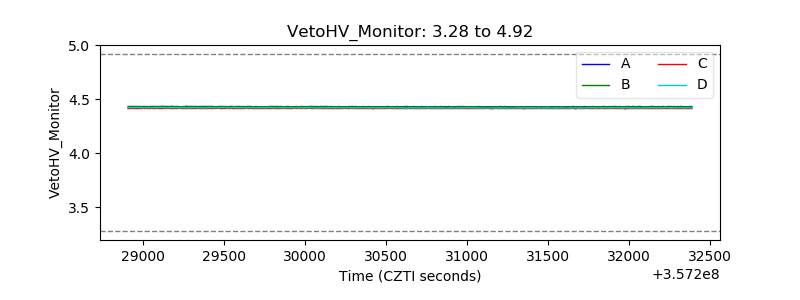 |
| Veto LLD | 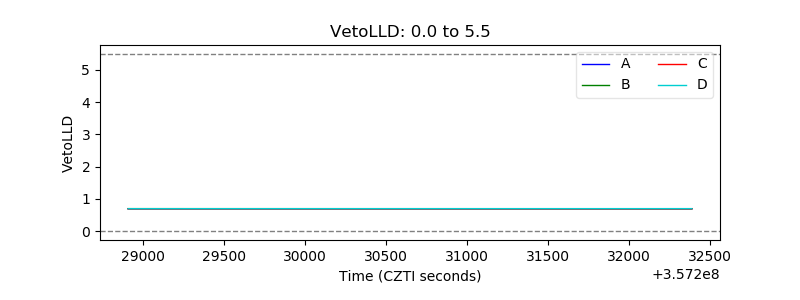 |
| Alpha Counter | 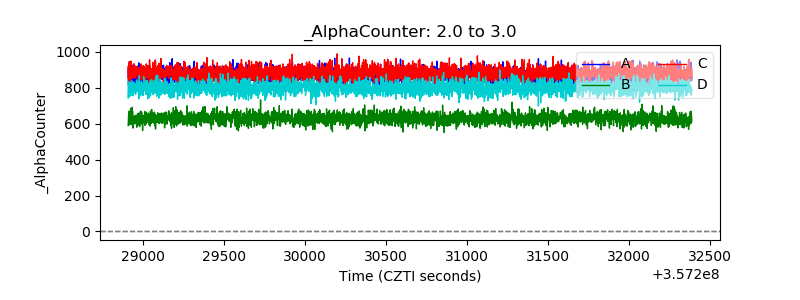 |
| _CPM_Rate | 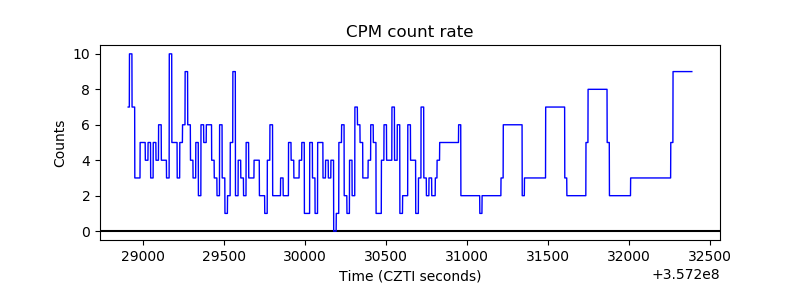 |
| CZT Counter | 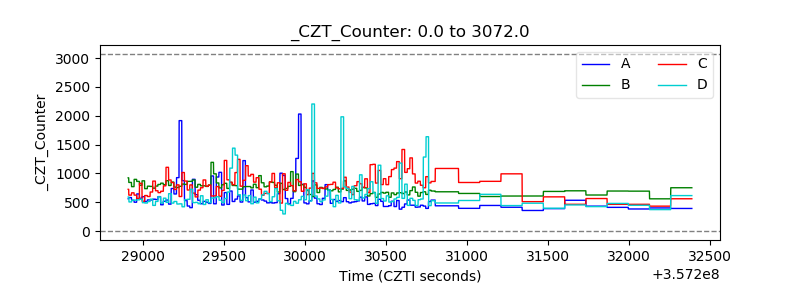 |
| +2.5 Volts monitor | 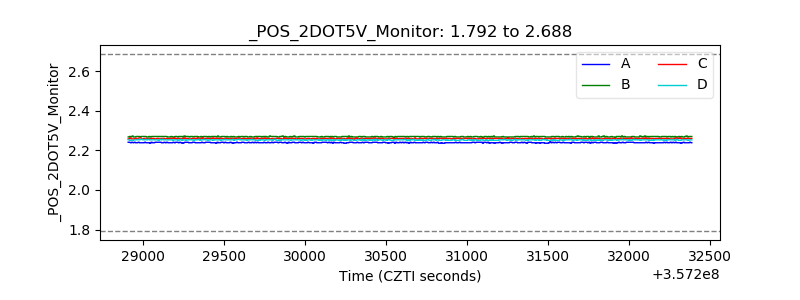 |
| +5 Volts monitor |  |
| _ROLL_ROT | 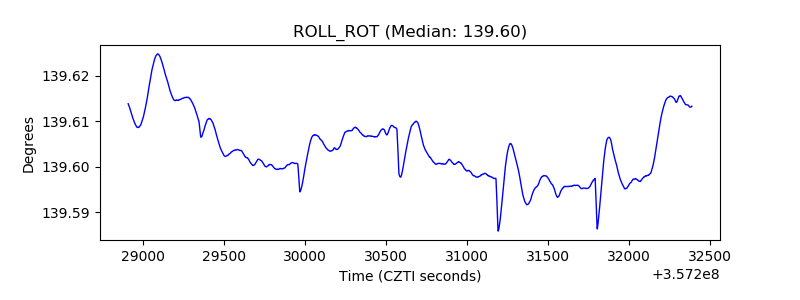 |
| _Roll_DEC | 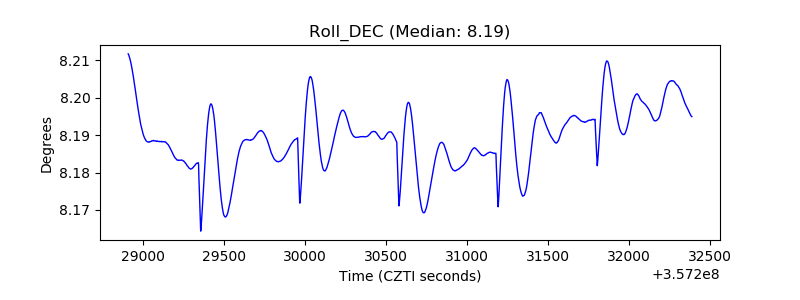 |
| _Roll_RA | 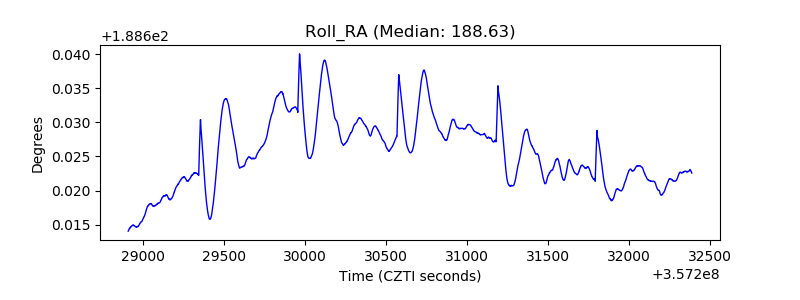 |
| Veto Counter | 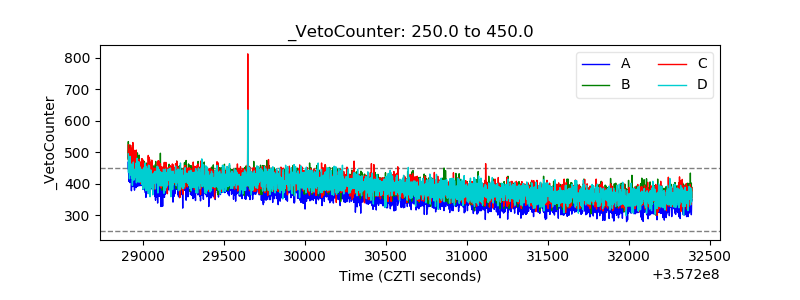 |