| Param | Original file | Final file |
|---|---|---|
| Filename | modeM0/AS1A10_102T01_9000004340_30174cztM0_level2.evt | modeM0/AS1A10_102T01_9000004340_30174cztM0_level2_quad_clean.evt |
| Size (bytes) | 858,594,240 | 105,160,320 |
| Size | 818.8 MB | 100.3 MB |
| Events in quadrant A | 4,886,355 | 665,796 |
| Events in quadrant B | 6,716,719 | 665,718 |
| Events in quadrant C | 7,664,525 | 624,223 |
| Events in quadrant D | 6,137,190 | 613,394 |
| Mode SS | |||
|---|---|---|---|
| Quadrant | BADHDUFLAG | Total packets | Discarded packets |
| A | 0 | 184 | 0 |
| B | 0 | 184 | 0 |
| C | 0 | 184 | 0 |
| D | 0 | 184 | 0 |
| Mode M9 | |||
|---|---|---|---|
| Quadrant | BADHDUFLAG | Total packets | Discarded packets |
| A | 0 | 12 | 0 |
| B | 0 | 12 | 0 |
| C | 0 | 12 | 0 |
| D | 0 | 12 | 0 |
| Mode M0 | |||
|---|---|---|---|
| Quadrant | BADHDUFLAG | Total packets | Discarded packets |
| A | 0 | 20113 | 2 |
| B | 0 | 26762 | 2 |
| C | 0 | 28910 | 2 |
| D | 0 | 24167 | 2 |
| Quadrant | Total seconds | Saturated seconds | Saturation percentage |
|---|---|---|---|
| A | 8855 | 203 | 2.292490% |
| B | 8855 | 226 | 2.552230% |
| C | 8855 | 684 | 7.724449% |
| D | 8855 | 601 | 6.787126% |
Noise dominated data is calculated using 1-second bins in cleaned event files. If a bin has >2000 counts, and if more than 50% of those come from <1% of pixels, then it is considered to be noise-dominated and hence unusable.
| Quadrant | # 1 sec bins | Bins with >0 counts | Bins with >2000 counts | High rate bins dominated by noise | Noise dominated (total time) | Noise dominated (detector-on time) | Marked lightcurve |
|---|---|---|---|---|---|---|---|
| A | 10165 | 8855 | 64 | 64 | 0.63% | 0.72% | 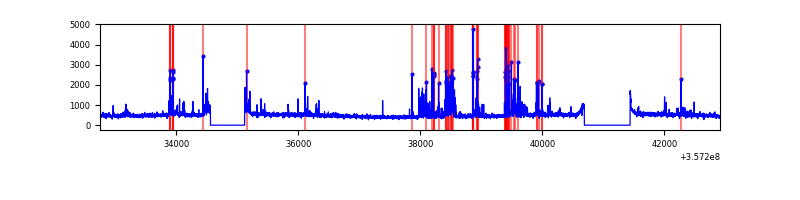 |
| B | 10165 | 8855 | 1 | 1 | 0.01% | 0.01% | 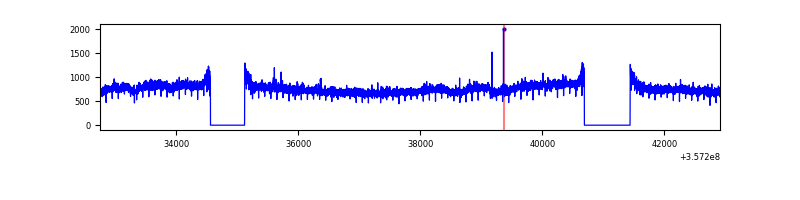 |
| C | 10165 | 8856 | 44 | 44 | 0.43% | 0.50% | 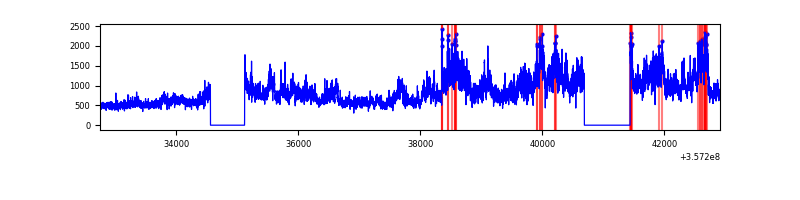 |
| D | 10165 | 8855 | 444 | 444 | 4.37% | 5.01% | 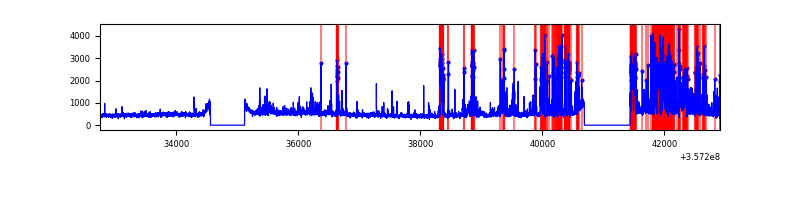 |
Top three noisy pixels from each quadrant. If the there are fewer than three noisy pixels in the level2.evt file, extra rows are filled as -1
| Pixel properties | Quadrant properties | ||||||
|---|---|---|---|---|---|---|---|
| Quadrant | DetID | PixID | Counts | Sigma | Mean | Median | Sigma |
| A | 0 | 13 | 620755 | 2789.68 | 1100 | 1074 | 222.1 |
| A | 8 | 192 | 22121 | 94.75 | 1100 | 1074 | 222.1 |
| A | 13 | 254 | 14187 | 59.03 | 1100 | 1074 | 222.1 |
| B | 6 | 159 | 2437562 | 11494.81 | 1085 | 1054 | 212.0 |
| B | 12 | 111 | 27072 | 122.75 | 1085 | 1054 | 212.0 |
| B | 11 | 111 | 25224 | 114.03 | 1085 | 1054 | 212.0 |
| C | 3 | 233 | 3329876 | 13471.62 | 1043 | 1048 | 247.1 |
| C | 14 | 238 | 187095 | 752.92 | 1043 | 1048 | 247.1 |
| C | 15 | 208 | 33048 | 129.5 | 1043 | 1048 | 247.1 |
| D | 1 | 52 | 1991490 | 7954.59 | 1042 | 1017 | 250.2 |
| D | 8 | 195 | 162308 | 644.57 | 1042 | 1017 | 250.2 |
| D | 2 | 234 | 35435 | 137.55 | 1042 | 1017 | 250.2 |
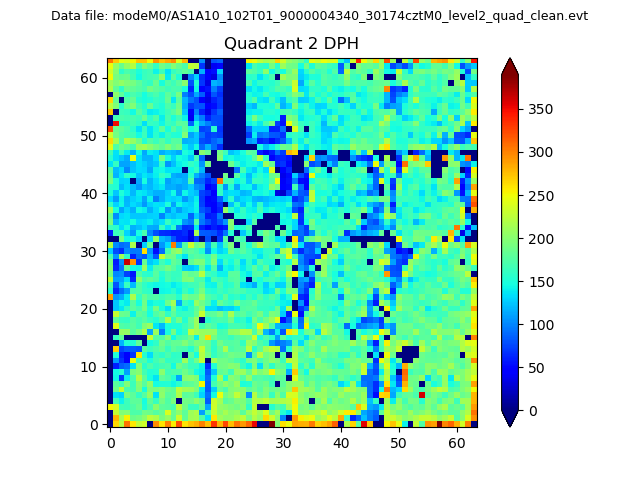
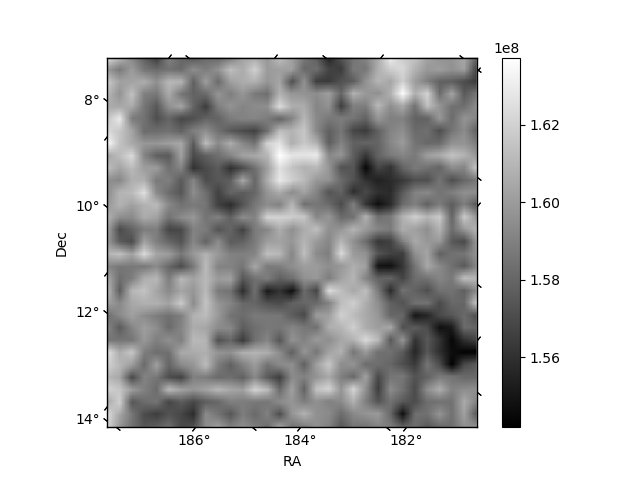
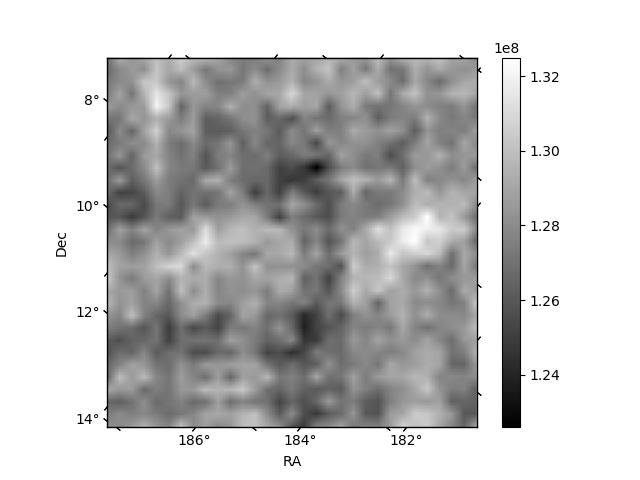
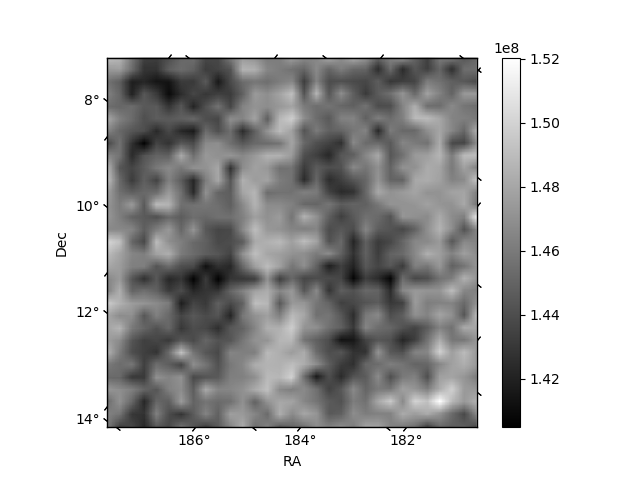
Histogram calculated using DETX and DETY for each event in the final _common_clean file
| Quadrant A | 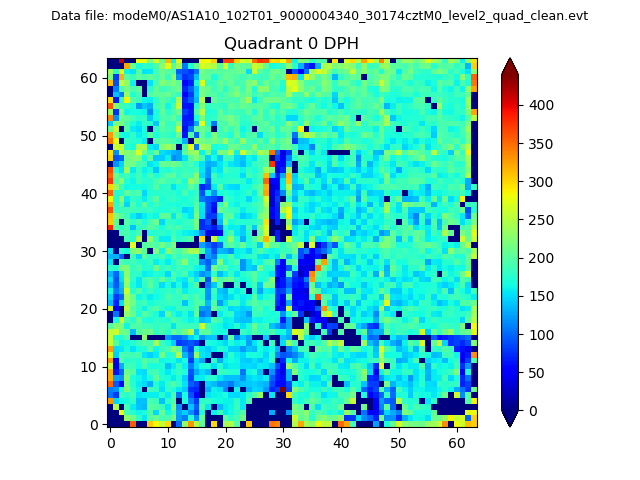 |
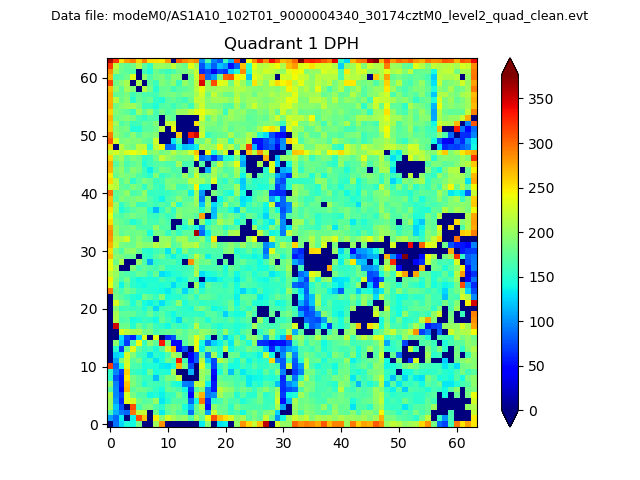 |
Quadrant B |
|---|---|---|---|
| Quadrant D | 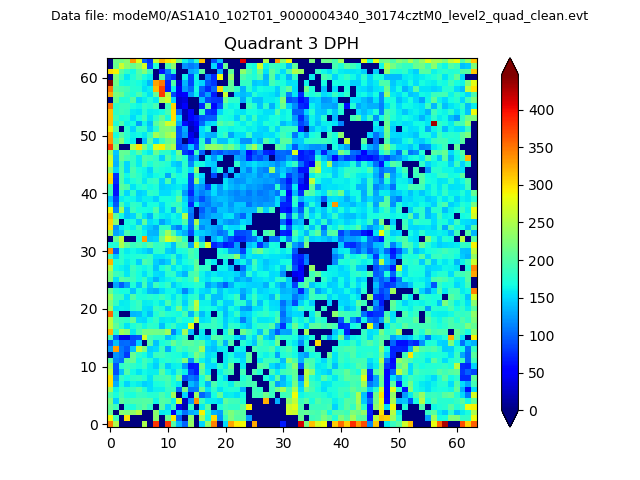 |
 |
Quadrant C |
| Plot type | Count rate plots | Images |
|---|---|---|
| Comparison with Poisson distribution Blue bars denote a histogram of data divided into 1 sec bins. Red curve is a Poisson curve with rate = median count rate of data. |
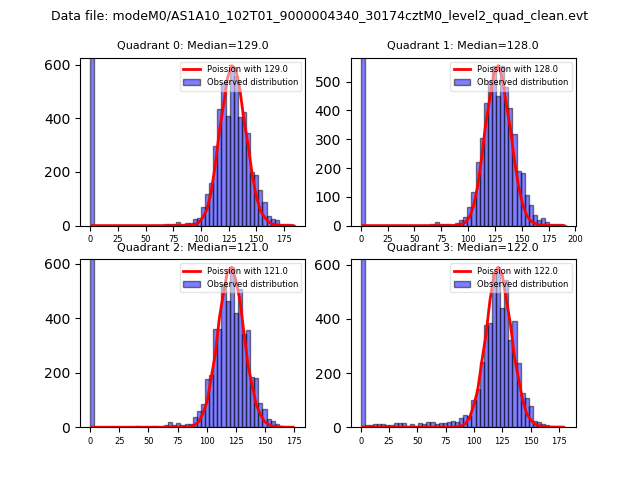 |
 |
| Quadrant-wise count rates Data is divided into 100 sec bins |
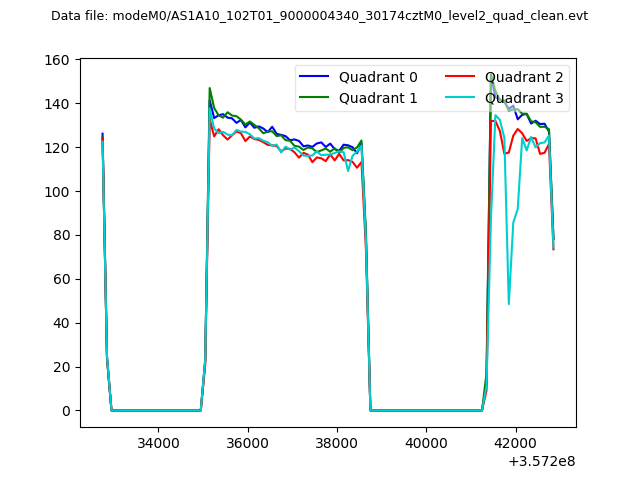 |
|
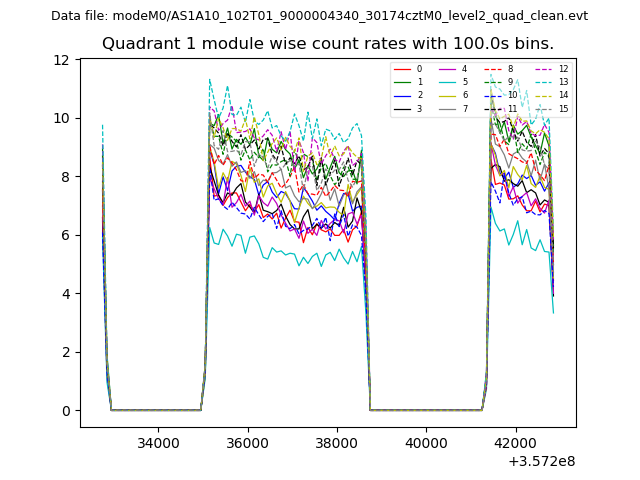
| Module-wise count rates for Quadrant A Data is divided into 100 sec bins |
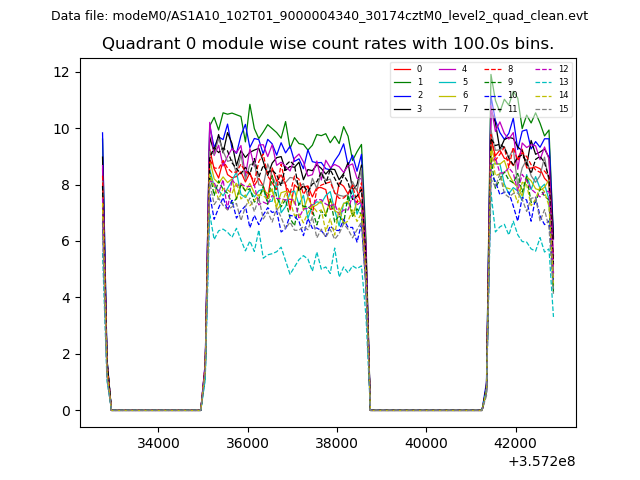 |
 |
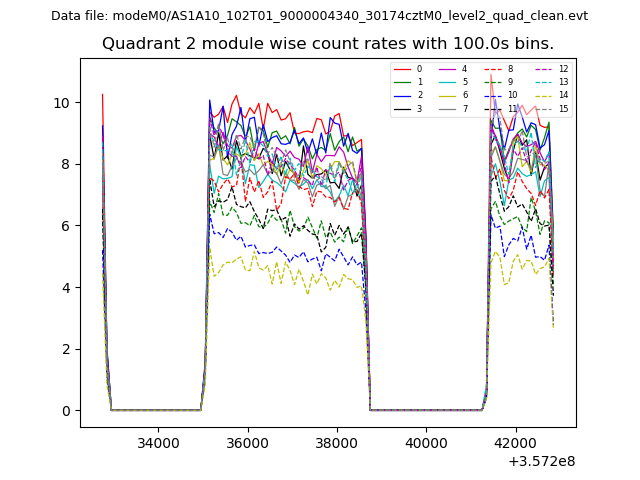
| Module-wise count rates for Quadrant B Data is divided into 100 sec bins |
 |
 |
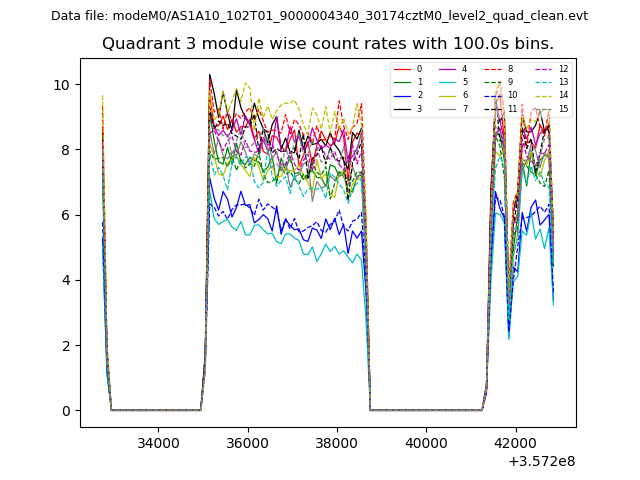
| Module-wise count rates for Quadrant C Data is divided into 100 sec bins |
 |
 |
| Module-wise count rates for Quadrant D Data is divided into 100 sec bins |
 |
 |
| Parameter | Plot |
|---|---|
| CZT HV Monitor | 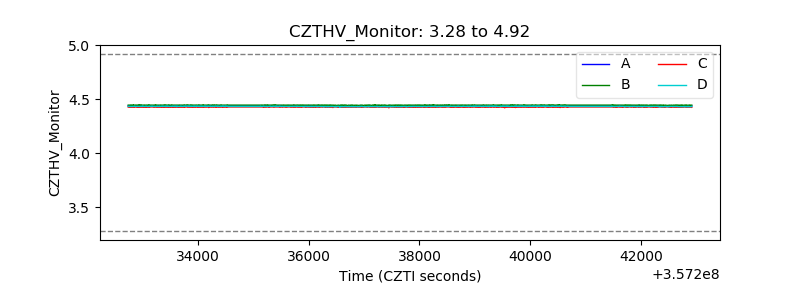 |
| D_VDD | 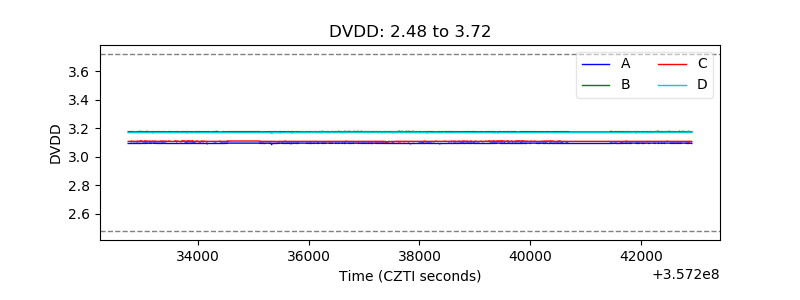 |
| Temperature 1 | 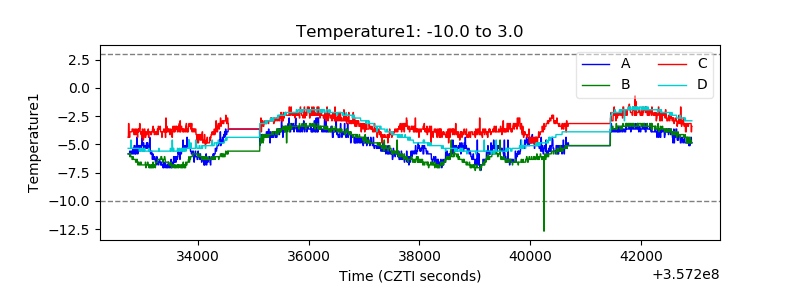 |
| Veto HV Monitor | 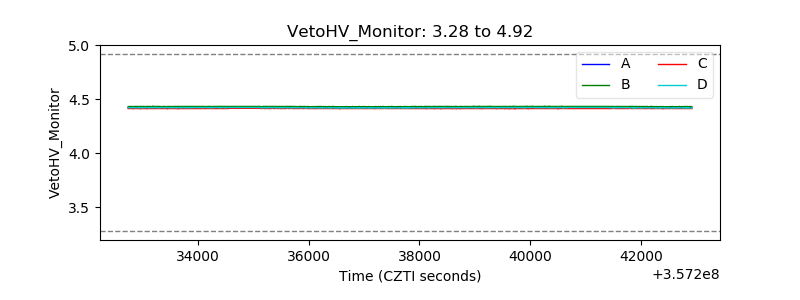 |
| Veto LLD | 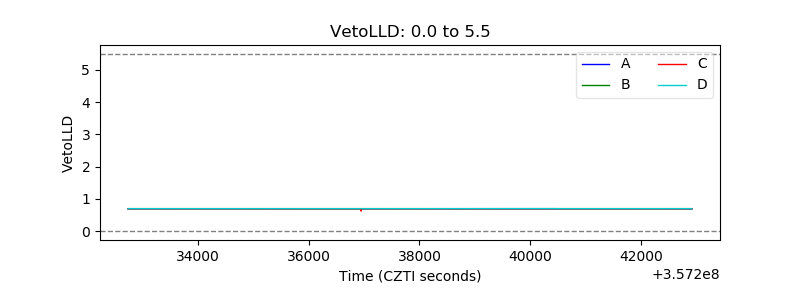 |
| Alpha Counter | 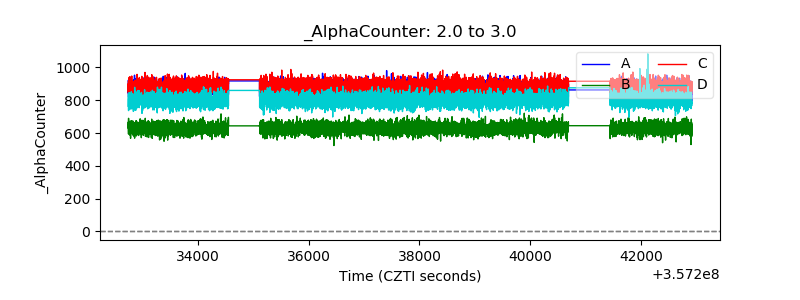 |
| _CPM_Rate | 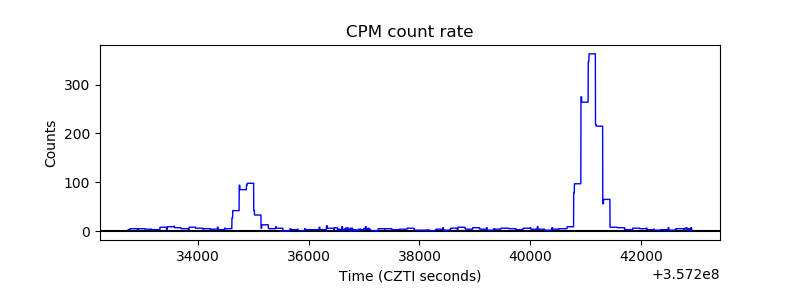 |
| CZT Counter |  |
| +2.5 Volts monitor |  |
| +5 Volts monitor |  |
| _ROLL_ROT | 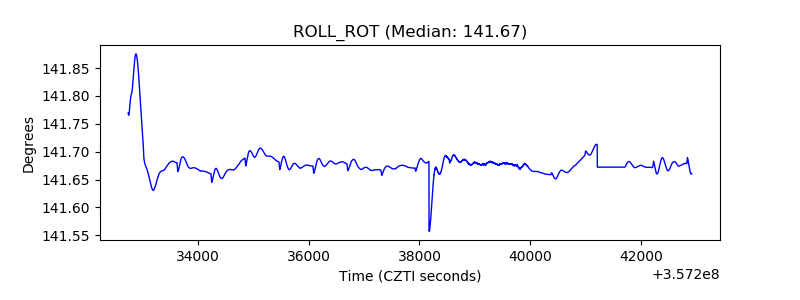 |
| _Roll_DEC |  |
| _Roll_RA | 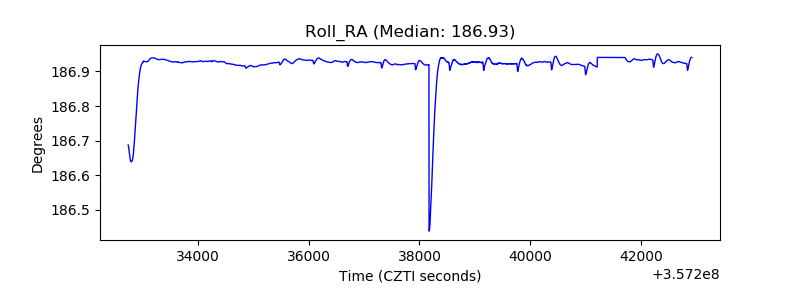 |
| Veto Counter | 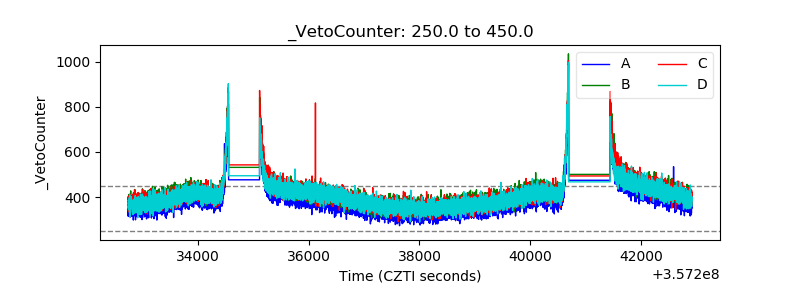 |