| Param | Original file | Final file |
|---|---|---|
| Filename | modeM0/AS1A10_102T01_9000004340_30175cztM0_level2.evt | modeM0/AS1A10_102T01_9000004340_30175cztM0_level2_quad_clean.evt |
| Size (bytes) | 655,980,480 | 88,369,920 |
| Size | 625.6 MB | 84.3 MB |
| Events in quadrant A | 3,229,883 | 575,787 |
| Events in quadrant B | 4,919,780 | 575,057 |
| Events in quadrant C | 6,502,063 | 536,780 |
| Events in quadrant D | 4,767,877 | 526,667 |
| Mode SS | |||
|---|---|---|---|
| Quadrant | BADHDUFLAG | Total packets | Discarded packets |
| A | 0 | 134 | 0 |
| B | 0 | 134 | 0 |
| C | 0 | 134 | 0 |
| D | 0 | 134 | 0 |
| Mode M9 | |||
|---|---|---|---|
| Quadrant | BADHDUFLAG | Total packets | Discarded packets |
| A | 0 | 10 | 0 |
| B | 0 | 10 | 0 |
| C | 0 | 10 | 0 |
| D | 0 | 10 | 0 |
| Mode M0 | |||
|---|---|---|---|
| Quadrant | BADHDUFLAG | Total packets | Discarded packets |
| A | 0 | 13890 | 1 |
| B | 0 | 19910 | 1 |
| C | 0 | 24101 | 1 |
| D | 0 | 18701 | 1 |
| Quadrant | Total seconds | Saturated seconds | Saturation percentage |
|---|---|---|---|
| A | 6622 | 55 | 0.830565% |
| B | 6621 | 96 | 1.449932% |
| C | 6621 | 439 | 6.630418% |
| D | 6622 | 434 | 6.553911% |
Noise dominated data is calculated using 1-second bins in cleaned event files. If a bin has >2000 counts, and if more than 50% of those come from <1% of pixels, then it is considered to be noise-dominated and hence unusable.
| Quadrant | # 1 sec bins | Bins with >0 counts | Bins with >2000 counts | High rate bins dominated by noise | Noise dominated (total time) | Noise dominated (detector-on time) | Marked lightcurve |
|---|---|---|---|---|---|---|---|
| A | 7557 | 6622 | 1 | 1 | 0.01% | 0.02% | 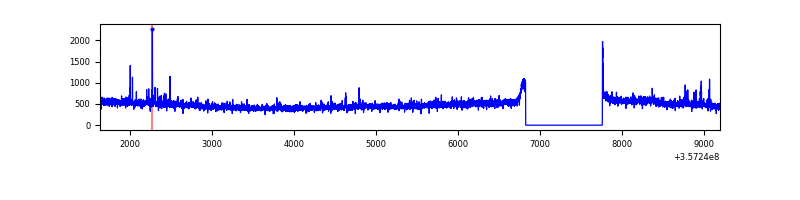 |
| B | 7556 | 6621 | 0 | 0 | 0.00% | 0.00% | 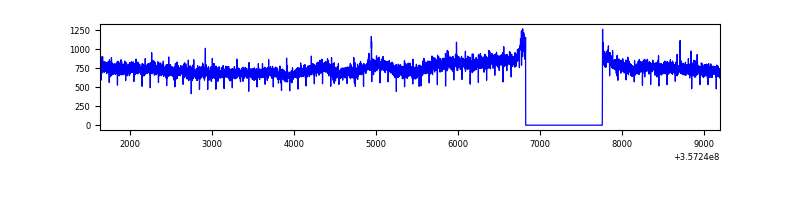 |
| C | 7556 | 6621 | 52 | 52 | 0.69% | 0.79% | 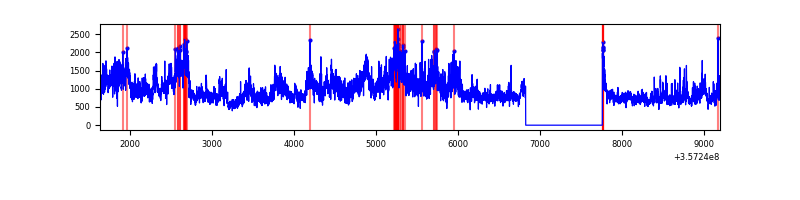 |
| D | 7557 | 6622 | 334 | 334 | 4.42% | 5.04% | 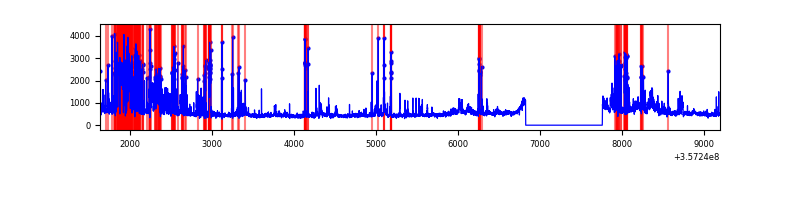 |
Top three noisy pixels from each quadrant. If the there are fewer than three noisy pixels in the level2.evt file, extra rows are filled as -1
| Pixel properties | Quadrant properties | ||||||
|---|---|---|---|---|---|---|---|
| Quadrant | DetID | PixID | Counts | Sigma | Mean | Median | Sigma |
| A | 0 | 13 | 74320 | 449.78 | 813 | 796 | 163.5 |
| A | 8 | 192 | 13034 | 74.87 | 813 | 796 | 163.5 |
| A | 13 | 254 | 11187 | 63.57 | 813 | 796 | 163.5 |
| B | 6 | 159 | 1778343 | 11387.9 | 800 | 777 | 156.1 |
| B | 12 | 111 | 19506 | 119.99 | 800 | 777 | 156.1 |
| B | 11 | 111 | 17971 | 110.15 | 800 | 777 | 156.1 |
| C | 3 | 233 | 3308706 | 18048.5 | 767 | 772 | 183.3 |
| C | 14 | 238 | 141867 | 769.83 | 767 | 772 | 183.3 |
| C | 14 | 254 | 29349 | 155.92 | 767 | 772 | 183.3 |
| D | 1 | 52 | 1512607 | 7997.93 | 766 | 748 | 189.0 |
| D | 13 | 104 | 155748 | 819.97 | 766 | 748 | 189.0 |
| D | 8 | 195 | 141927 | 746.85 | 766 | 748 | 189.0 |
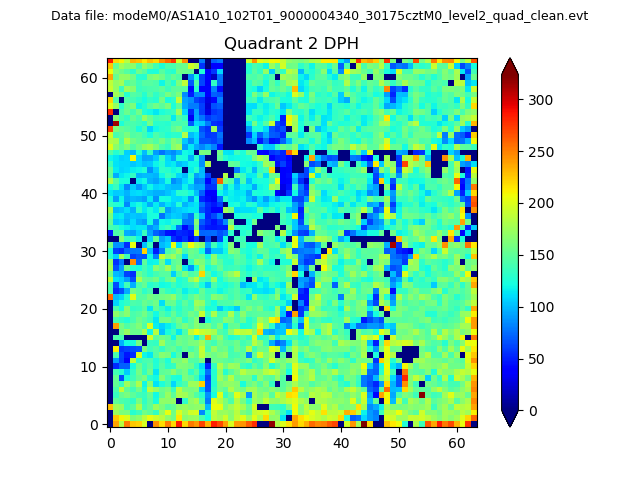
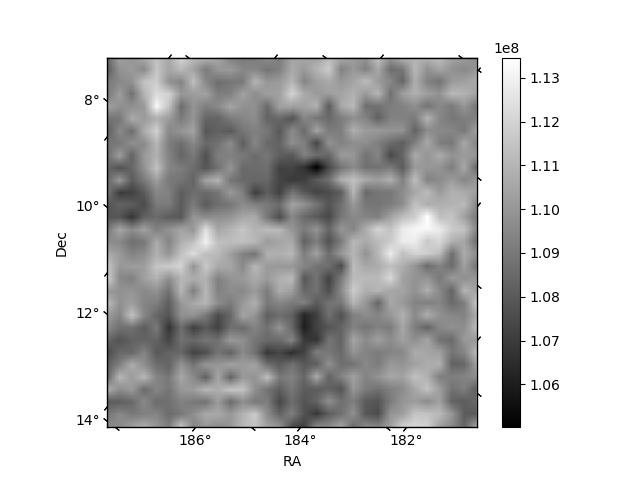
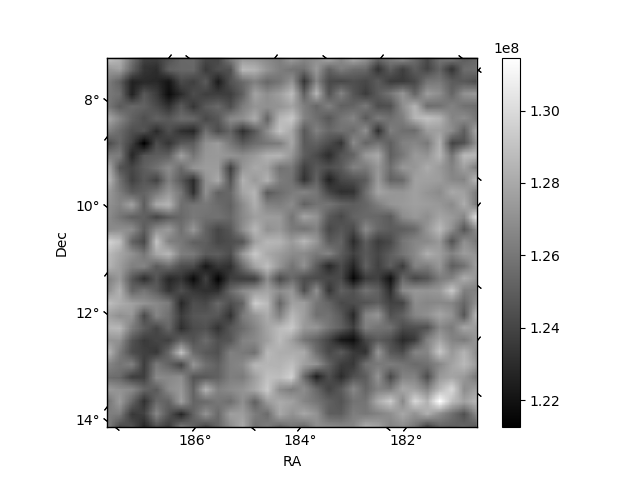
Histogram calculated using DETX and DETY for each event in the final _common_clean file
| Quadrant A | 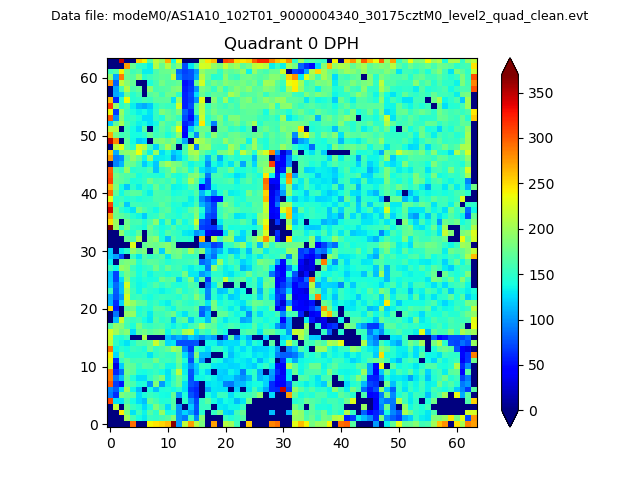 |
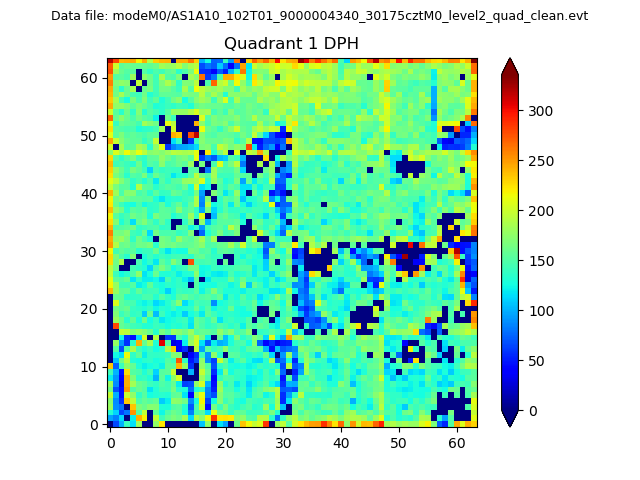 |
Quadrant B |
|---|---|---|---|
| Quadrant D | 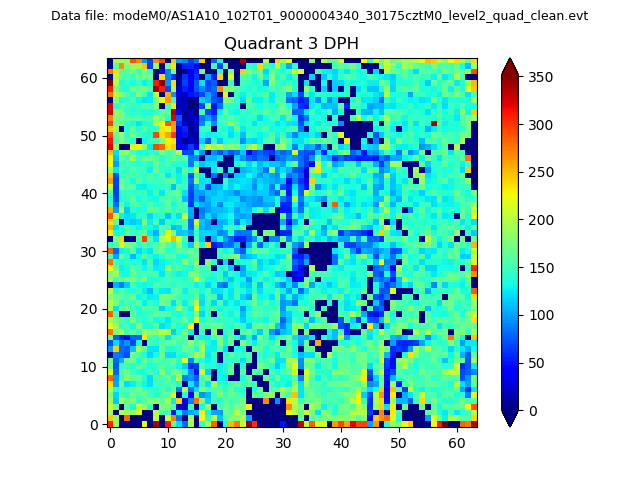 |
 |
Quadrant C |
| Plot type | Count rate plots | Images |
|---|---|---|
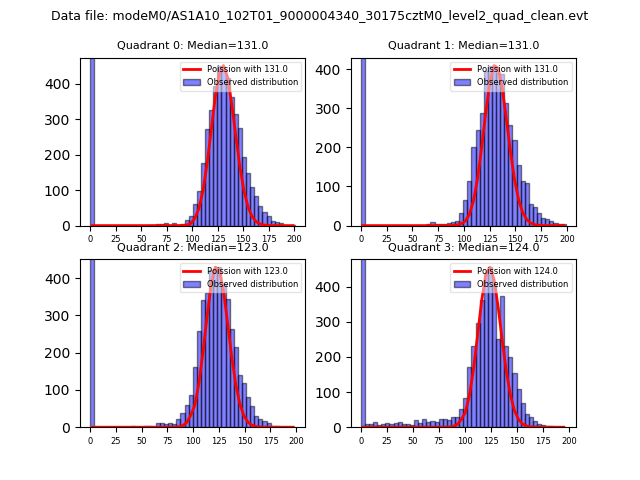
| Comparison with Poisson distribution Blue bars denote a histogram of data divided into 1 sec bins. Red curve is a Poisson curve with rate = median count rate of data. |
 |
 |
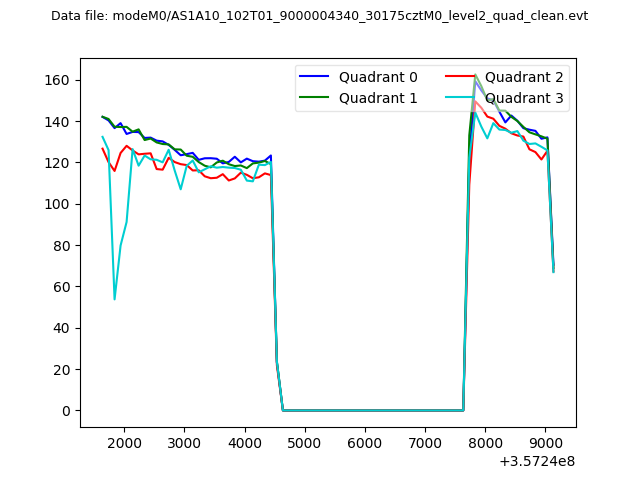
| Quadrant-wise count rates Data is divided into 100 sec bins |
 |
|
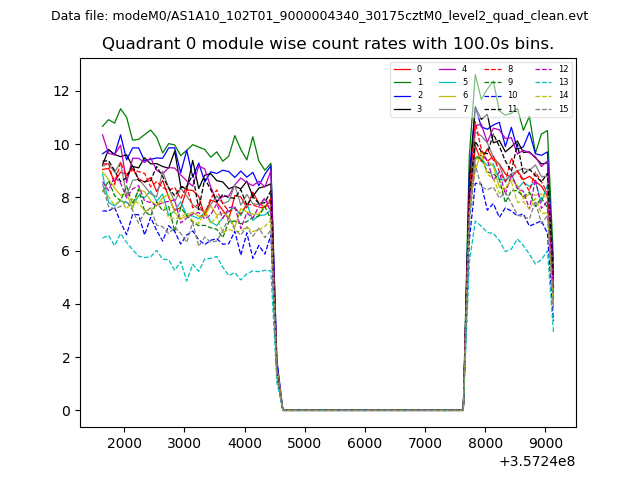
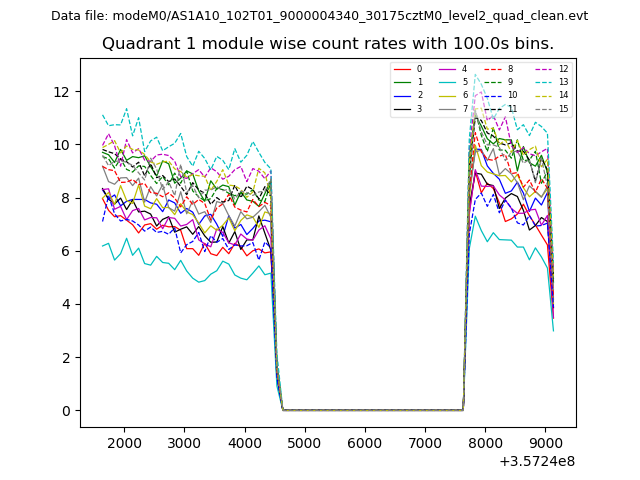
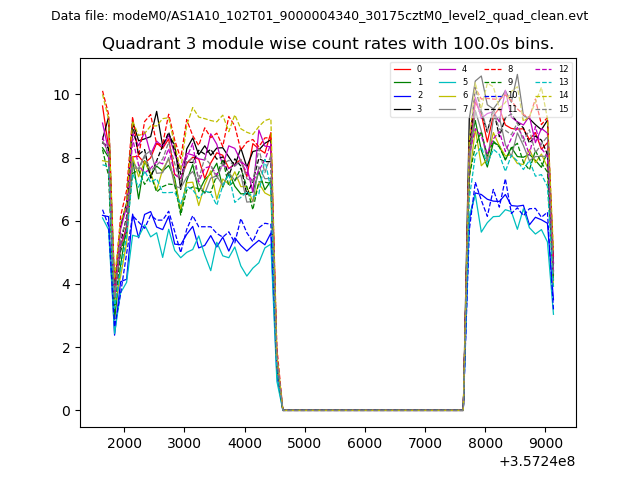
| Module-wise count rates for Quadrant A Data is divided into 100 sec bins |
 |
 |
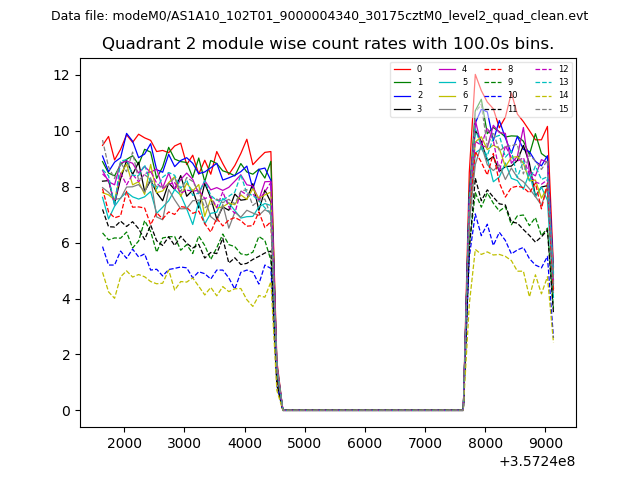
| Module-wise count rates for Quadrant B Data is divided into 100 sec bins |
 |
 |
| Module-wise count rates for Quadrant C Data is divided into 100 sec bins |
 |
 |
| Module-wise count rates for Quadrant D Data is divided into 100 sec bins |
 |
 |
| Parameter | Plot |
|---|---|
| CZT HV Monitor | 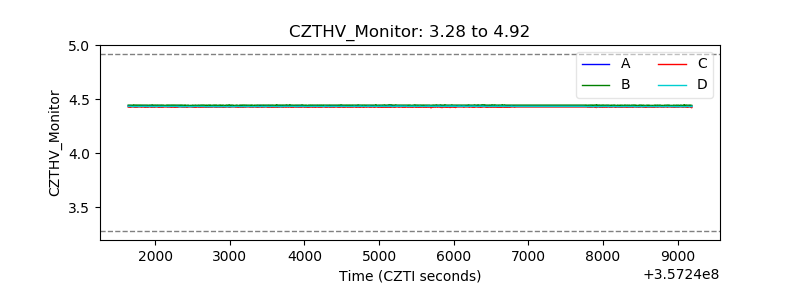 |
| D_VDD | 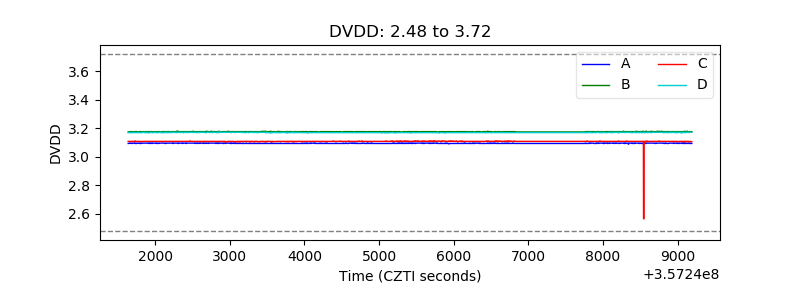 |
| Temperature 1 | 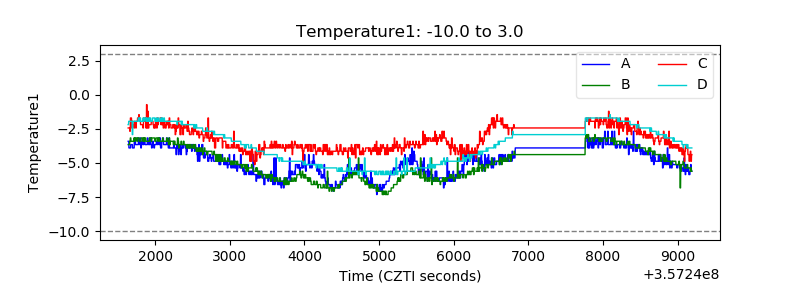 |
| Veto HV Monitor | 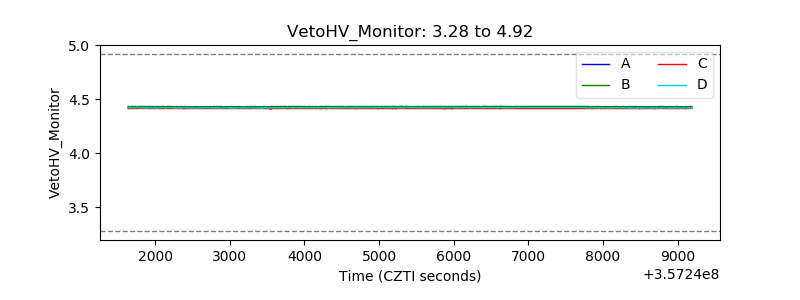 |
| Veto LLD | 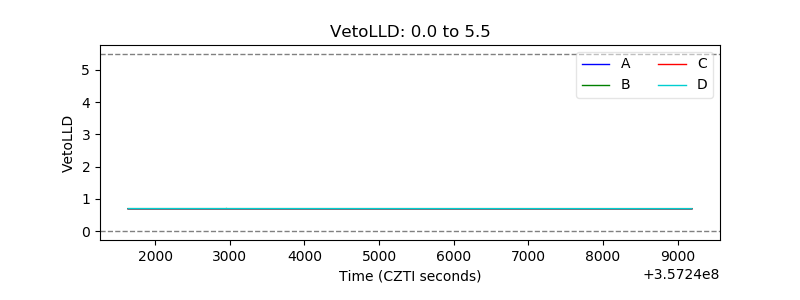 |
| Alpha Counter | 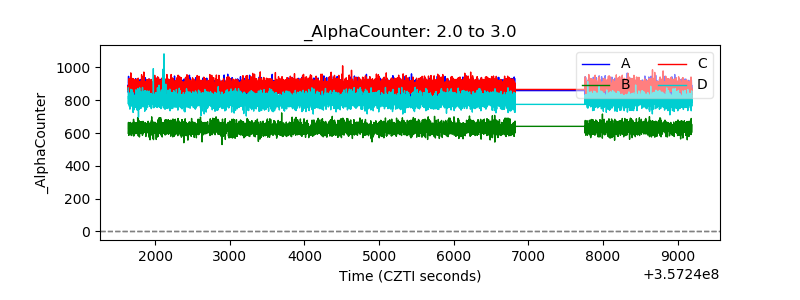 |
| _CPM_Rate | 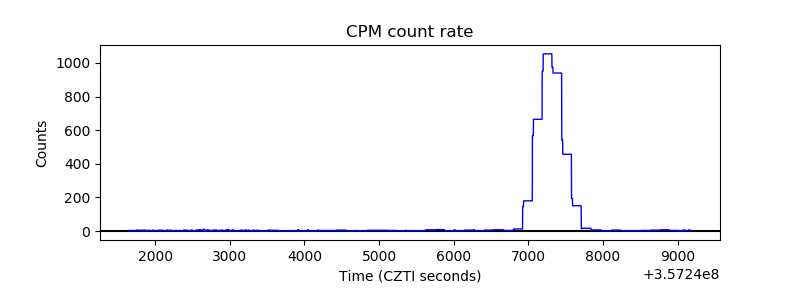 |
| CZT Counter | 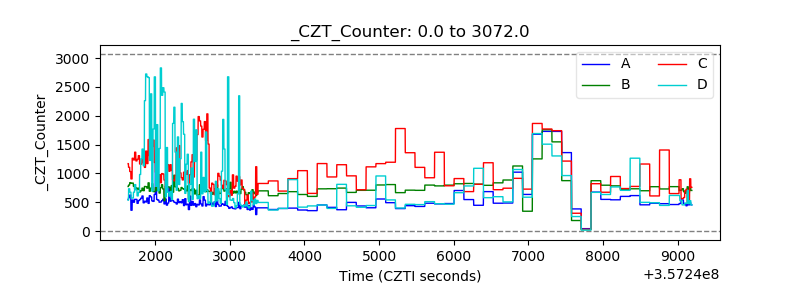 |
| +2.5 Volts monitor |  |
| +5 Volts monitor | 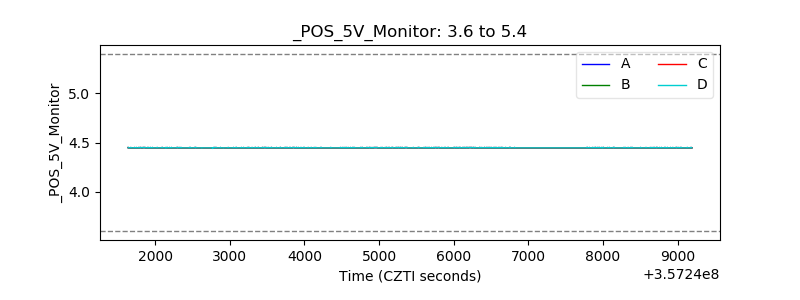 |
| _ROLL_ROT | 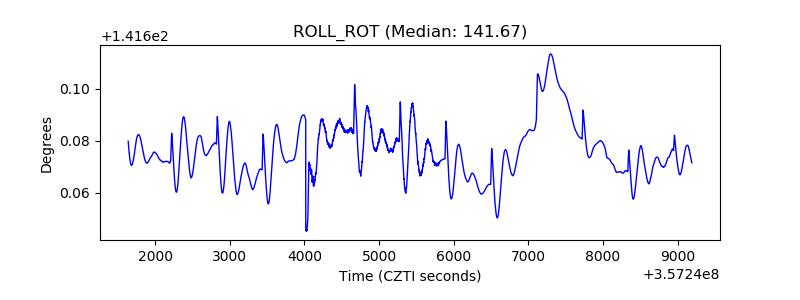 |
| _Roll_DEC | 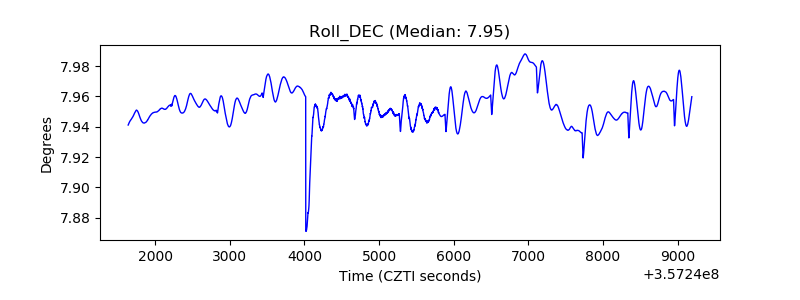 |
| _Roll_RA | 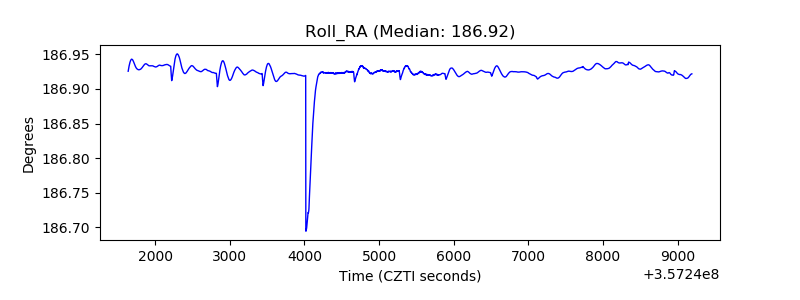 |
| Veto Counter | 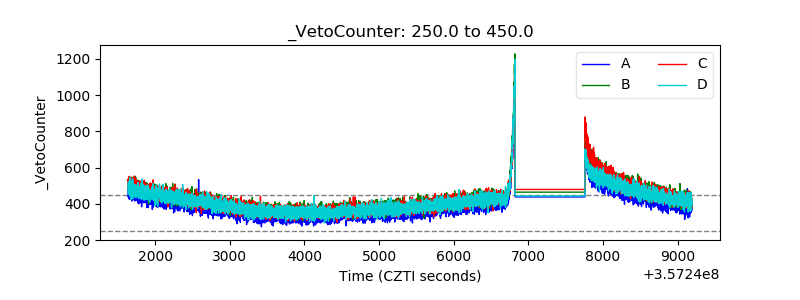 |