| Param | Original file | Final file |
|---|---|---|
| Filename | modeM0/AS1A10_102T01_9000004340_30176cztM0_level2.evt | modeM0/AS1A10_102T01_9000004340_30176cztM0_level2_quad_clean.evt |
| Size (bytes) | 624,064,320 | 91,589,760 |
| Size | 595.2 MB | 87.3 MB |
| Events in quadrant A | 3,237,870 | 597,248 |
| Events in quadrant B | 4,955,635 | 601,477 |
| Events in quadrant C | 6,487,637 | 553,358 |
| Events in quadrant D | 3,778,575 | 567,029 |
| Mode SS | |||
|---|---|---|---|
| Quadrant | BADHDUFLAG | Total packets | Discarded packets |
| A | 0 | 136 | 0 |
| B | 0 | 136 | 0 |
| C | 0 | 136 | 0 |
| D | 0 | 136 | 0 |
| Mode M9 | |||
|---|---|---|---|
| Quadrant | BADHDUFLAG | Total packets | Discarded packets |
| A | 0 | 20 | 0 |
| B | 0 | 20 | 0 |
| C | 0 | 20 | 0 |
| D | 0 | 20 | 0 |
| Mode M0 | |||
|---|---|---|---|
| Quadrant | BADHDUFLAG | Total packets | Discarded packets |
| A | 0 | 13885 | 2 |
| B | 0 | 19619 | 2 |
| C | 0 | 24014 | 2 |
| D | 0 | 15520 | 2 |
| Quadrant | Total seconds | Saturated seconds | Saturation percentage |
|---|---|---|---|
| A | 6509 | 69 | 1.060071% |
| B | 6509 | 93 | 1.428791% |
| C | 6510 | 531 | 8.156682% |
| D | 6510 | 106 | 1.628264% |
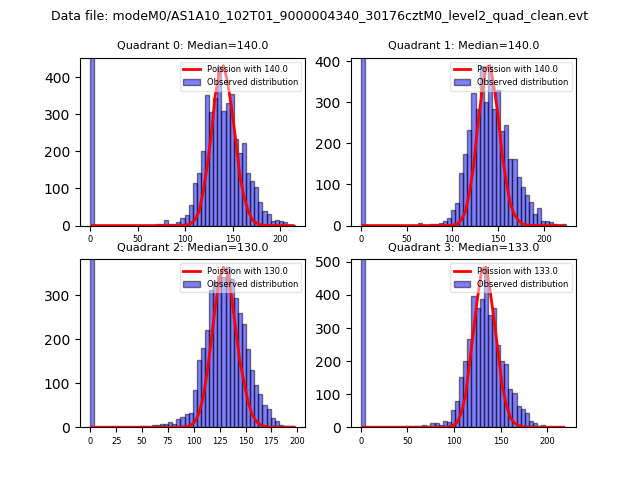
Noise dominated data is calculated using 1-second bins in cleaned event files. If a bin has >2000 counts, and if more than 50% of those come from <1% of pixels, then it is considered to be noise-dominated and hence unusable.
| Quadrant | # 1 sec bins | Bins with >0 counts | Bins with >2000 counts | High rate bins dominated by noise | Noise dominated (total time) | Noise dominated (detector-on time) | Marked lightcurve |
|---|---|---|---|---|---|---|---|
| A | 8534 | 6509 | 3 | 3 | 0.04% | 0.05% | 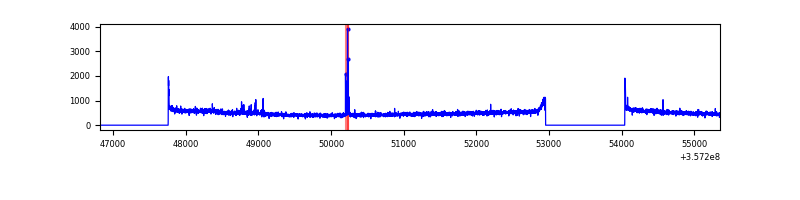 |
| B | 8534 | 6509 | 0 | 0 | 0.00% | 0.00% | 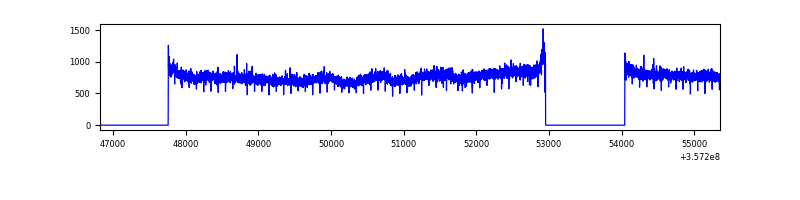 |
| C | 8535 | 6510 | 49 | 49 | 0.57% | 0.75% | 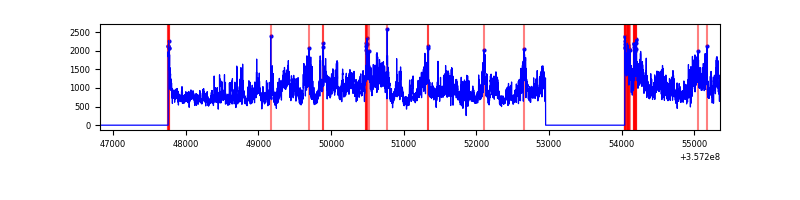 |
| D | 8535 | 6511 | 48 | 48 | 0.56% | 0.74% | 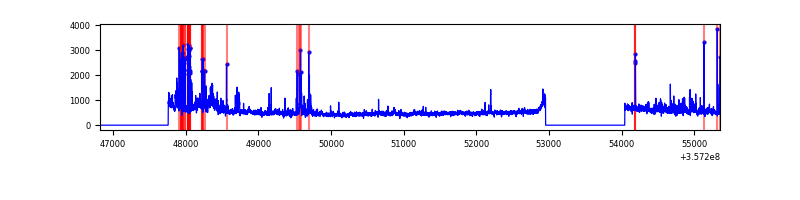 |
Top three noisy pixels from each quadrant. If the there are fewer than three noisy pixels in the level2.evt file, extra rows are filled as -1
| Pixel properties | Quadrant properties | ||||||
|---|---|---|---|---|---|---|---|
| Quadrant | DetID | PixID | Counts | Sigma | Mean | Median | Sigma |
| A | 0 | 13 | 70599 | 428.43 | 814 | 797 | 162.9 |
| A | 8 | 192 | 24236 | 143.86 | 814 | 797 | 162.9 |
| A | 13 | 254 | 10752 | 61.1 | 814 | 797 | 162.9 |
| B | 6 | 159 | 1792414 | 11502.63 | 806 | 786 | 155.8 |
| B | 12 | 111 | 18950 | 116.62 | 806 | 786 | 155.8 |
| B | 11 | 111 | 17401 | 106.67 | 806 | 786 | 155.8 |
| C | 3 | 233 | 3243732 | 18063.85 | 765 | 769 | 179.5 |
| C | 14 | 238 | 155507 | 861.92 | 765 | 769 | 179.5 |
| C | 14 | 254 | 50618 | 277.67 | 765 | 769 | 179.5 |
| D | 1 | 52 | 403470 | 2082.94 | 785 | 767 | 193.3 |
| D | 8 | 195 | 181768 | 936.21 | 785 | 767 | 193.3 |
| D | 13 | 104 | 97589 | 500.8 | 785 | 767 | 193.3 |
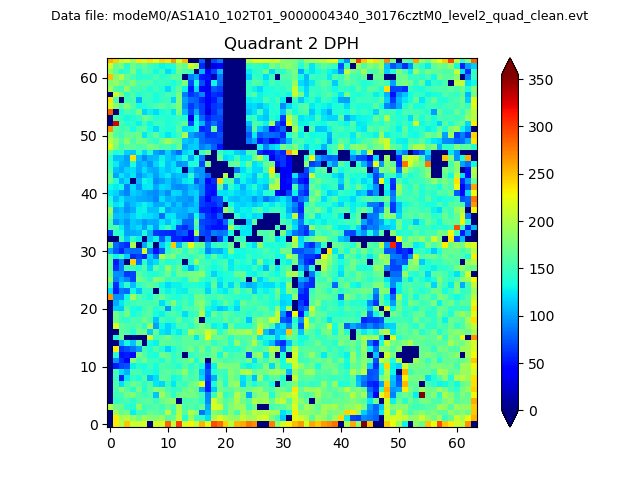
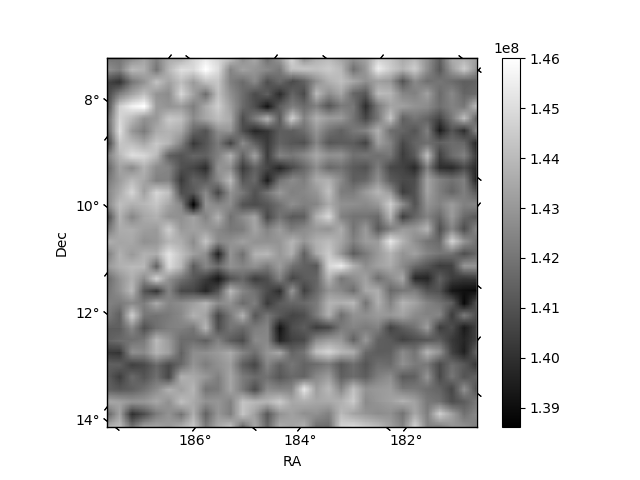
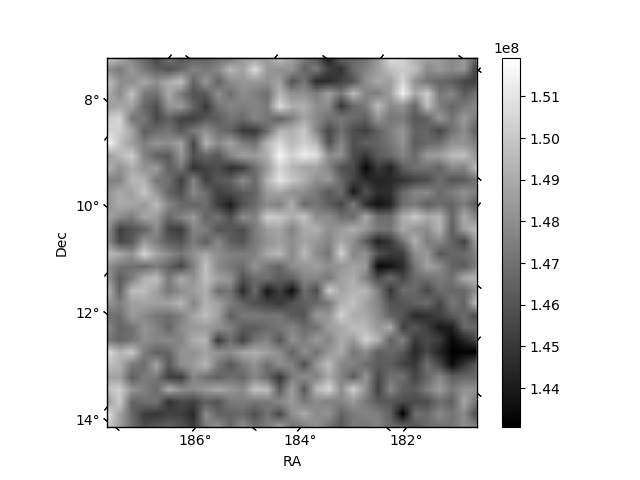
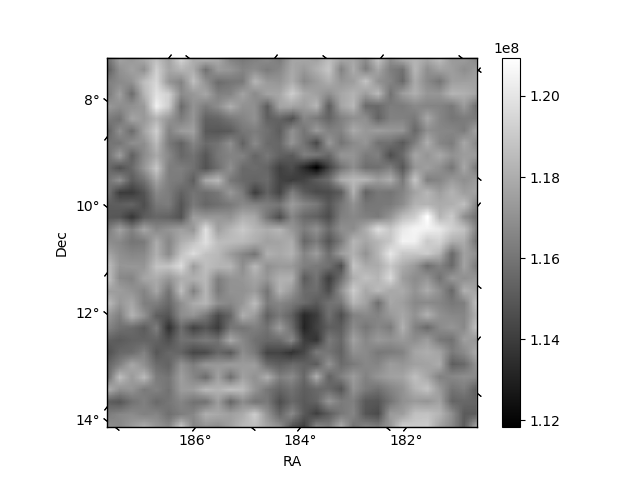
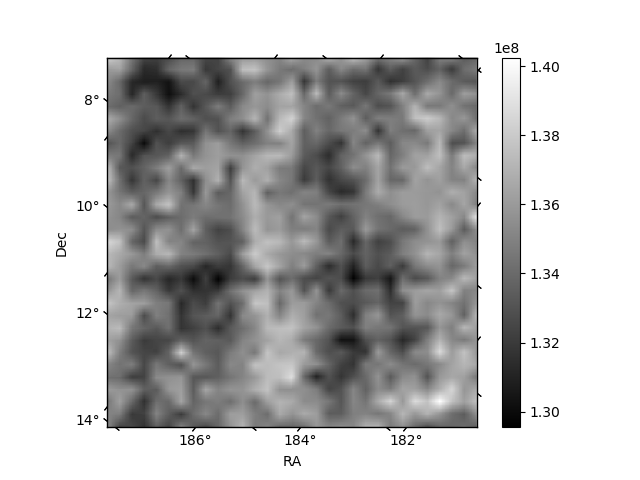
Histogram calculated using DETX and DETY for each event in the final _common_clean file
| Quadrant A | 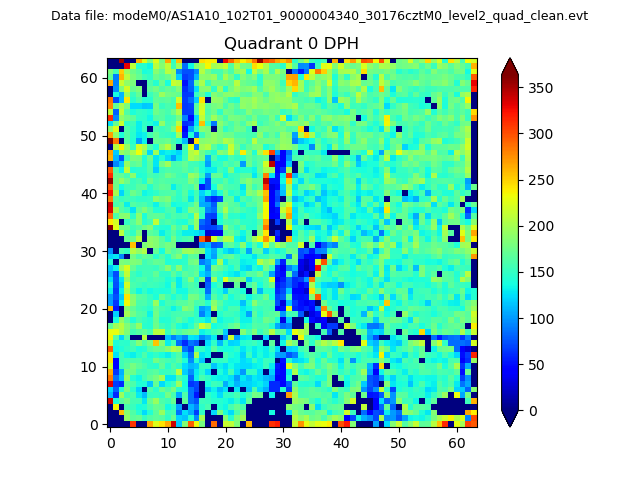 |
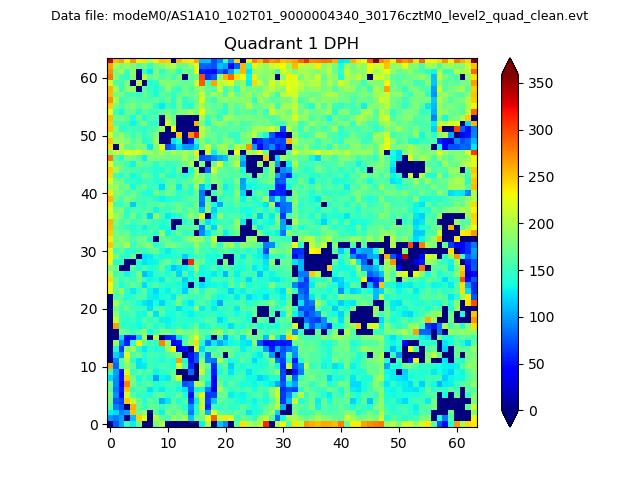 |
Quadrant B |
|---|---|---|---|
| Quadrant D | 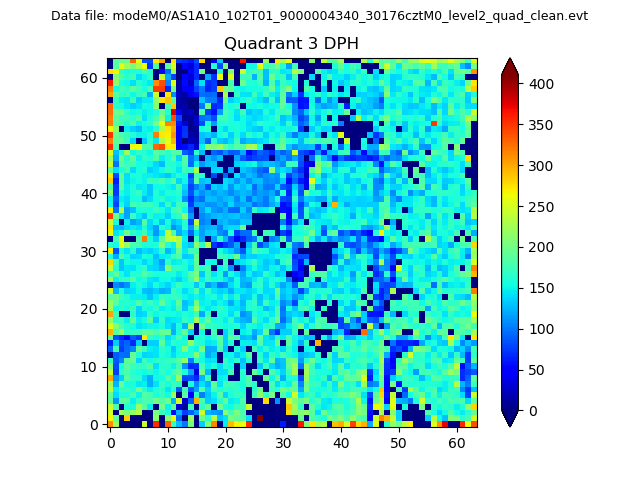 |
 |
Quadrant C |
| Plot type | Count rate plots | Images |
|---|---|---|
| Comparison with Poisson distribution Blue bars denote a histogram of data divided into 1 sec bins. Red curve is a Poisson curve with rate = median count rate of data. |
 |
 |
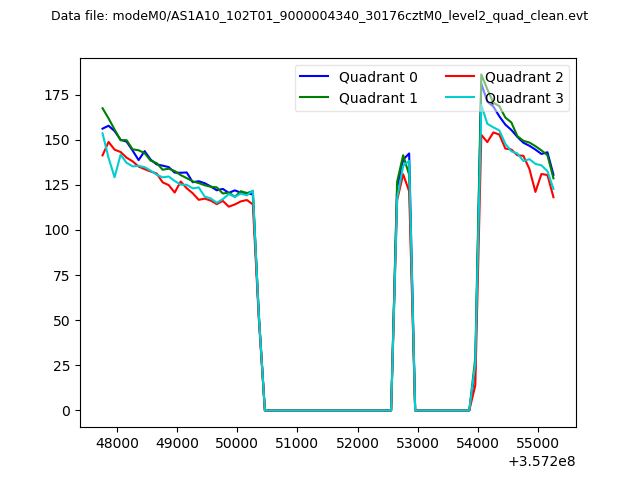
| Quadrant-wise count rates Data is divided into 100 sec bins |
 |
|
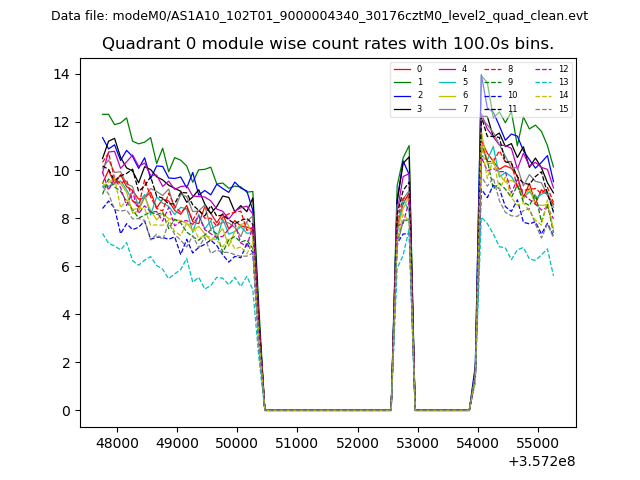
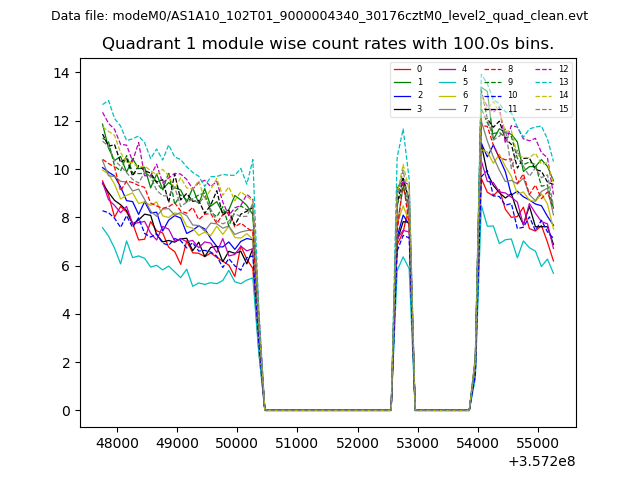
| Module-wise count rates for Quadrant A Data is divided into 100 sec bins |
 |
 |
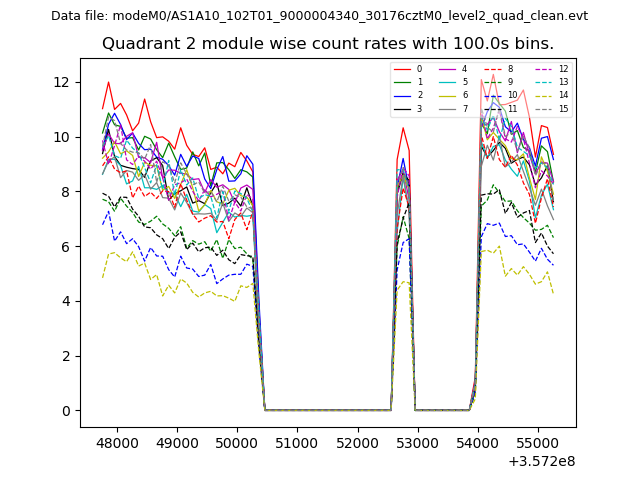
| Module-wise count rates for Quadrant B Data is divided into 100 sec bins |
 |
 |
| Module-wise count rates for Quadrant C Data is divided into 100 sec bins |
 |
 |
| Module-wise count rates for Quadrant D Data is divided into 100 sec bins |
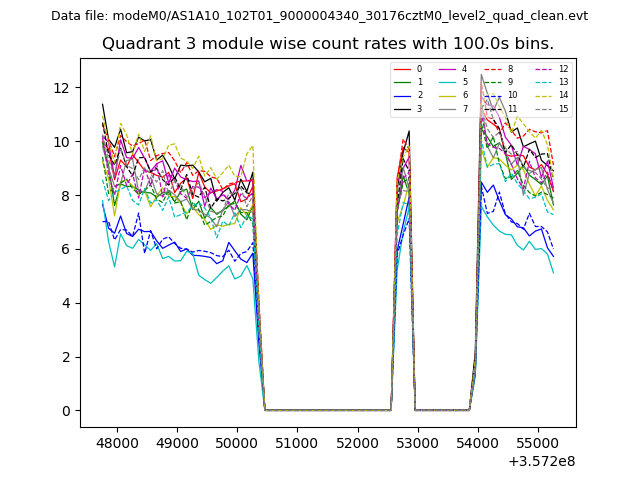 |
 |
| Parameter | Plot |
|---|---|
| CZT HV Monitor | 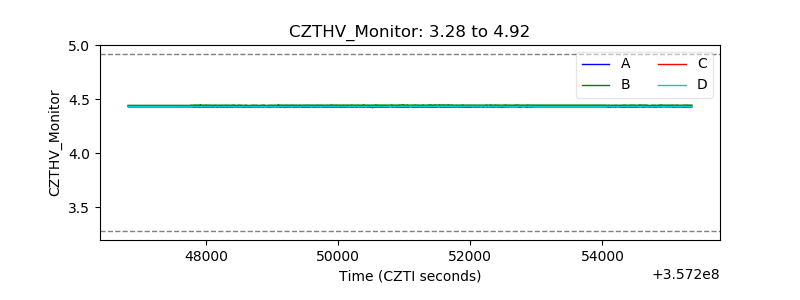 |
| D_VDD | 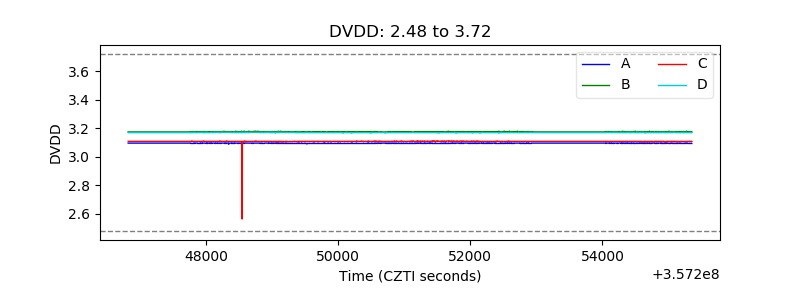 |
| Temperature 1 | 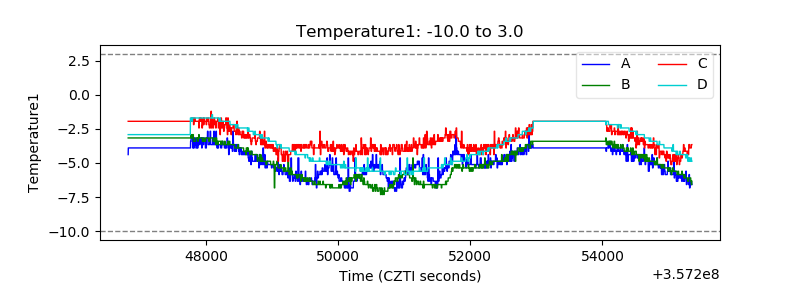 |
| Veto HV Monitor |  |
| Veto LLD | 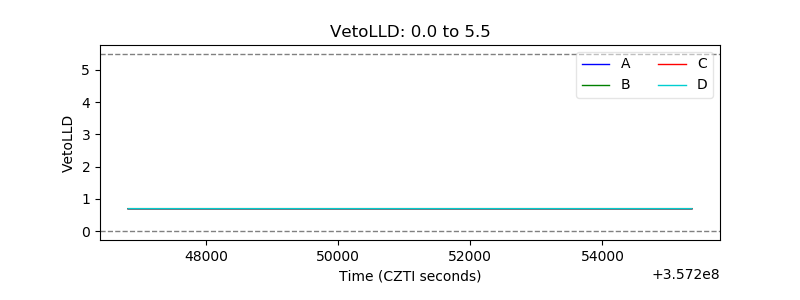 |
| Alpha Counter | 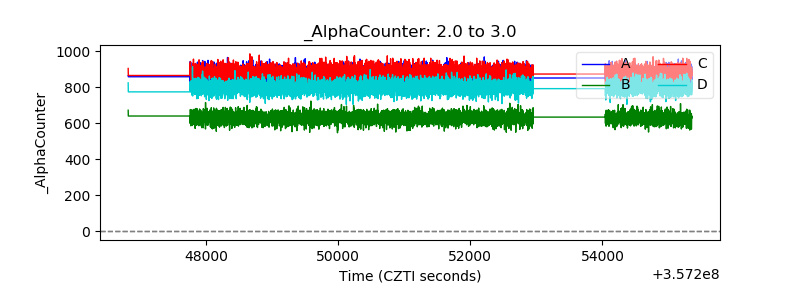 |
| _CPM_Rate | 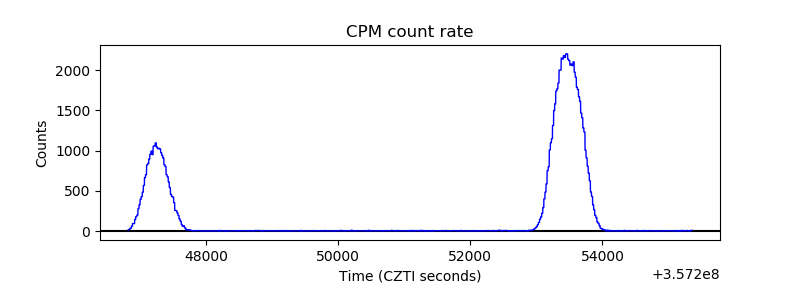 |
| CZT Counter | 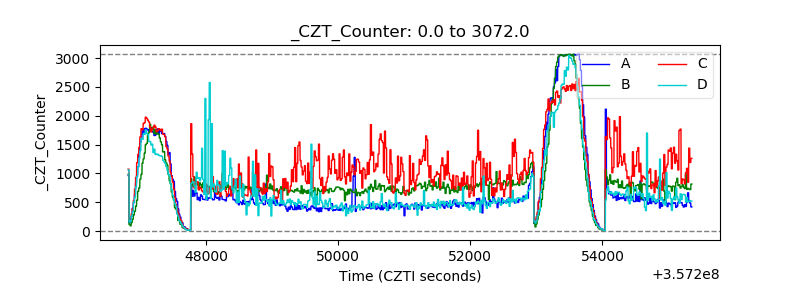 |
| +2.5 Volts monitor | 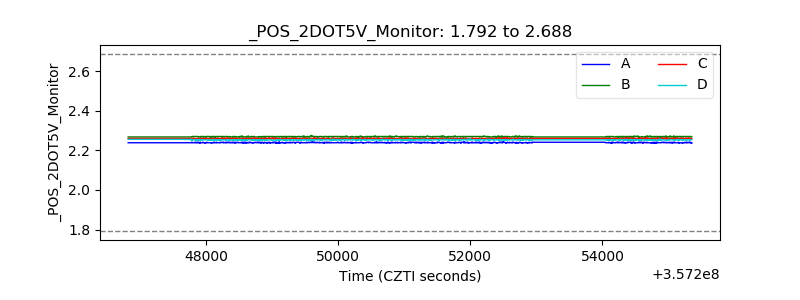 |
| +5 Volts monitor |  |
| _ROLL_ROT | 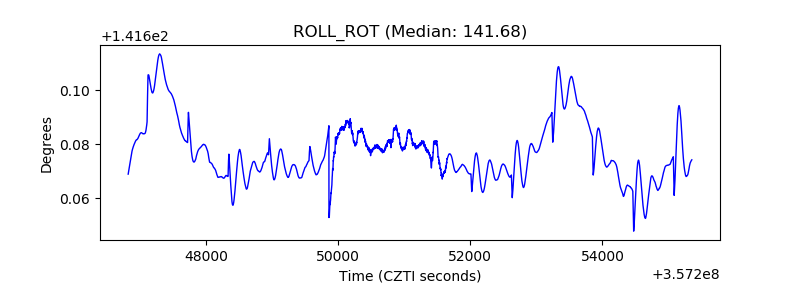 |
| _Roll_DEC | 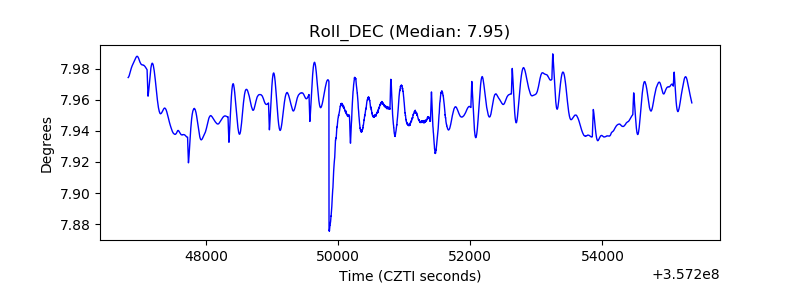 |
| _Roll_RA | 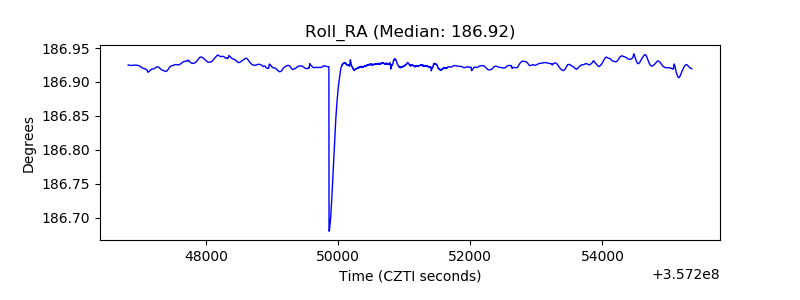 |
| Veto Counter | 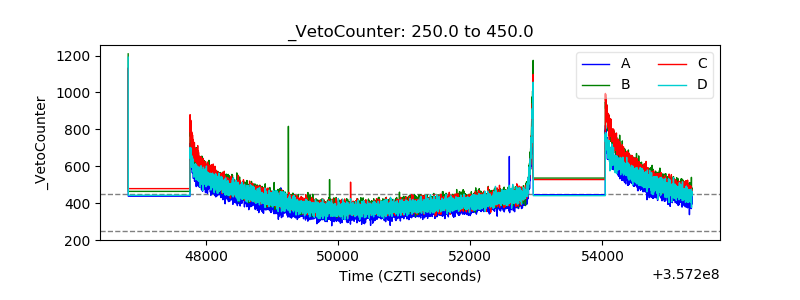 |