| Param | Original file | Final file |
|---|---|---|
| Filename | modeM0/AS1A10_102T01_9000004340_30179cztM0_level2.evt | modeM0/AS1A10_102T01_9000004340_30179cztM0_level2_quad_clean.evt |
| Size (bytes) | 875,986,560 | 89,392,320 |
| Size | 835.4 MB | 85.3 MB |
| Events in quadrant A | 3,267,973 | 642,656 |
| Events in quadrant B | 5,068,109 | 658,477 |
| Events in quadrant C | 12,828,289 | 419,709 |
| Events in quadrant D | 4,943,892 | 549,029 |
| Mode SS | |||
|---|---|---|---|
| Quadrant | BADHDUFLAG | Total packets | Discarded packets |
| A | 0 | 128 | 0 |
| B | 0 | 128 | 0 |
| C | 0 | 128 | 0 |
| D | 0 | 128 | 0 |
| Mode M9 | |||
|---|---|---|---|
| Quadrant | BADHDUFLAG | Total packets | Discarded packets |
| A | 0 | 13 | 0 |
| B | 0 | 14 | 0 |
| C | 0 | 14 | 0 |
| D | 0 | 14 | 0 |
| Mode M0 | |||
|---|---|---|---|
| Quadrant | BADHDUFLAG | Total packets | Discarded packets |
| A | 0 | 13517 | 3 |
| B | 0 | 19027 | 2 |
| C | 0 | 42368 | 2 |
| D | 0 | 18946 | 2 |
| Quadrant | Total seconds | Saturated seconds | Saturation percentage |
|---|---|---|---|
| A | 6239 | 54 | 0.865523% |
| B | 6239 | 96 | 1.538708% |
| C | 6239 | 4601 | 73.745793% |
| D | 6239 | 578 | 9.264305% |
Noise dominated data is calculated using 1-second bins in cleaned event files. If a bin has >2000 counts, and if more than 50% of those come from <1% of pixels, then it is considered to be noise-dominated and hence unusable.
| Quadrant | # 1 sec bins | Bins with >0 counts | Bins with >2000 counts | High rate bins dominated by noise | Noise dominated (total time) | Noise dominated (detector-on time) | Marked lightcurve |
|---|---|---|---|---|---|---|---|
| A | 7514 | 6240 | 3 | 3 | 0.04% | 0.05% | 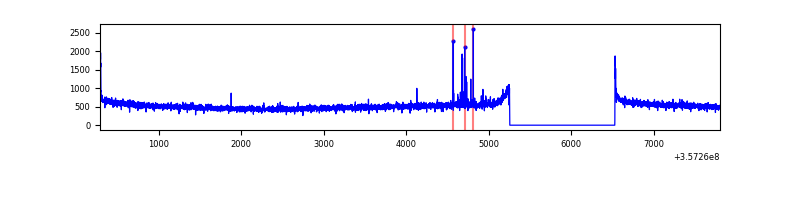 |
| B | 7514 | 6240 | 0 | 0 | 0.00% | 0.00% | 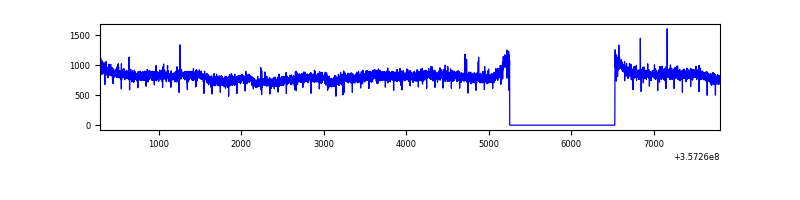 |
| C | 7514 | 6239 | 3820 | 3820 | 50.84% | 61.23% | 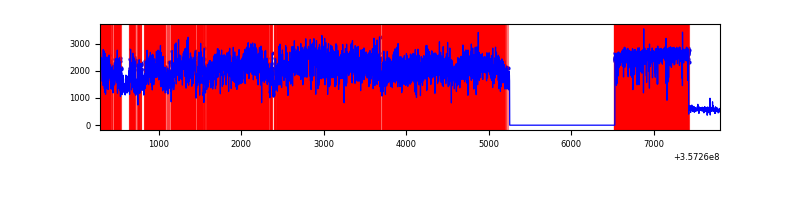 |
| D | 7514 | 6240 | 328 | 328 | 4.37% | 5.26% | 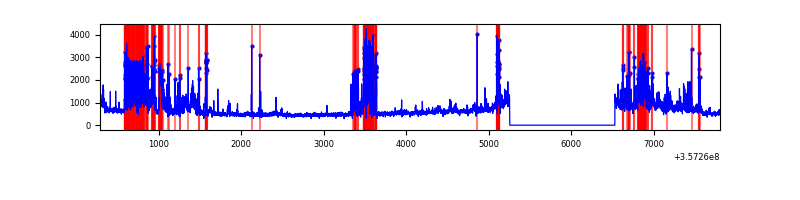 |
Top three noisy pixels from each quadrant. If the there are fewer than three noisy pixels in the level2.evt file, extra rows are filled as -1
| Pixel properties | Quadrant properties | ||||||
|---|---|---|---|---|---|---|---|
| Quadrant | DetID | PixID | Counts | Sigma | Mean | Median | Sigma |
| A | 10 | 253 | 23641 | 138.4 | 835 | 821 | 164.9 |
| A | 8 | 192 | 23049 | 134.81 | 835 | 821 | 164.9 |
| A | 13 | 254 | 11067 | 62.14 | 835 | 821 | 164.9 |
| B | 6 | 159 | 1793807 | 11258.55 | 835 | 816 | 159.3 |
| B | 12 | 111 | 19008 | 114.23 | 835 | 816 | 159.3 |
| B | 11 | 111 | 17156 | 102.6 | 835 | 816 | 159.3 |
| C | 3 | 233 | 10329118 | 74351.7 | 599 | 605 | 138.9 |
| C | 14 | 238 | 107439 | 769.06 | 599 | 605 | 138.9 |
| C | 14 | 254 | 20966 | 146.57 | 599 | 605 | 138.9 |
| D | 1 | 52 | 1103087 | 5654.03 | 751 | 735 | 195.0 |
| D | 8 | 195 | 407838 | 2088.05 | 751 | 735 | 195.0 |
| D | 13 | 104 | 399186 | 2043.68 | 751 | 735 | 195.0 |
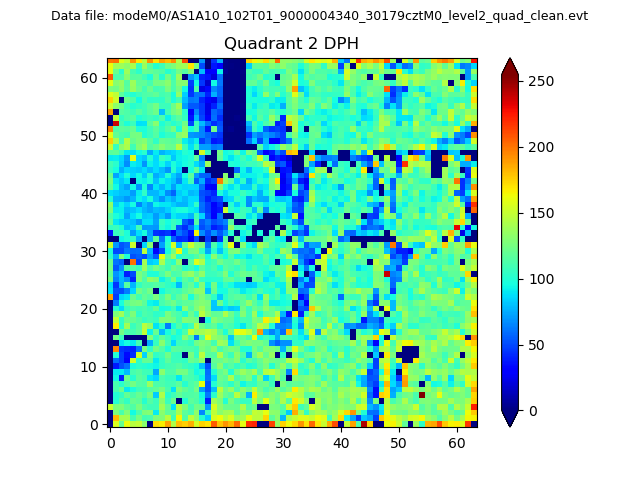
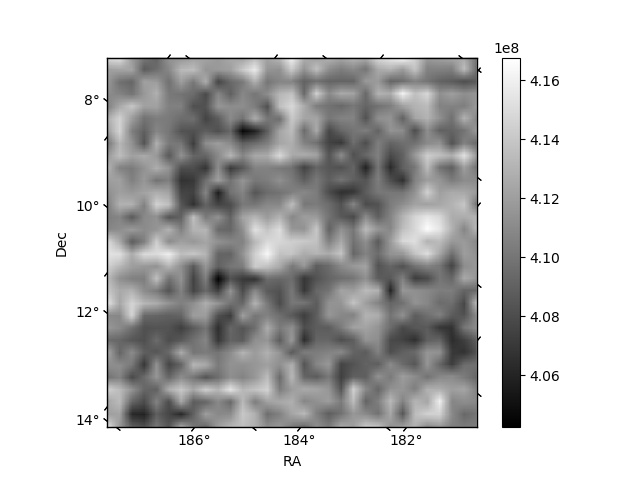
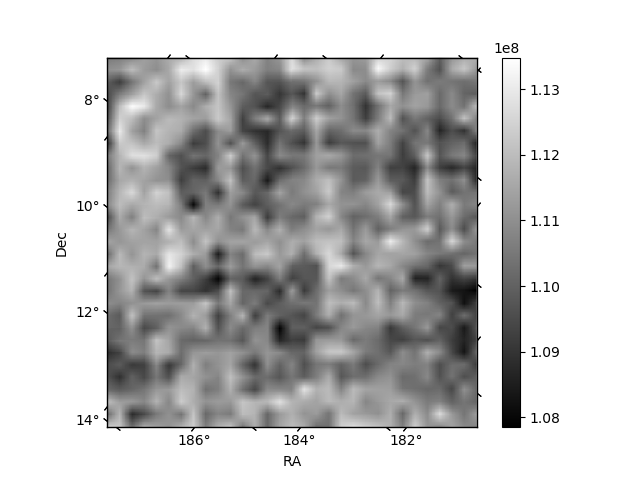
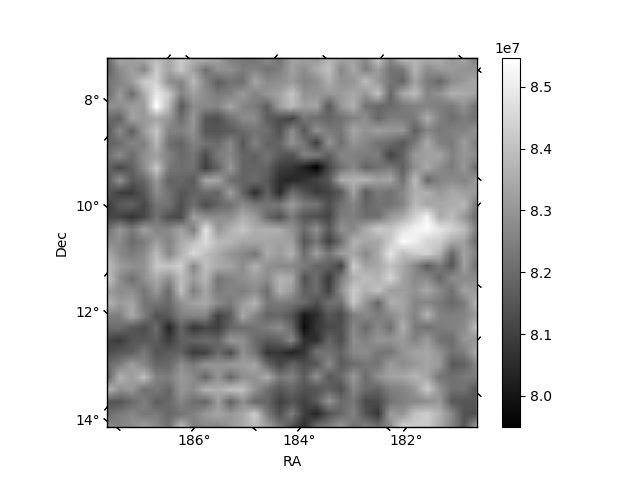
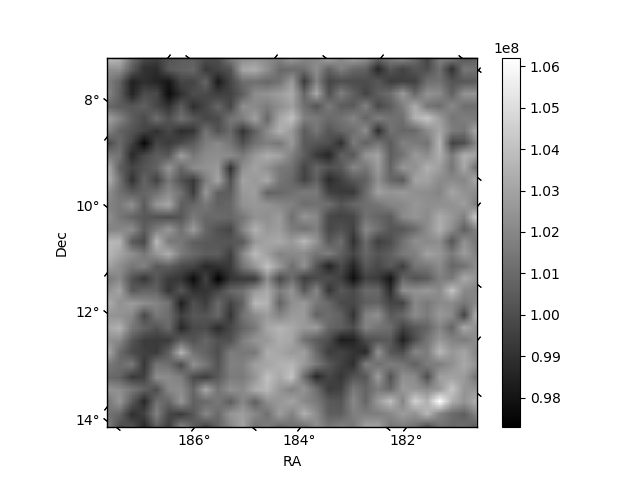
Histogram calculated using DETX and DETY for each event in the final _common_clean file
| Quadrant A | 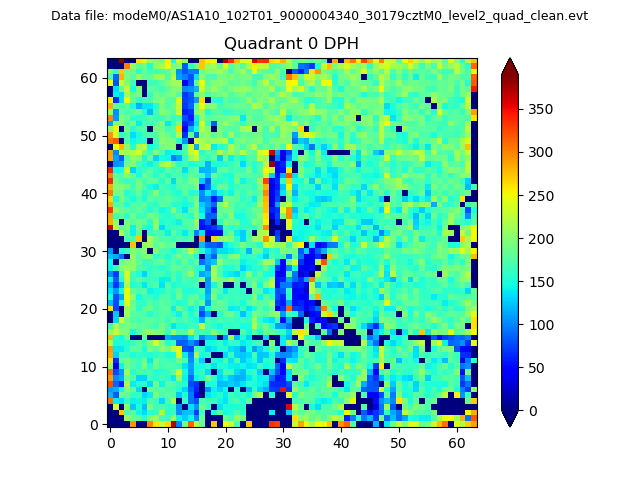 |
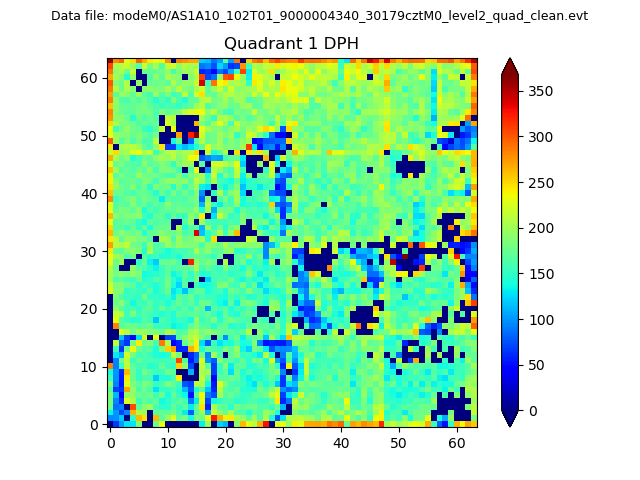 |
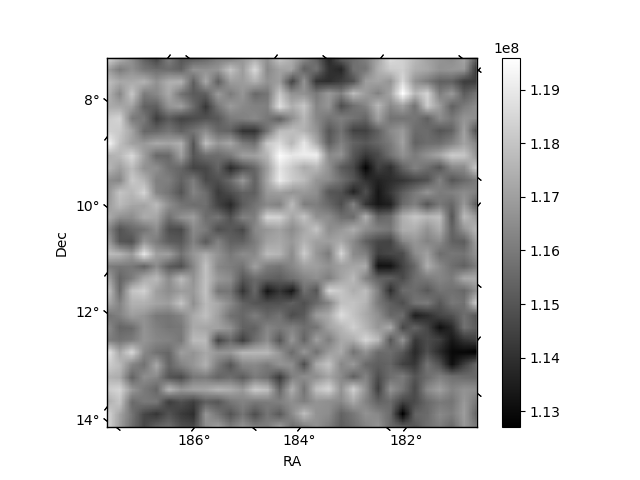
Quadrant B |
|---|---|---|---|
| Quadrant D | 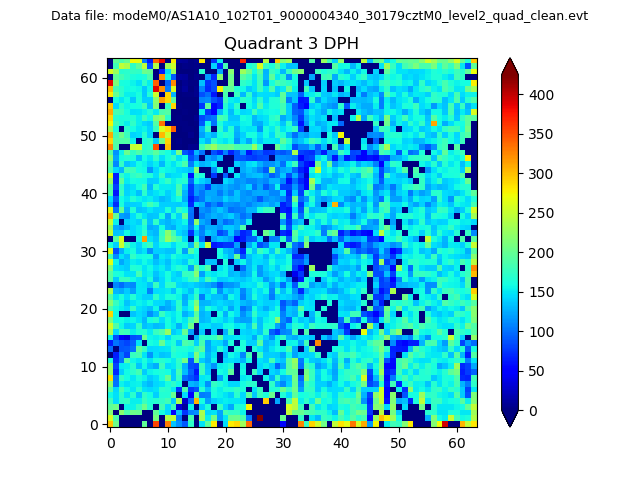 |
 |
Quadrant C |
| Plot type | Count rate plots | Images |
|---|---|---|
| Comparison with Poisson distribution Blue bars denote a histogram of data divided into 1 sec bins. Red curve is a Poisson curve with rate = median count rate of data. |
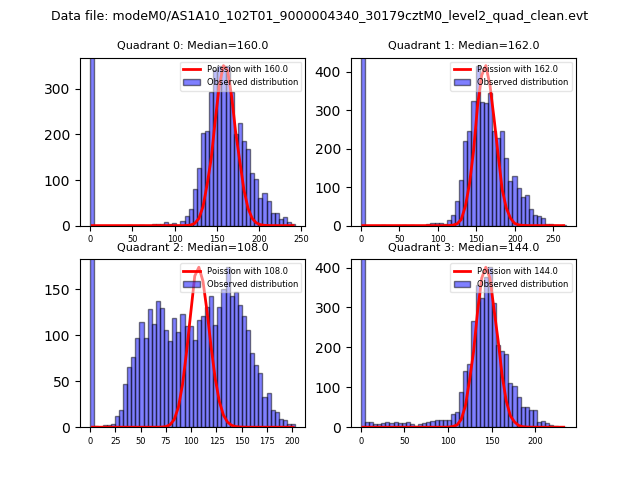 |
 |
| Quadrant-wise count rates Data is divided into 100 sec bins |
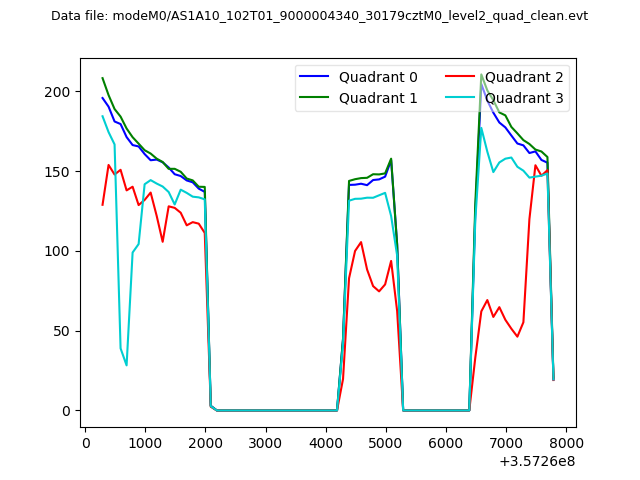 |
|
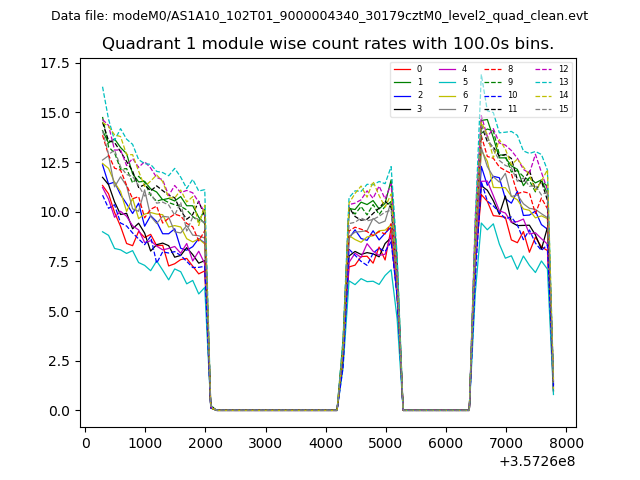
| Module-wise count rates for Quadrant A Data is divided into 100 sec bins |
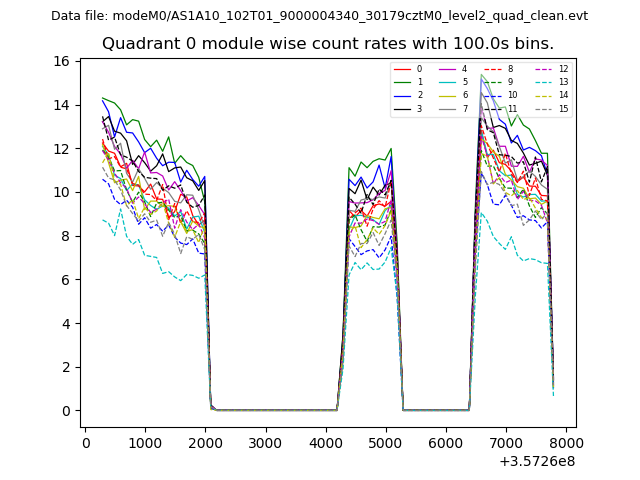 |
 |
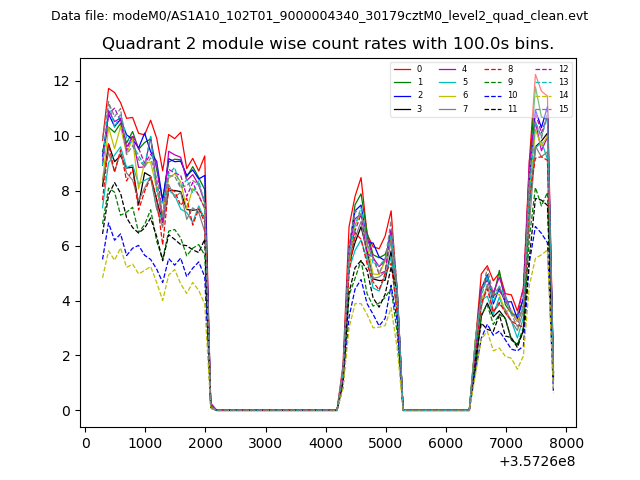
| Module-wise count rates for Quadrant B Data is divided into 100 sec bins |
 |
 |
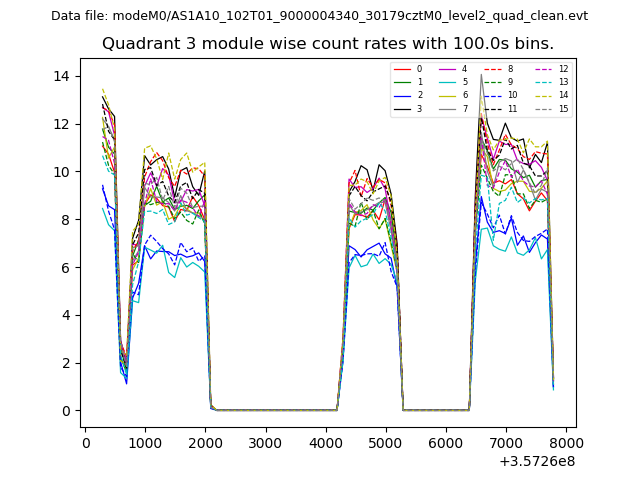
| Module-wise count rates for Quadrant C Data is divided into 100 sec bins |
 |
 |
| Module-wise count rates for Quadrant D Data is divided into 100 sec bins |
 |
 |
| Parameter | Plot |
|---|---|
| CZT HV Monitor | 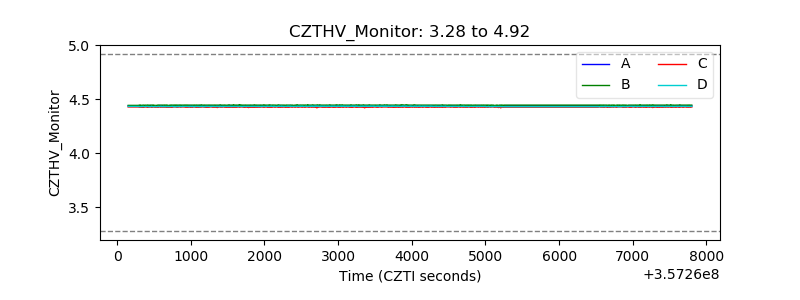 |
| D_VDD | 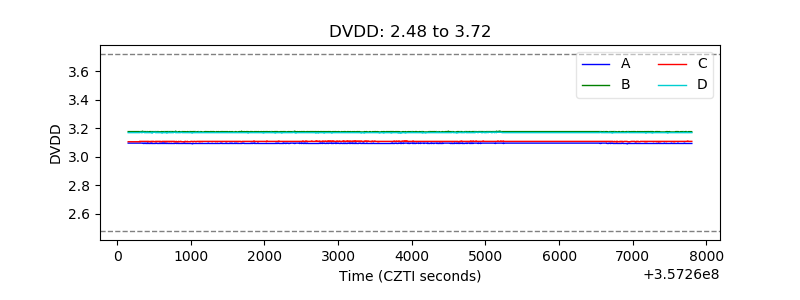 |
| Temperature 1 | 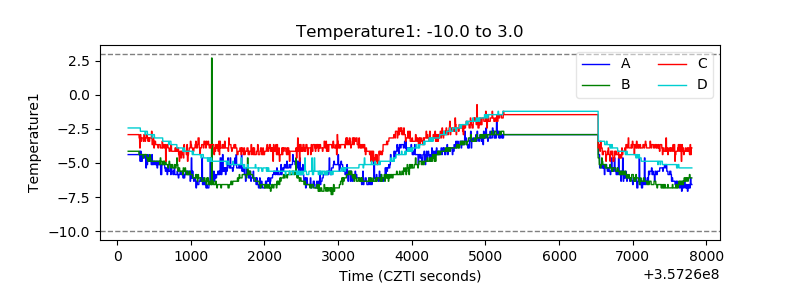 |
| Veto HV Monitor |  |
| Veto LLD | 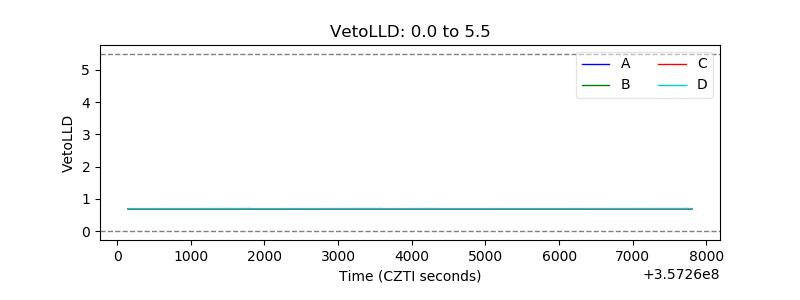 |
| Alpha Counter | 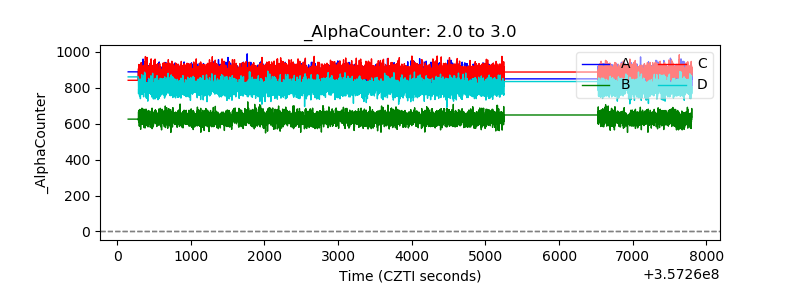 |
| _CPM_Rate |  |
| CZT Counter | 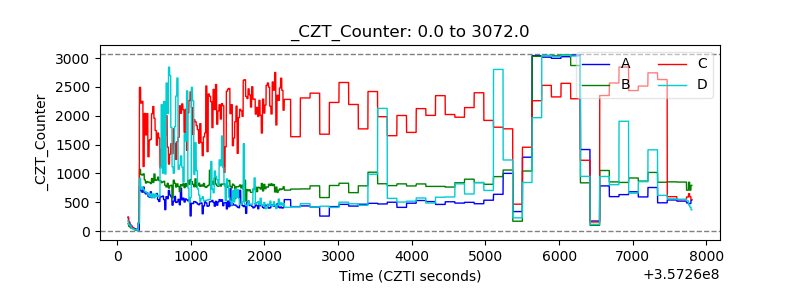 |
| +2.5 Volts monitor |  |
| +5 Volts monitor |  |
| _ROLL_ROT | 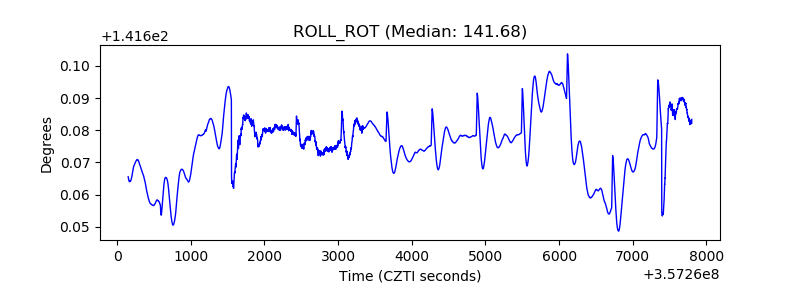 |
| _Roll_DEC | 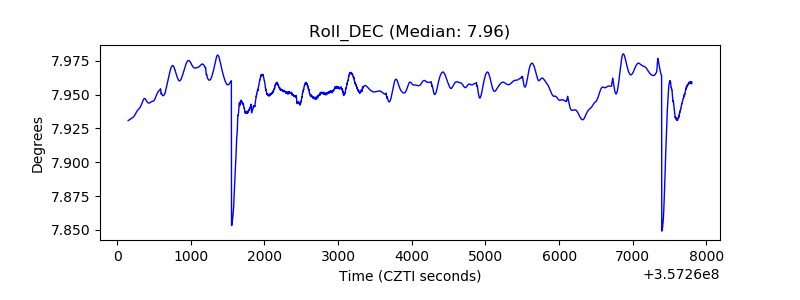 |
| _Roll_RA | 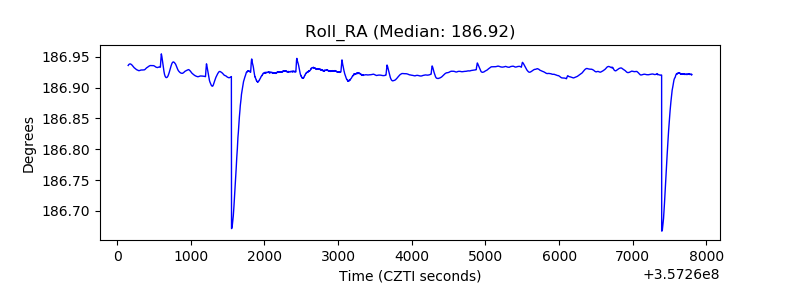 |
| Veto Counter | 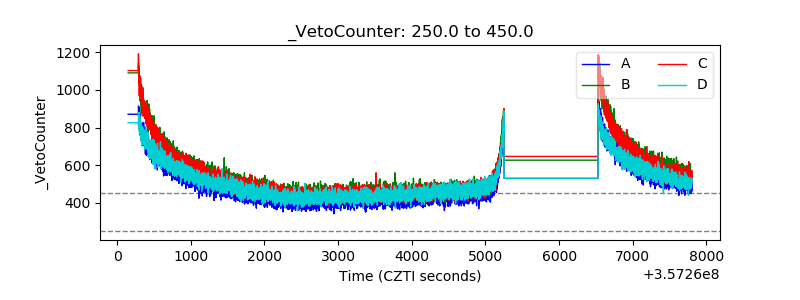 |