| Param | Original file | Final file |
|---|---|---|
| Filename | modeM0/AS1A10_102T01_9000004340_30180cztM0_level2.evt | modeM0/AS1A10_102T01_9000004340_30180cztM0_level2_quad_clean.evt |
| Size (bytes) | 851,967,360 | 76,711,680 |
| Size | 812.5 MB | 73.2 MB |
| Events in quadrant A | 3,161,104 | 570,490 |
| Events in quadrant B | 4,913,866 | 583,771 |
| Events in quadrant C | 11,816,023 | 280,153 |
| Events in quadrant D | 5,503,605 | 465,053 |
| Mode SS | |||
|---|---|---|---|
| Quadrant | BADHDUFLAG | Total packets | Discarded packets |
| A | 0 | 122 | 0 |
| B | 0 | 122 | 0 |
| C | 0 | 122 | 0 |
| D | 0 | 122 | 0 |
| Mode M9 | |||
|---|---|---|---|
| Quadrant | BADHDUFLAG | Total packets | Discarded packets |
| A | 0 | 14 | 0 |
| B | 0 | 14 | 0 |
| C | 0 | 14 | 0 |
| D | 0 | 14 | 0 |
| Mode M0 | |||
|---|---|---|---|
| Quadrant | BADHDUFLAG | Total packets | Discarded packets |
| A | 0 | 12863 | 1 |
| B | 0 | 18373 | 1 |
| C | 0 | 39089 | 2 |
| D | 0 | 20298 | 1 |
| Quadrant | Total seconds | Saturated seconds | Saturation percentage |
|---|---|---|---|
| A | 6039 | 21 | 0.347740% |
| B | 6040 | 54 | 0.894040% |
| C | 6039 | 4559 | 75.492631% |
| D | 6039 | 820 | 13.578407% |
Noise dominated data is calculated using 1-second bins in cleaned event files. If a bin has >2000 counts, and if more than 50% of those come from <1% of pixels, then it is considered to be noise-dominated and hence unusable.
| Quadrant | # 1 sec bins | Bins with >0 counts | Bins with >2000 counts | High rate bins dominated by noise | Noise dominated (total time) | Noise dominated (detector-on time) | Marked lightcurve |
|---|---|---|---|---|---|---|---|
| A | 7414 | 6040 | 1 | 1 | 0.01% | 0.02% | 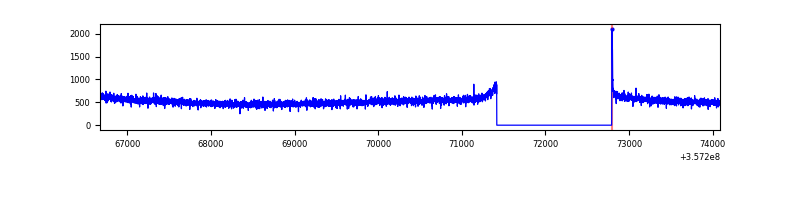 |
| B | 7415 | 6041 | 0 | 0 | 0.00% | 0.00% | 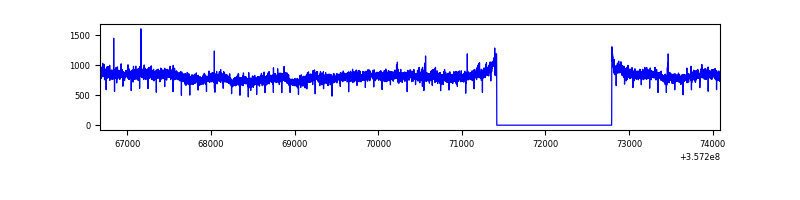 |
| C | 7413 | 6038 | 4041 | 4041 | 54.51% | 66.93% | 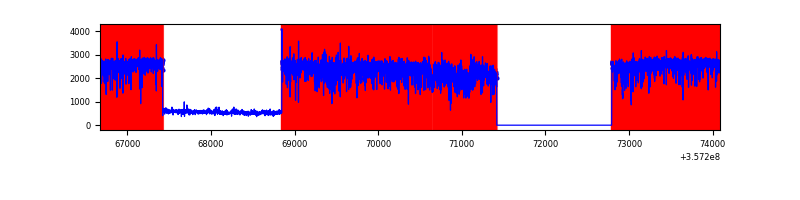 |
| D | 7414 | 6039 | 675 | 675 | 9.10% | 11.18% | 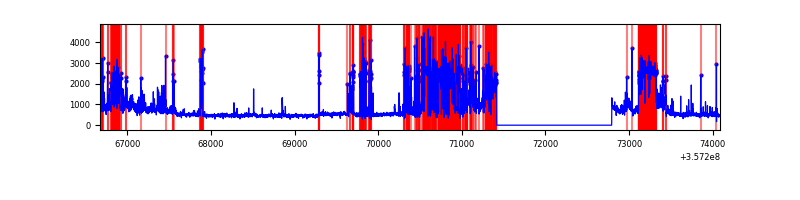 |
Top three noisy pixels from each quadrant. If the there are fewer than three noisy pixels in the level2.evt file, extra rows are filled as -1
| Pixel properties | Quadrant properties | ||||||
|---|---|---|---|---|---|---|---|
| Quadrant | DetID | PixID | Counts | Sigma | Mean | Median | Sigma |
| A | 8 | 192 | 12926 | 74.46 | 816 | 801 | 162.8 |
| A | 13 | 254 | 10320 | 58.46 | 816 | 801 | 162.8 |
| A | 3 | 137 | 7698 | 42.36 | 816 | 801 | 162.8 |
| B | 6 | 159 | 1703158 | 11118.83 | 814 | 797 | 153.1 |
| B | 12 | 111 | 18482 | 115.51 | 814 | 797 | 153.1 |
| B | 11 | 111 | 16563 | 102.97 | 814 | 797 | 153.1 |
| C | 3 | 233 | 9729726 | 84606.05 | 495 | 500 | 115.0 |
| C | 14 | 238 | 98198 | 849.59 | 495 | 500 | 115.0 |
| C | 14 | 254 | 30432 | 260.29 | 495 | 500 | 115.0 |
| D | 1 | 52 | 1376822 | 7834.42 | 718 | 703 | 175.7 |
| D | 13 | 104 | 956684 | 5442.52 | 718 | 703 | 175.7 |
| D | 8 | 195 | 299692 | 1702.18 | 718 | 703 | 175.7 |
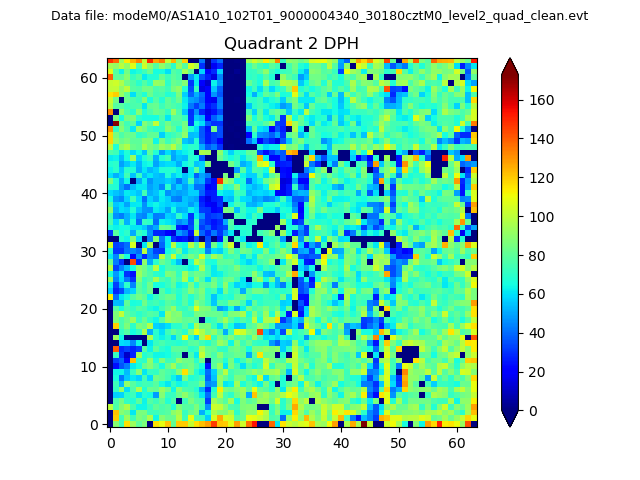
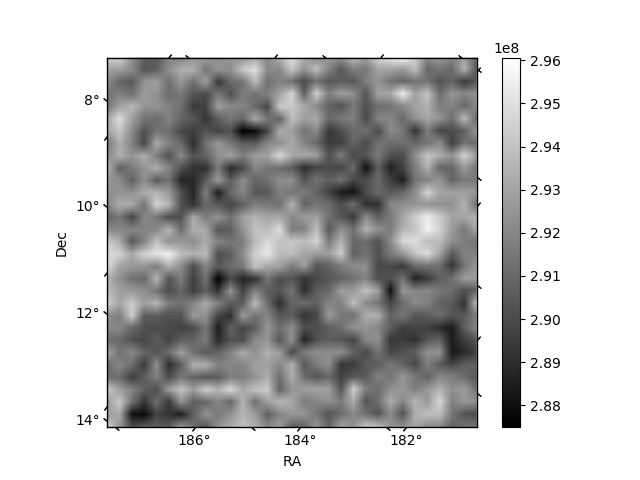
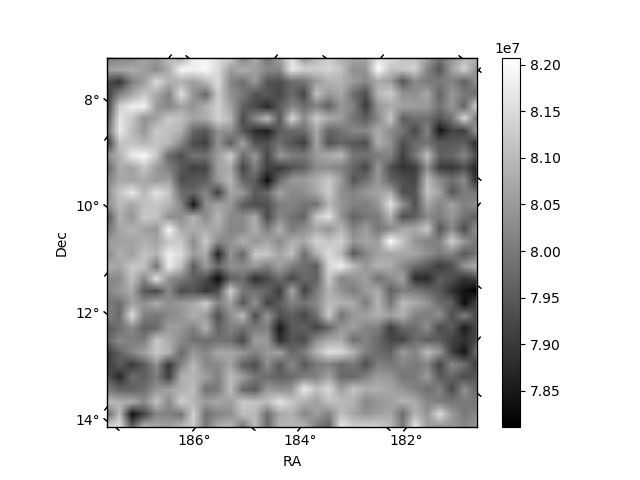
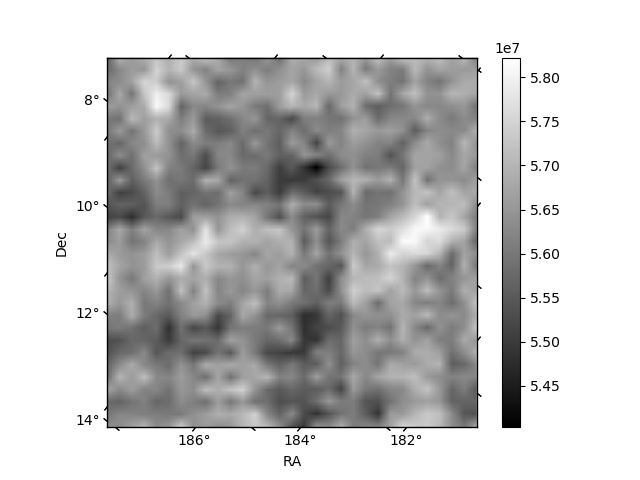
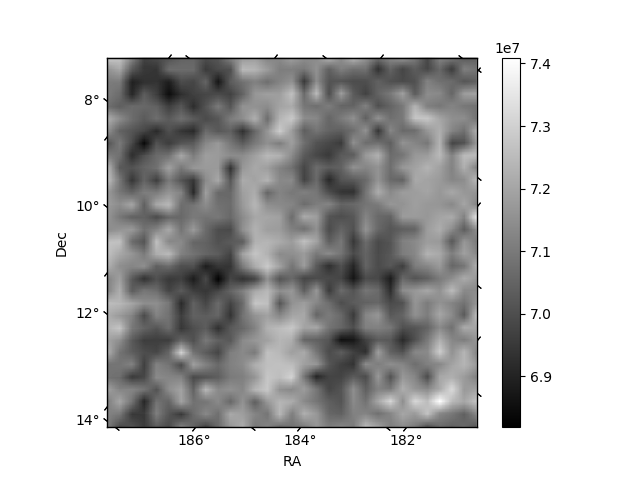
Histogram calculated using DETX and DETY for each event in the final _common_clean file
| Quadrant A | 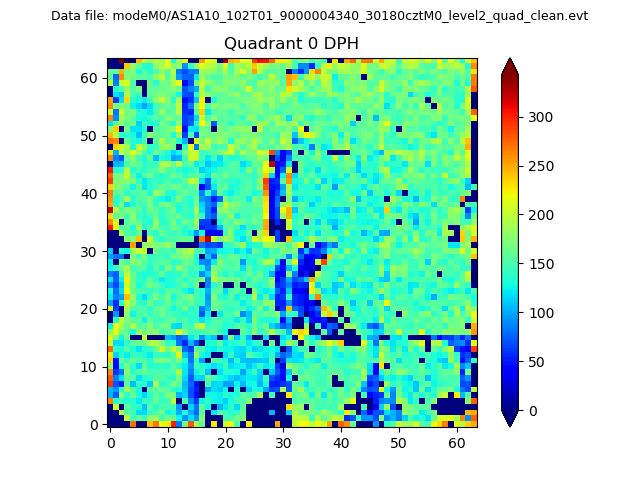 |
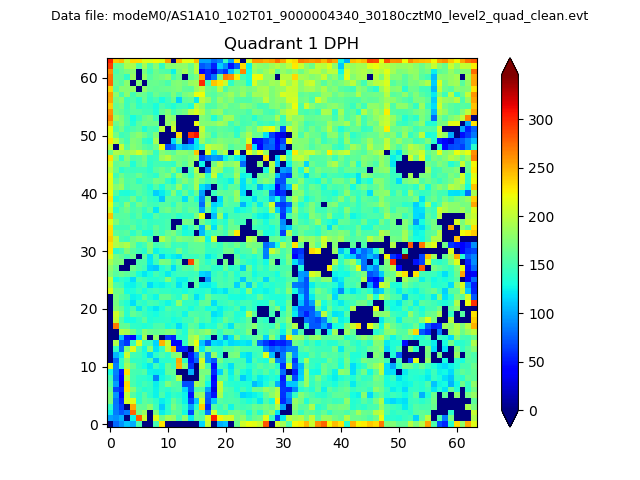 |
Quadrant B |
|---|---|---|---|
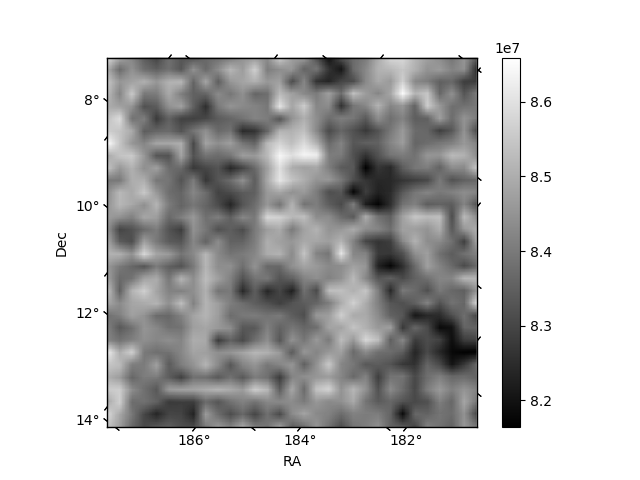
| Quadrant D | 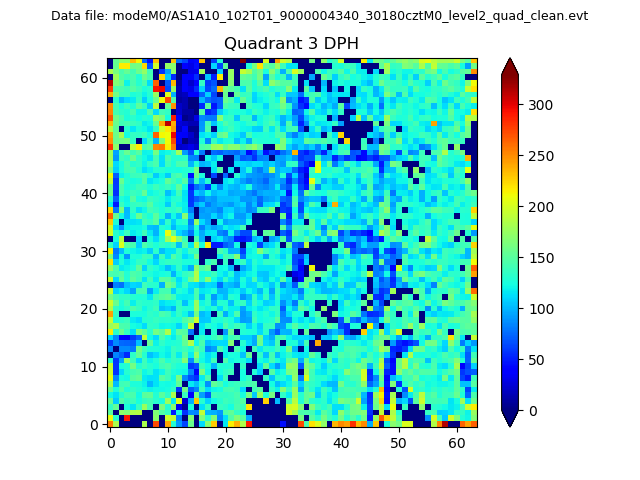 |
 |
Quadrant C |
| Plot type | Count rate plots | Images |
|---|---|---|
| Comparison with Poisson distribution Blue bars denote a histogram of data divided into 1 sec bins. Red curve is a Poisson curve with rate = median count rate of data. |
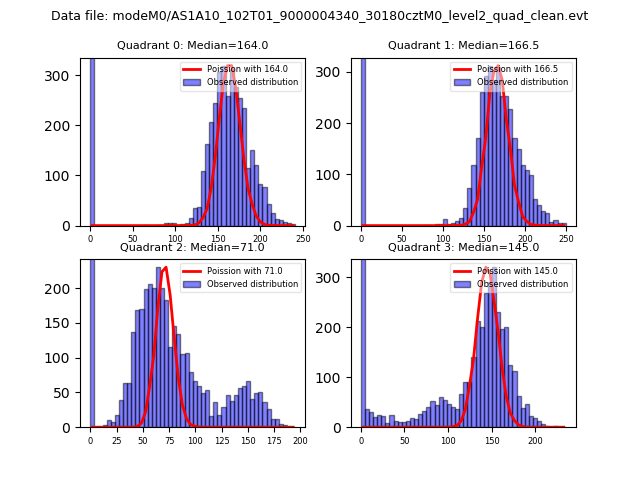 |
 |
| Quadrant-wise count rates Data is divided into 100 sec bins |
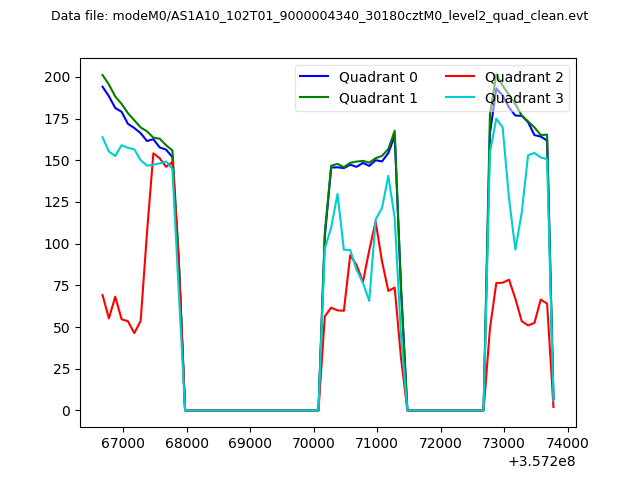 |
|
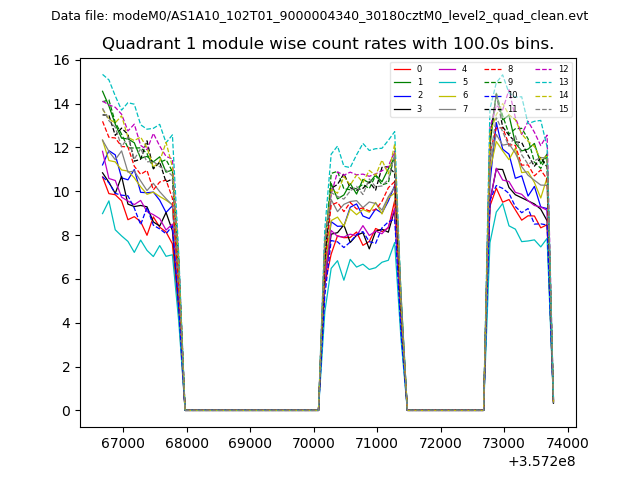
| Module-wise count rates for Quadrant A Data is divided into 100 sec bins |
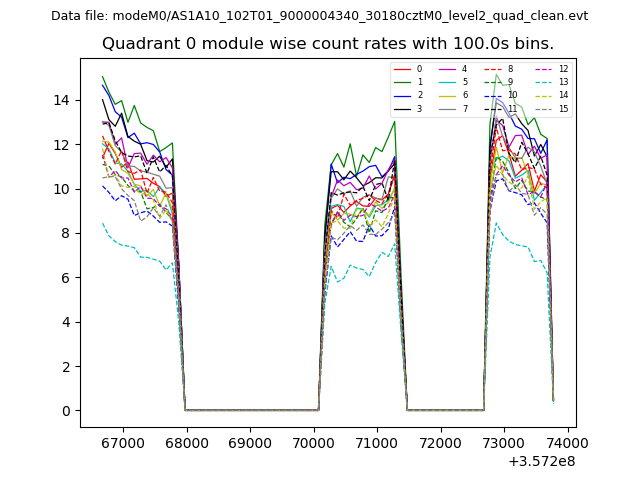 |
 |
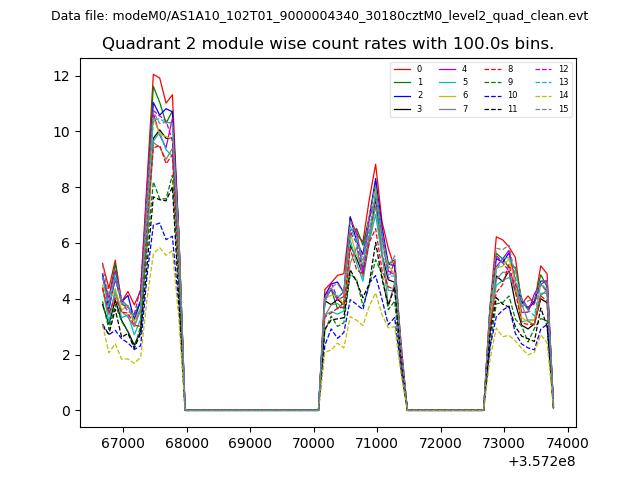
| Module-wise count rates for Quadrant B Data is divided into 100 sec bins |
 |
 |
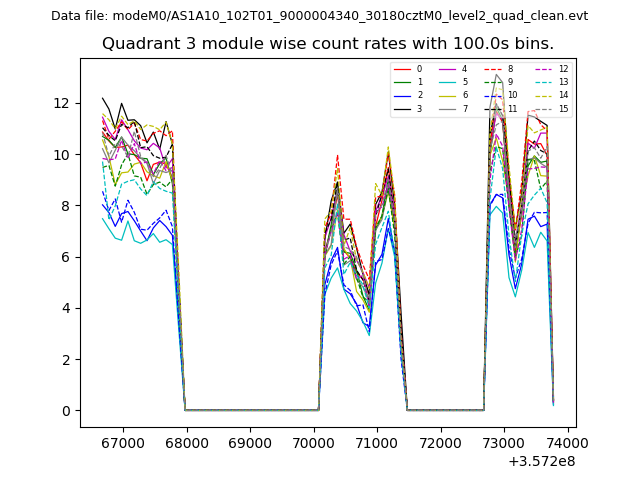
| Module-wise count rates for Quadrant C Data is divided into 100 sec bins |
 |
 |
| Module-wise count rates for Quadrant D Data is divided into 100 sec bins |
 |
 |
| Parameter | Plot |
|---|---|
| CZT HV Monitor | 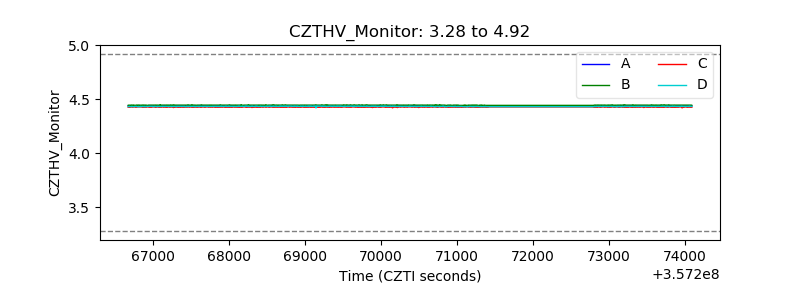 |
| D_VDD | 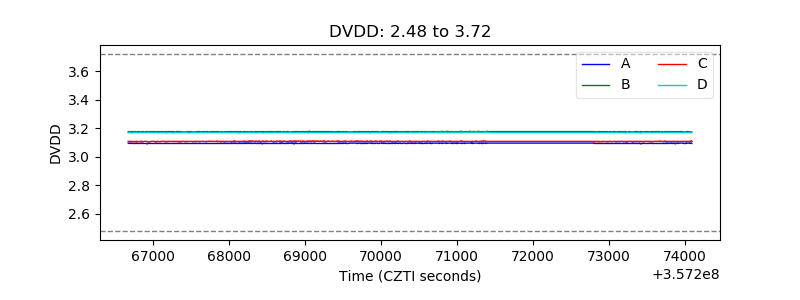 |
| Temperature 1 | 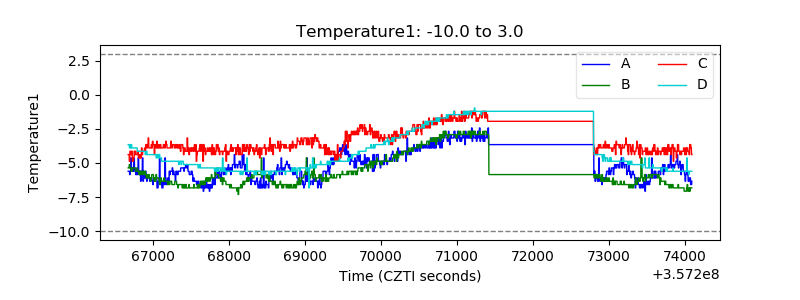 |
| Veto HV Monitor | 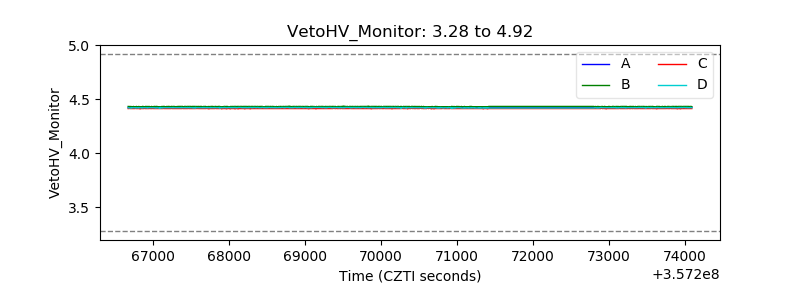 |
| Veto LLD | 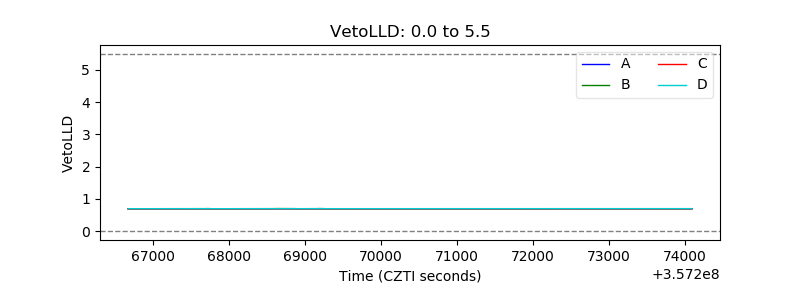 |
| Alpha Counter | 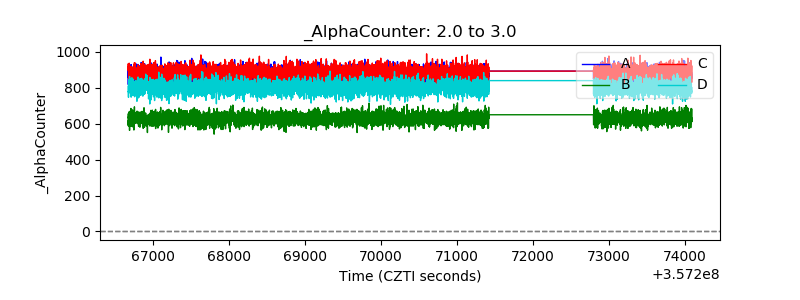 |
| _CPM_Rate | 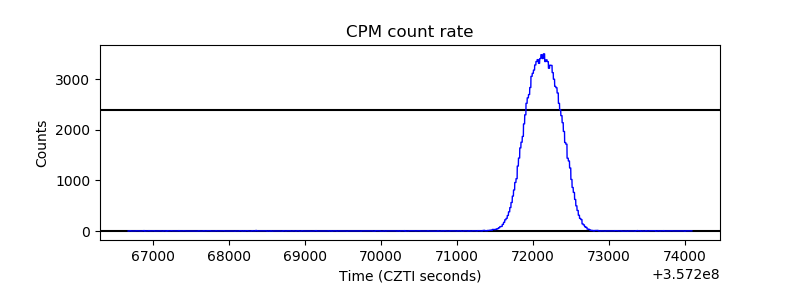 |
| CZT Counter | 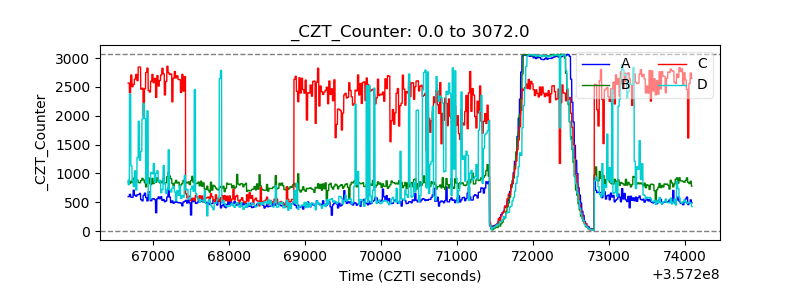 |
| +2.5 Volts monitor |  |
| +5 Volts monitor |  |
| _ROLL_ROT | 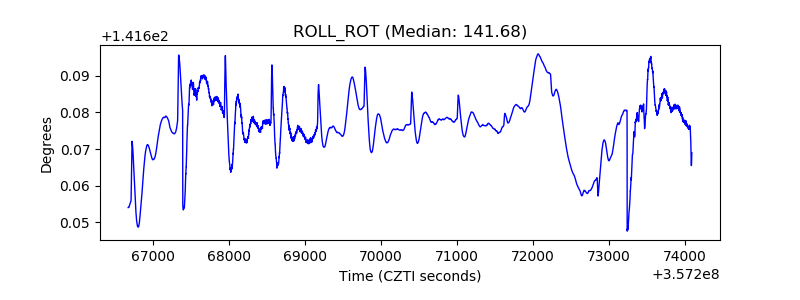 |
| _Roll_DEC | 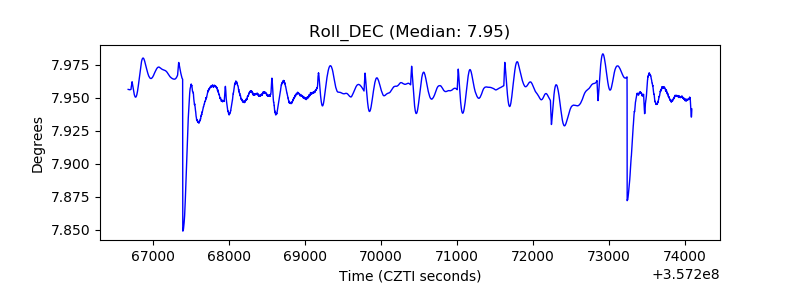 |
| _Roll_RA | 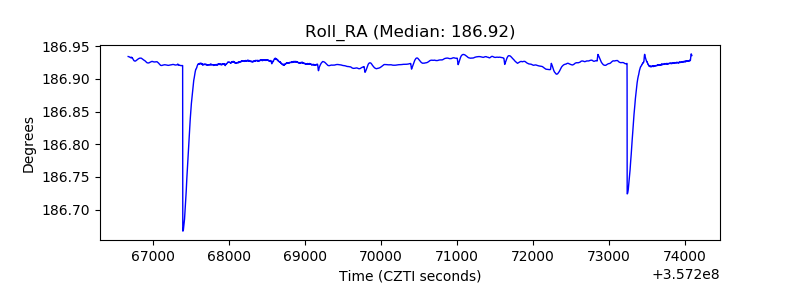 |
| Veto Counter | 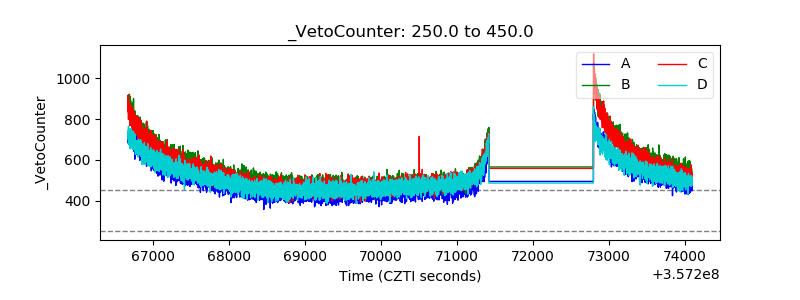 |