| Param | Original file | Final file |
|---|---|---|
| Filename | modeM0/AS1A10_102T01_9000004340_30181cztM0_level2.evt | modeM0/AS1A10_102T01_9000004340_30181cztM0_level2_quad_clean.evt |
| Size (bytes) | 962,112,960 | 70,657,920 |
| Size | 917.5 MB | 67.4 MB |
| Events in quadrant A | 3,256,261 | 522,510 |
| Events in quadrant B | 5,028,713 | 532,835 |
| Events in quadrant C | 15,186,116 | 212,479 |
| Events in quadrant D | 5,248,887 | 437,471 |
| Mode SS | |||
|---|---|---|---|
| Quadrant | BADHDUFLAG | Total packets | Discarded packets |
| A | 0 | 124 | 0 |
| B | 0 | 124 | 0 |
| C | 0 | 124 | 0 |
| D | 0 | 124 | 0 |
| Mode M9 | |||
|---|---|---|---|
| Quadrant | BADHDUFLAG | Total packets | Discarded packets |
| A | 0 | 19 | 0 |
| B | 0 | 20 | 0 |
| C | 0 | 20 | 0 |
| D | 0 | 20 | 0 |
| Mode M0 | |||
|---|---|---|---|
| Quadrant | BADHDUFLAG | Total packets | Discarded packets |
| A | 0 | 13168 | 2 |
| B | 0 | 18909 | 2 |
| C | 0 | 49328 | 2 |
| D | 0 | 19585 | 2 |
| Quadrant | Total seconds | Saturated seconds | Saturation percentage |
|---|---|---|---|
| A | 6193 | 28 | 0.452123% |
| B | 6193 | 71 | 1.146456% |
| C | 6193 | 6182 | 99.822380% |
| D | 6193 | 709 | 11.448409% |
Noise dominated data is calculated using 1-second bins in cleaned event files. If a bin has >2000 counts, and if more than 50% of those come from <1% of pixels, then it is considered to be noise-dominated and hence unusable.
| Quadrant | # 1 sec bins | Bins with >0 counts | Bins with >2000 counts | High rate bins dominated by noise | Noise dominated (total time) | Noise dominated (detector-on time) | Marked lightcurve |
|---|---|---|---|---|---|---|---|
| A | 7548 | 6194 | 1 | 1 | 0.01% | 0.02% | 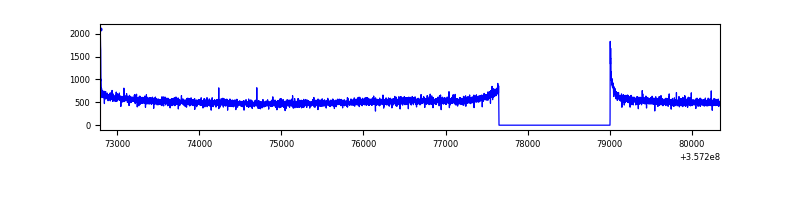 |
| B | 7548 | 6194 | 1 | 1 | 0.01% | 0.02% | 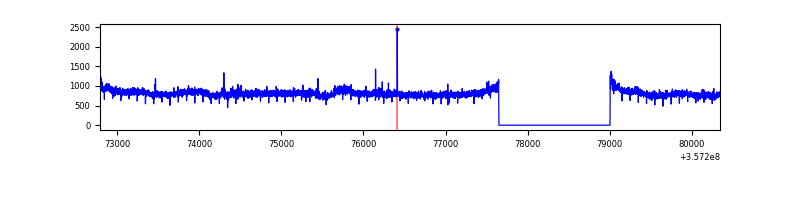 |
| C | 7547 | 6192 | 5722 | 5722 | 75.82% | 92.41% | 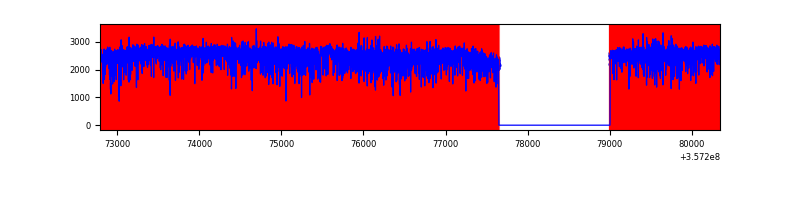 |
| D | 7548 | 6194 | 638 | 638 | 8.45% | 10.30% | 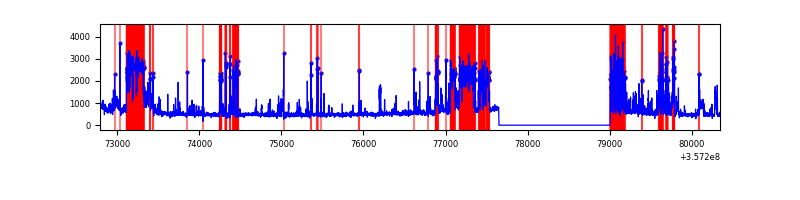 |
Top three noisy pixels from each quadrant. If the there are fewer than three noisy pixels in the level2.evt file, extra rows are filled as -1
| Pixel properties | Quadrant properties | ||||||
|---|---|---|---|---|---|---|---|
| Quadrant | DetID | PixID | Counts | Sigma | Mean | Median | Sigma |
| A | 8 | 192 | 22173 | 128.14 | 839 | 826 | 166.6 |
| A | 13 | 254 | 10214 | 56.35 | 839 | 826 | 166.6 |
| A | 3 | 137 | 7812 | 41.93 | 839 | 826 | 166.6 |
| B | 6 | 159 | 1703580 | 10860.86 | 837 | 818 | 156.8 |
| B | 0 | 229 | 32960 | 205.01 | 837 | 818 | 156.8 |
| B | 12 | 111 | 18966 | 115.75 | 837 | 818 | 156.8 |
| C | 3 | 233 | 13503688 | 143275.03 | 403 | 406 | 94.2 |
| C | 14 | 238 | 76344 | 805.73 | 403 | 406 | 94.2 |
| C | 14 | 254 | 22252 | 231.79 | 403 | 406 | 94.2 |
| D | 13 | 104 | 1480321 | 8316.09 | 752 | 737 | 177.9 |
| D | 1 | 52 | 687156 | 3858.06 | 752 | 737 | 177.9 |
| D | 8 | 195 | 150931 | 844.17 | 752 | 737 | 177.9 |
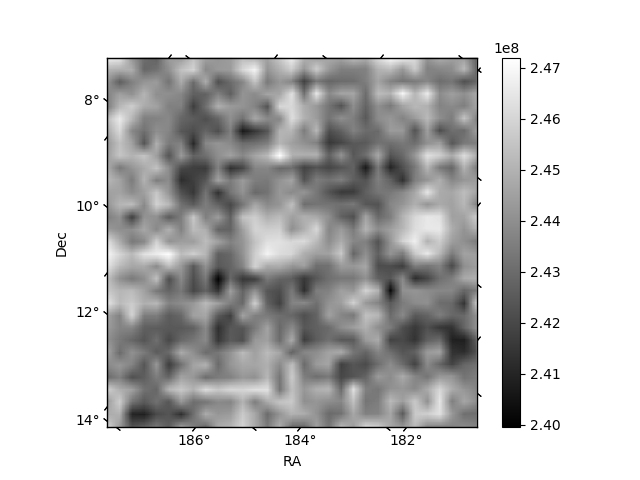
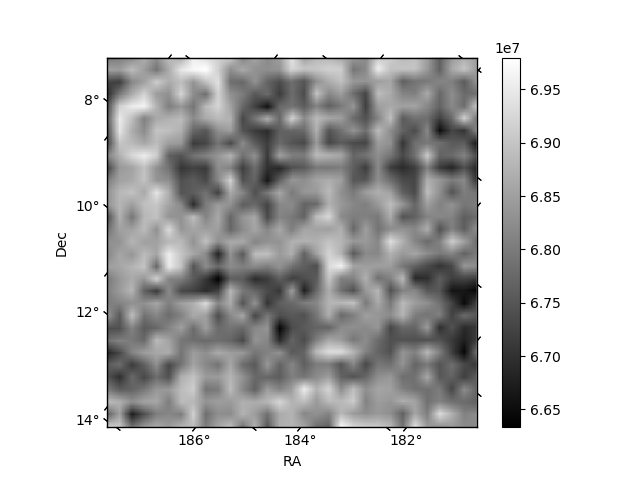
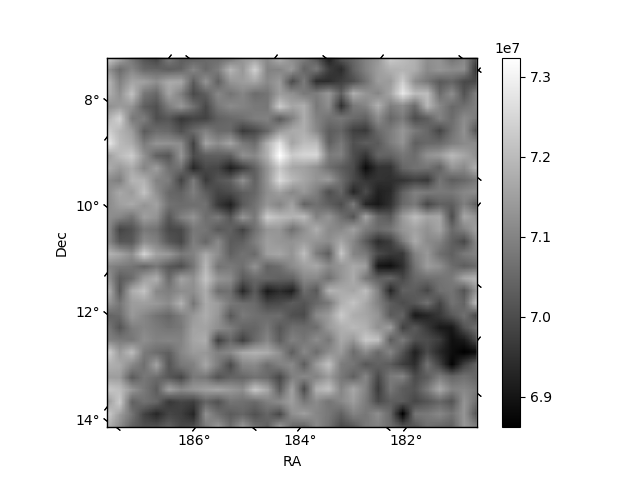
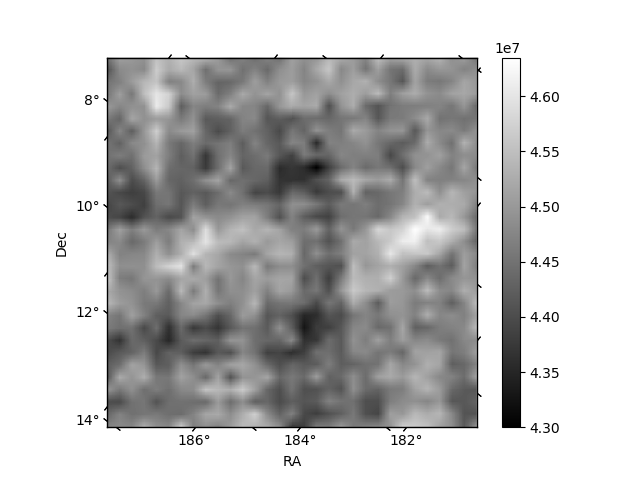
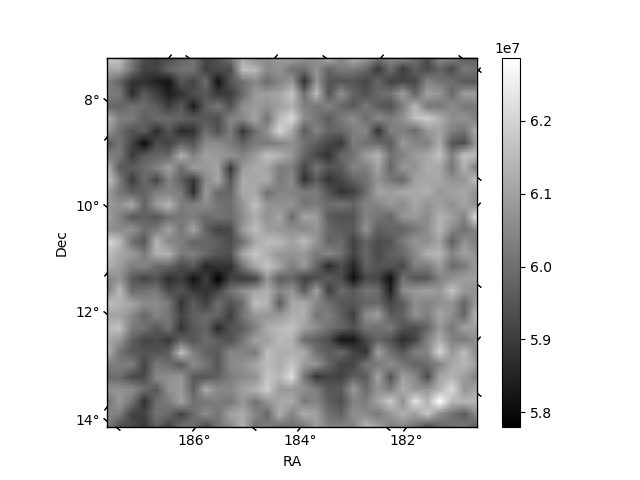
Histogram calculated using DETX and DETY for each event in the final _common_clean file
| Quadrant A | 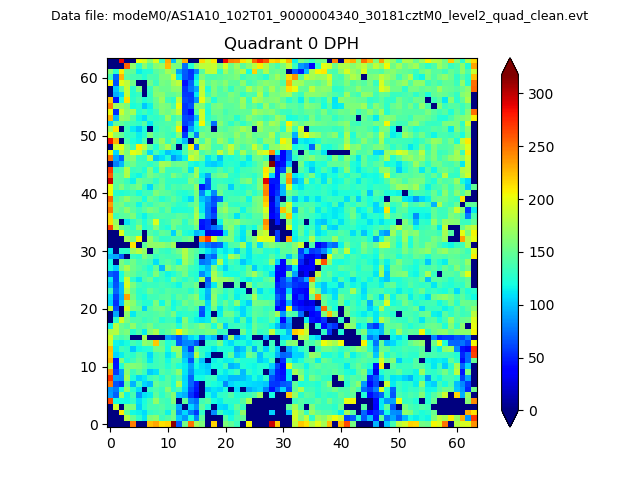 |
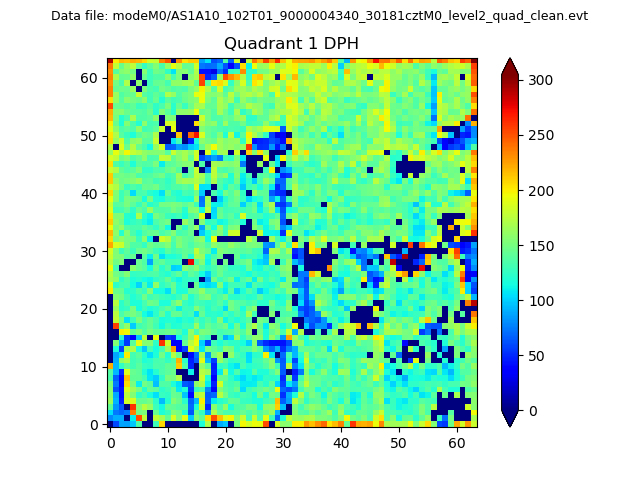 |
Quadrant B |
|---|---|---|---|
| Quadrant D | 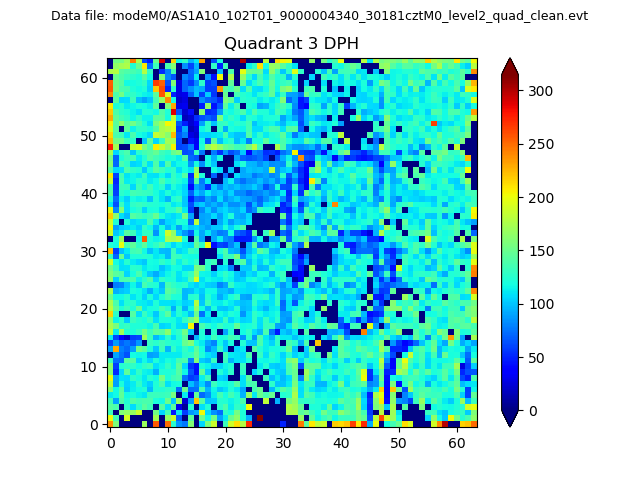 |
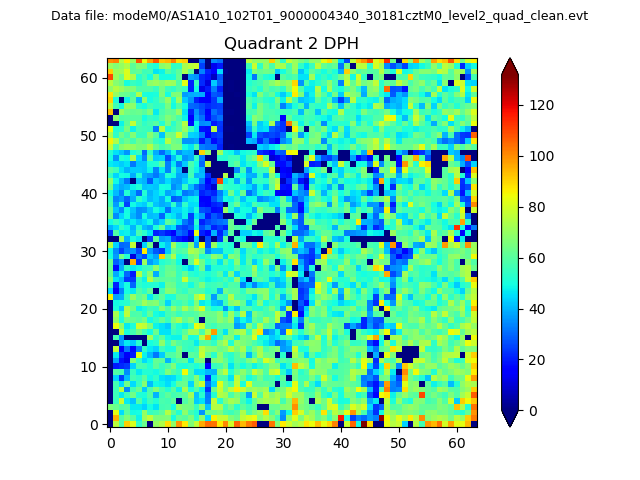 |
Quadrant C |
| Plot type | Count rate plots | Images |
|---|---|---|
| Comparison with Poisson distribution Blue bars denote a histogram of data divided into 1 sec bins. Red curve is a Poisson curve with rate = median count rate of data. |
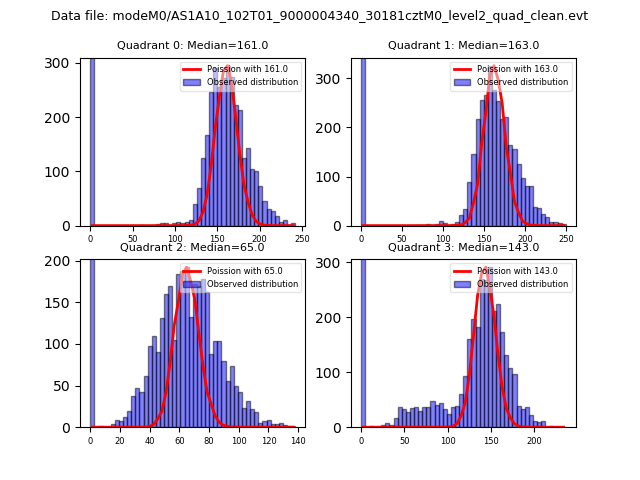 |
 |
| Quadrant-wise count rates Data is divided into 100 sec bins |
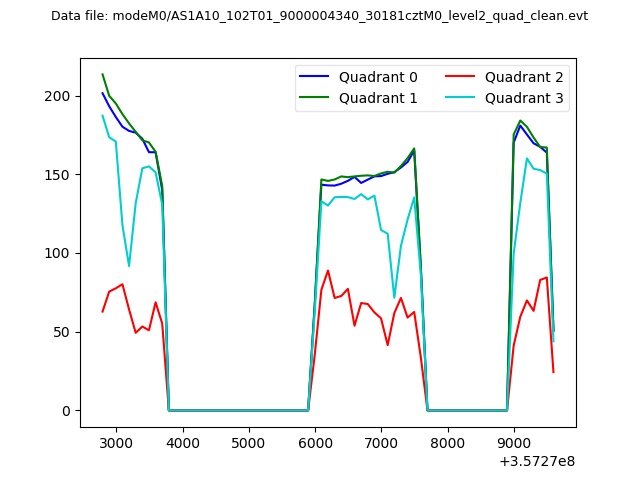 |
|
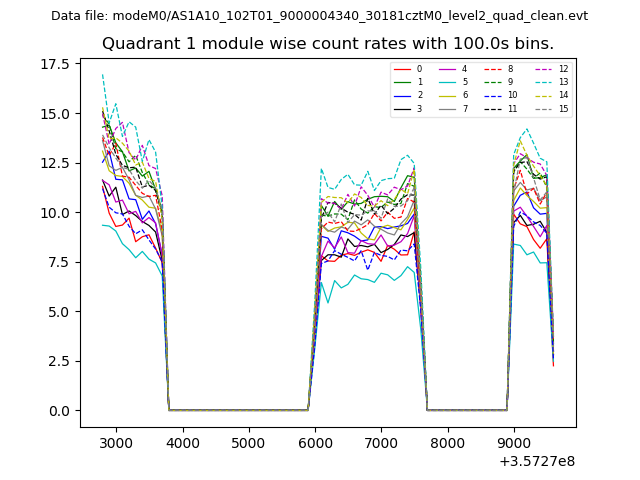
| Module-wise count rates for Quadrant A Data is divided into 100 sec bins |
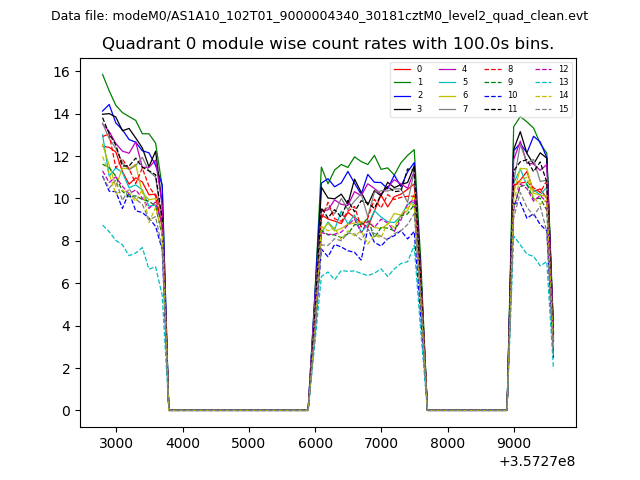 |
 |
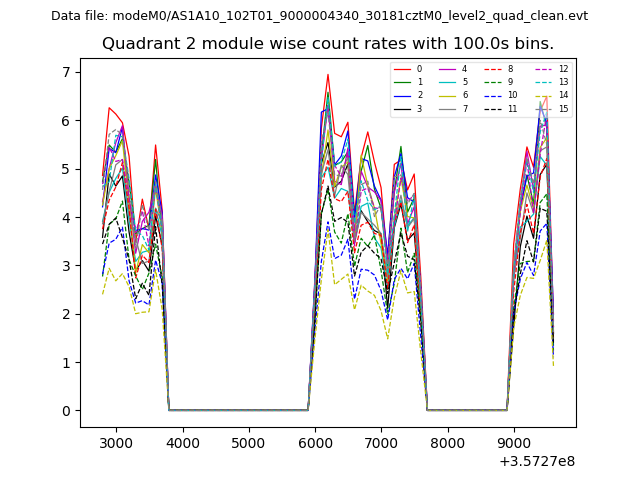
| Module-wise count rates for Quadrant B Data is divided into 100 sec bins |
 |
 |
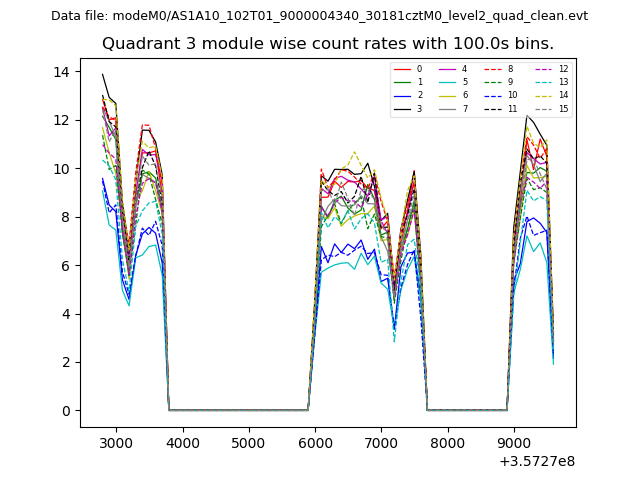
| Module-wise count rates for Quadrant C Data is divided into 100 sec bins |
 |
 |
| Module-wise count rates for Quadrant D Data is divided into 100 sec bins |
 |
 |
| Parameter | Plot |
|---|---|
| CZT HV Monitor | 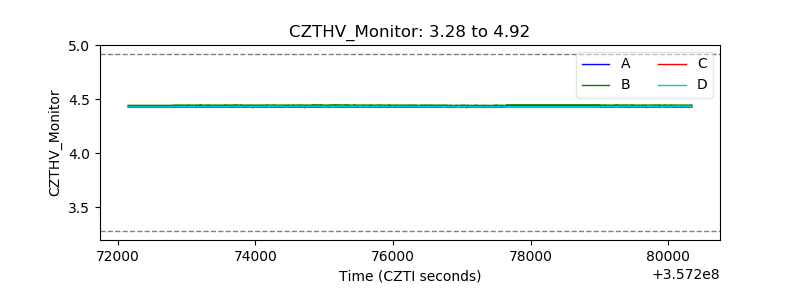 |
| D_VDD | 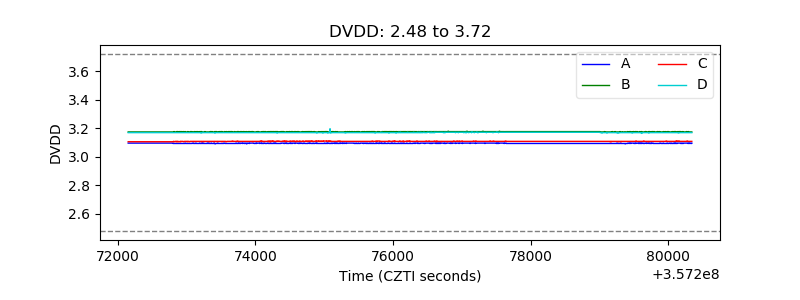 |
| Temperature 1 | 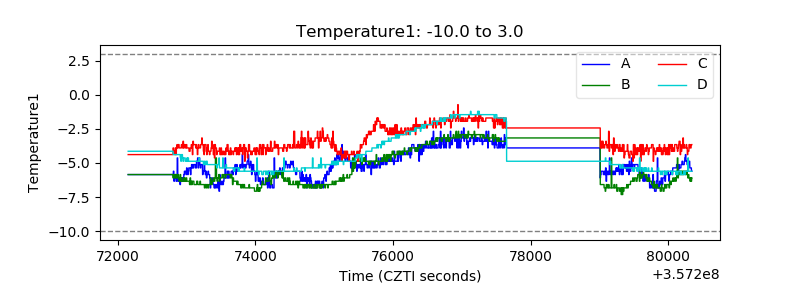 |
| Veto HV Monitor | 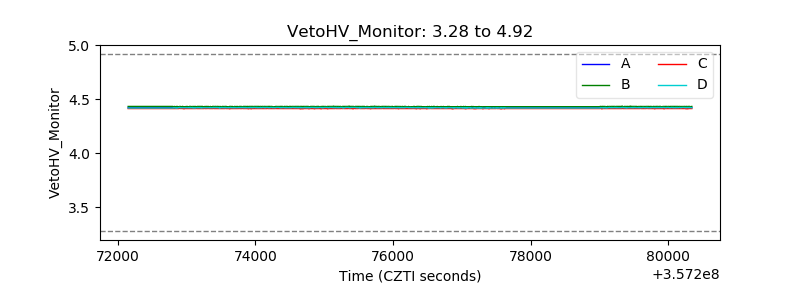 |
| Veto LLD | 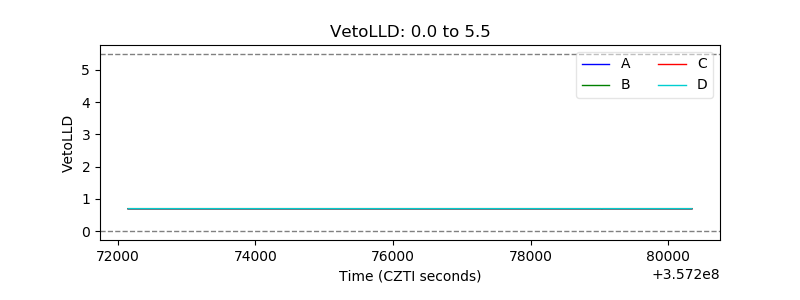 |
| Alpha Counter | 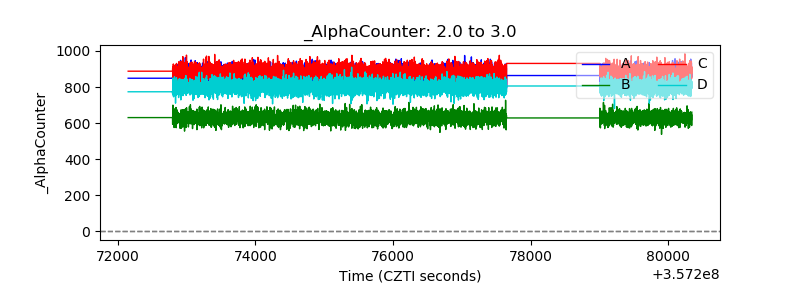 |
| _CPM_Rate | 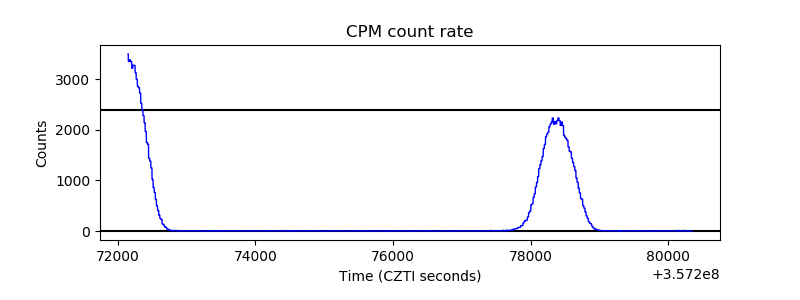 |
| CZT Counter | 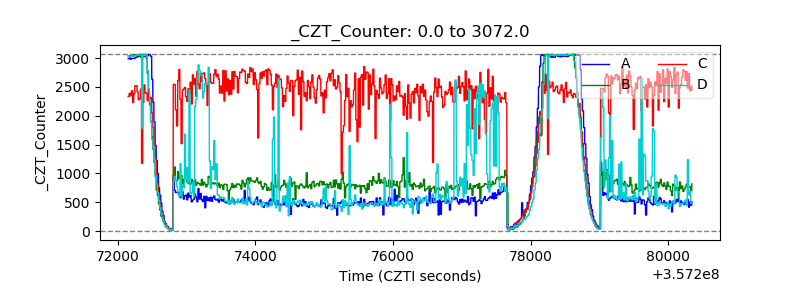 |
| +2.5 Volts monitor | 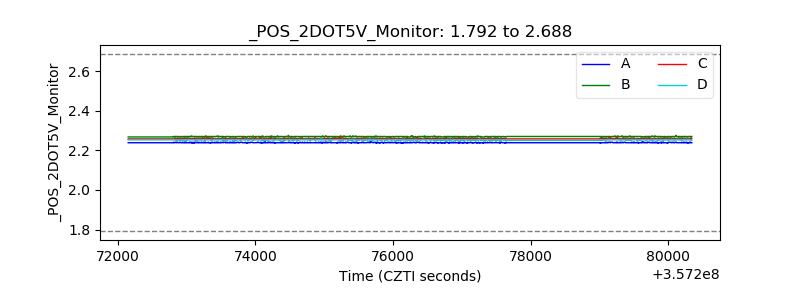 |
| +5 Volts monitor |  |
| _ROLL_ROT | 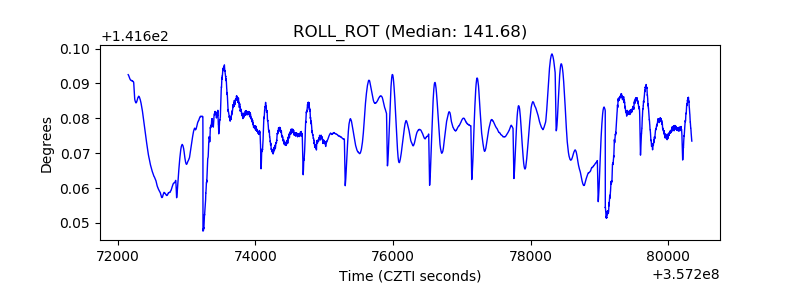 |
| _Roll_DEC | 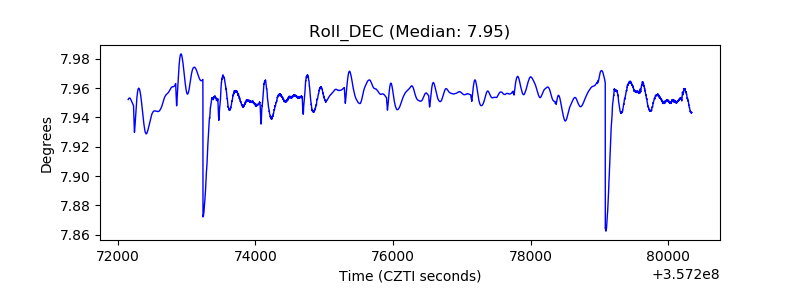 |
| _Roll_RA | 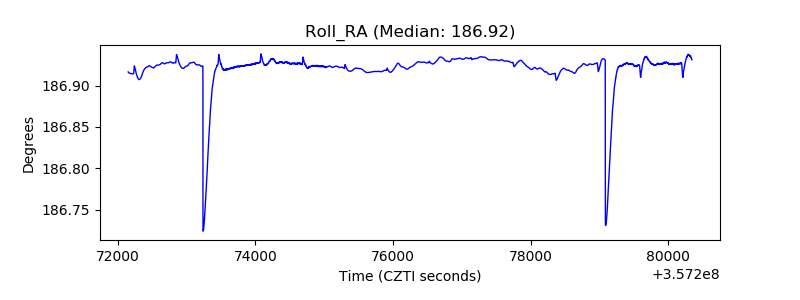 |
| Veto Counter | 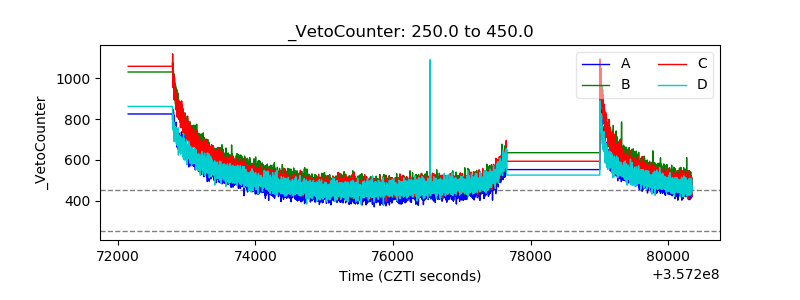 |