| Param | Original file | Final file |
|---|---|---|
| Filename | modeM0/AS1A10_102T01_9000004340_30182cztM0_level2.evt | modeM0/AS1A10_102T01_9000004340_30182cztM0_level2_quad_clean.evt |
| Size (bytes) | 976,155,840 | 65,738,880 |
| Size | 930.9 MB | 62.7 MB |
| Events in quadrant A | 3,366,264 | 466,224 |
| Events in quadrant B | 5,146,745 | 470,228 |
| Events in quadrant C | 15,227,913 | 211,381 |
| Events in quadrant D | 5,383,166 | 386,959 |
| Mode SS | |||
|---|---|---|---|
| Quadrant | BADHDUFLAG | Total packets | Discarded packets |
| A | 0 | 134 | 0 |
| B | 0 | 134 | 0 |
| C | 0 | 134 | 0 |
| D | 0 | 134 | 0 |
| Mode M9 | |||
|---|---|---|---|
| Quadrant | BADHDUFLAG | Total packets | Discarded packets |
| A | 0 | 15 | 0 |
| B | 0 | 16 | 0 |
| C | 0 | 16 | 0 |
| D | 0 | 16 | 0 |
| Mode M0 | |||
|---|---|---|---|
| Quadrant | BADHDUFLAG | Total packets | Discarded packets |
| A | 0 | 13692 | 2 |
| B | 0 | 19802 | 2 |
| C | 0 | 49640 | 8 |
| D | 0 | 20216 | 2 |
| Quadrant | Total seconds | Saturated seconds | Saturation percentage |
|---|---|---|---|
| A | 6497 | 68 | 1.046637% |
| B | 6497 | 170 | 2.616592% |
| C | 6496 | 6179 | 95.120074% |
| D | 6496 | 790 | 12.161330% |
Noise dominated data is calculated using 1-second bins in cleaned event files. If a bin has >2000 counts, and if more than 50% of those come from <1% of pixels, then it is considered to be noise-dominated and hence unusable.
| Quadrant | # 1 sec bins | Bins with >0 counts | Bins with >2000 counts | High rate bins dominated by noise | Noise dominated (total time) | Noise dominated (detector-on time) | Marked lightcurve |
|---|---|---|---|---|---|---|---|
| A | 7647 | 6499 | 0 | 0 | 0.00% | 0.00% | 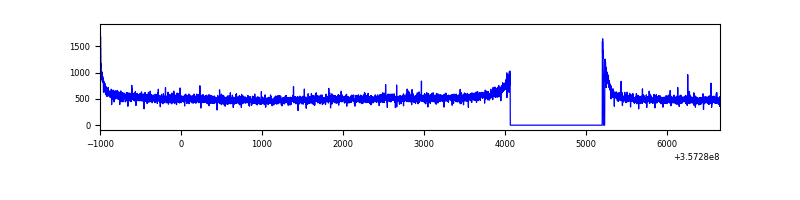 |
| B | 7647 | 6499 | 0 | 0 | 0.00% | 0.00% | 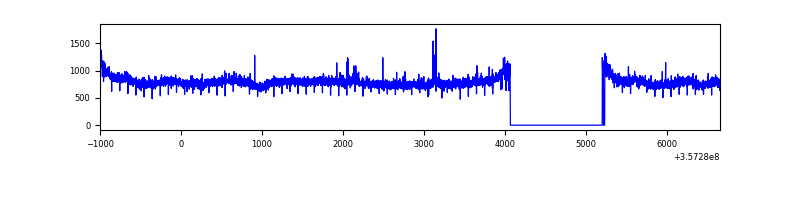 |
| C | 7646 | 6496 | 5470 | 5470 | 71.54% | 84.21% | 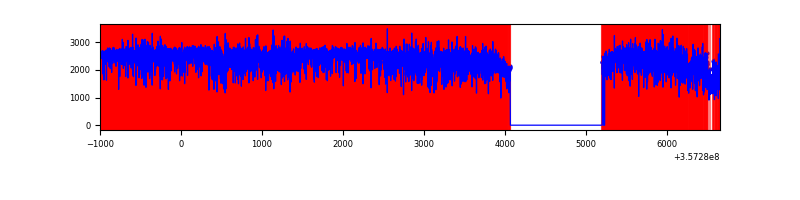 |
| D | 7646 | 6497 | 586 | 586 | 7.66% | 9.02% | 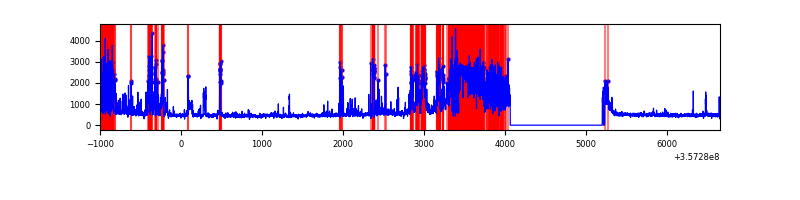 |
Top three noisy pixels from each quadrant. If the there are fewer than three noisy pixels in the level2.evt file, extra rows are filled as -1
| Pixel properties | Quadrant properties | ||||||
|---|---|---|---|---|---|---|---|
| Quadrant | DetID | PixID | Counts | Sigma | Mean | Median | Sigma |
| A | 8 | 192 | 18125 | 99.49 | 868 | 851 | 173.6 |
| A | 13 | 254 | 10309 | 54.48 | 868 | 851 | 173.6 |
| A | 3 | 137 | 8408 | 43.53 | 868 | 851 | 173.6 |
| B | 6 | 159 | 1737729 | 10538.85 | 863 | 843 | 164.8 |
| B | 0 | 190 | 21403 | 124.75 | 863 | 843 | 164.8 |
| B | 12 | 111 | 20201 | 117.45 | 863 | 843 | 164.8 |
| C | 3 | 233 | 13203201 | 114110.08 | 494 | 497 | 115.7 |
| C | 14 | 238 | 77315 | 663.93 | 494 | 497 | 115.7 |
| C | 15 | 208 | 11877 | 98.36 | 494 | 497 | 115.7 |
| D | 1 | 52 | 1189094 | 6364.44 | 782 | 766 | 186.7 |
| D | 13 | 104 | 1031155 | 5518.55 | 782 | 766 | 186.7 |
| D | 8 | 195 | 152682 | 813.63 | 782 | 766 | 186.7 |
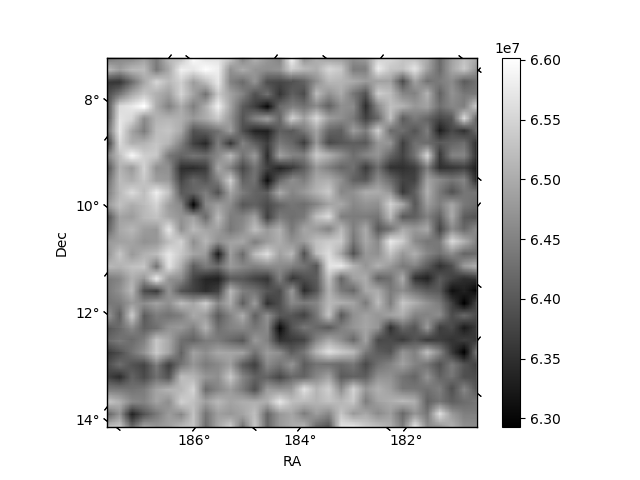
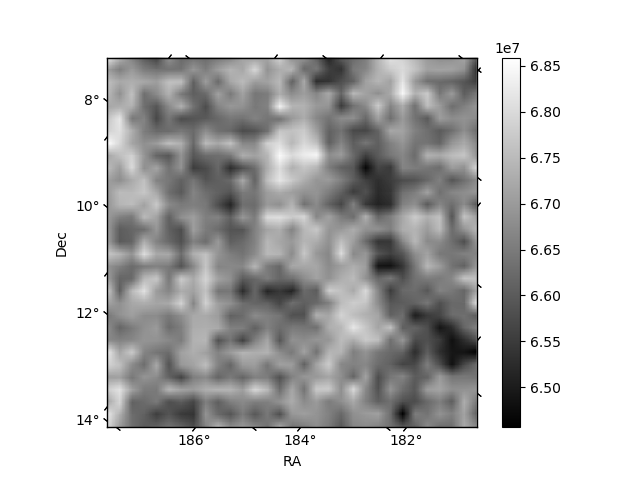
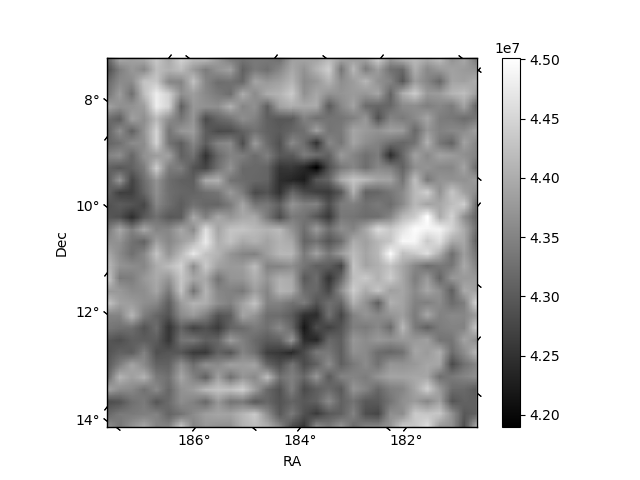
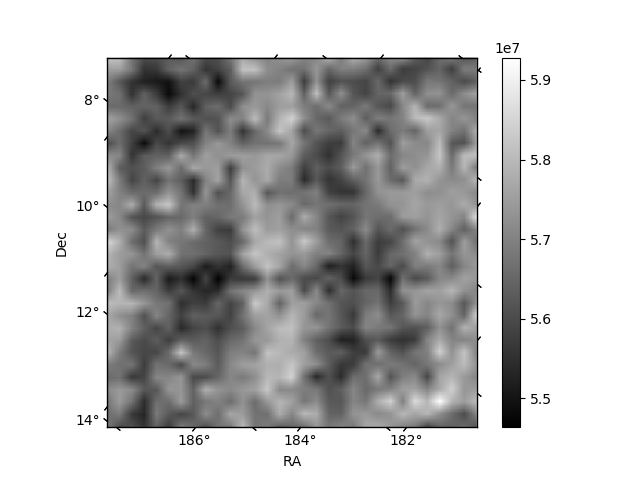
Histogram calculated using DETX and DETY for each event in the final _common_clean file
| Quadrant A | 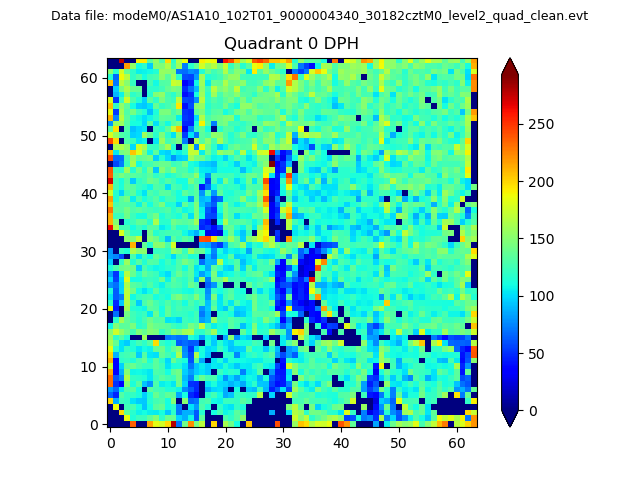 |
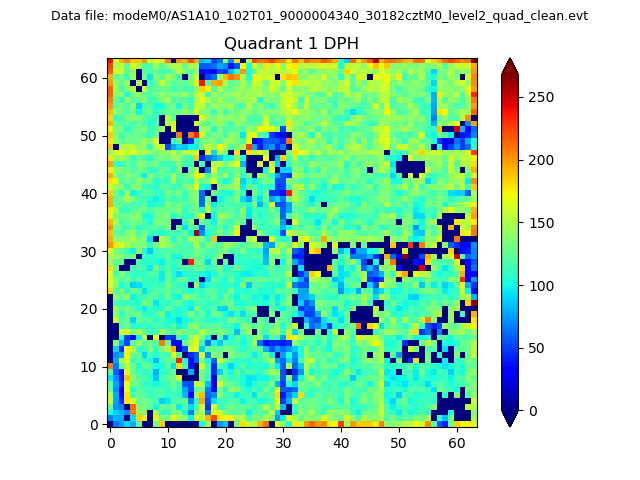 |
Quadrant B |
|---|---|---|---|
| Quadrant D | 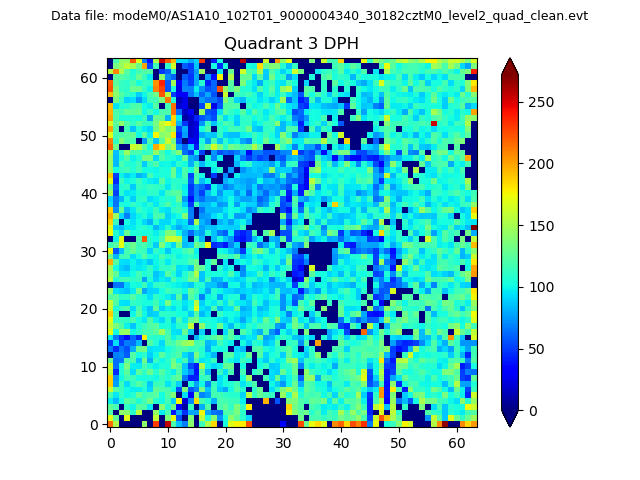 |
 |
Quadrant C |
| Plot type | Count rate plots | Images |
|---|---|---|
| Comparison with Poisson distribution Blue bars denote a histogram of data divided into 1 sec bins. Red curve is a Poisson curve with rate = median count rate of data. |
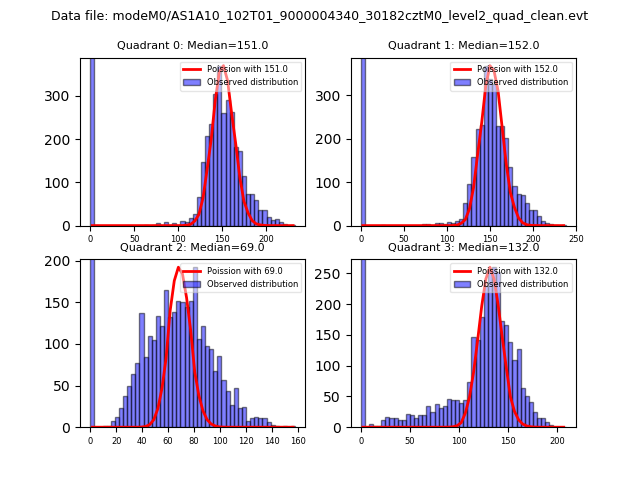 |
 |
| Quadrant-wise count rates Data is divided into 100 sec bins |
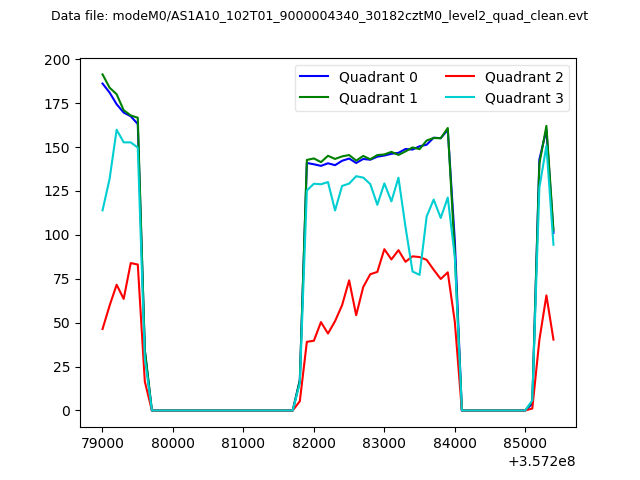 |
|
| Module-wise count rates for Quadrant A Data is divided into 100 sec bins |
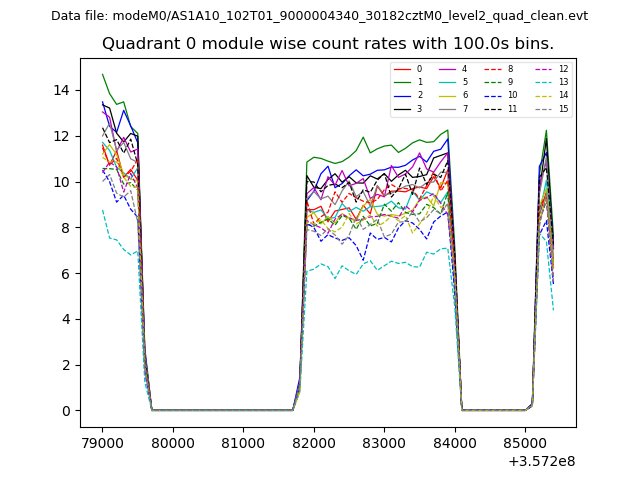 |
 |
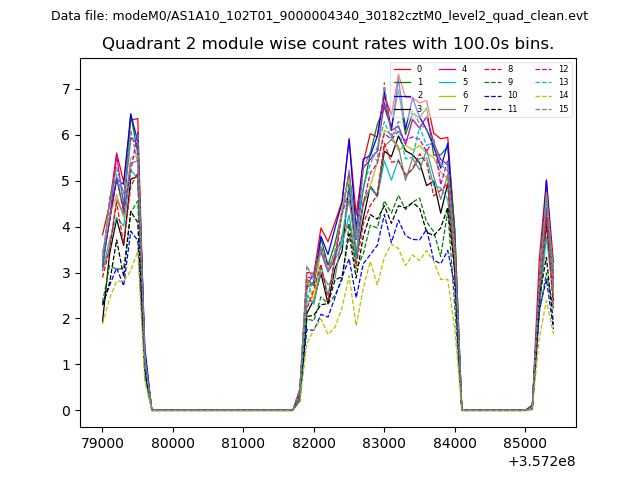
| Module-wise count rates for Quadrant B Data is divided into 100 sec bins |
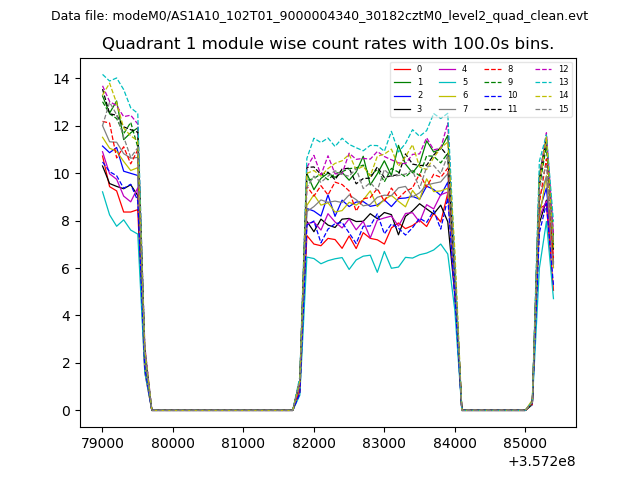 |
 |
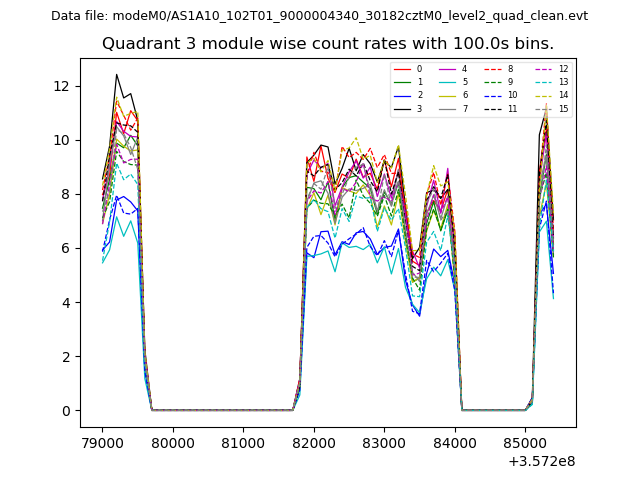
| Module-wise count rates for Quadrant C Data is divided into 100 sec bins |
 |
 |
| Module-wise count rates for Quadrant D Data is divided into 100 sec bins |
 |
 |
| Parameter | Plot |
|---|---|
| CZT HV Monitor | 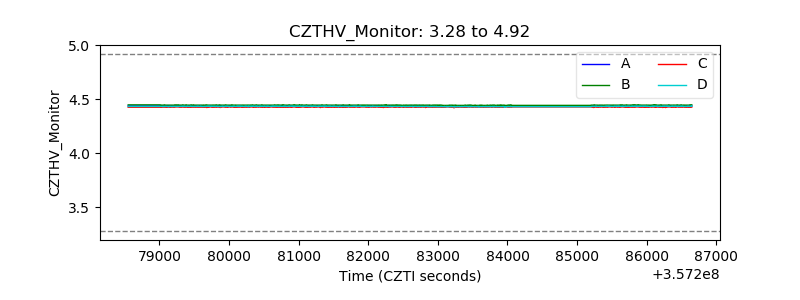 |
| D_VDD | 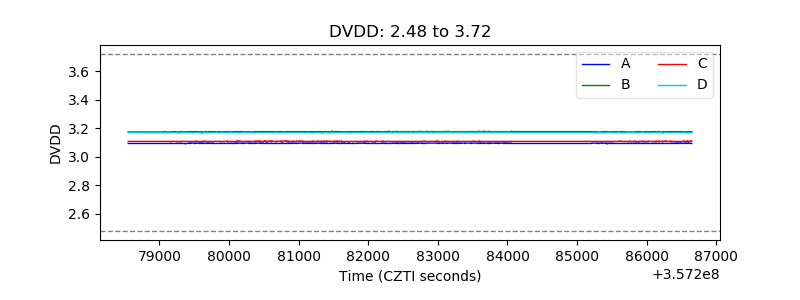 |
| Temperature 1 | 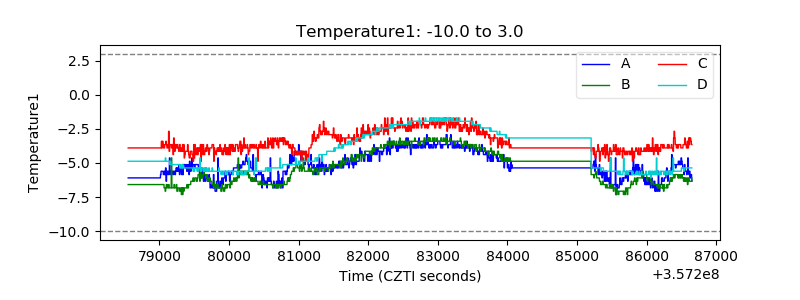 |
| Veto HV Monitor | 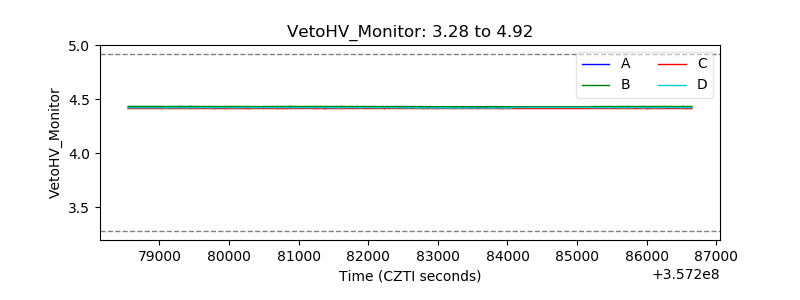 |
| Veto LLD | 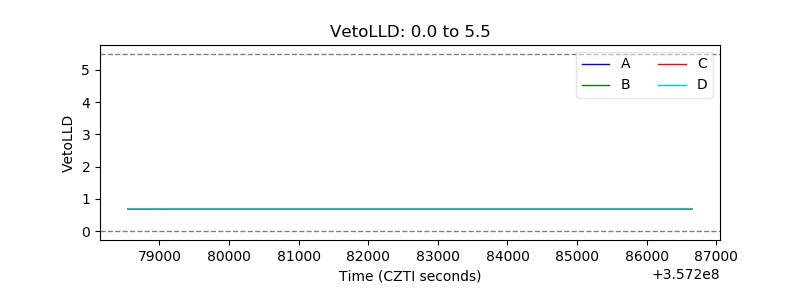 |
| Alpha Counter | 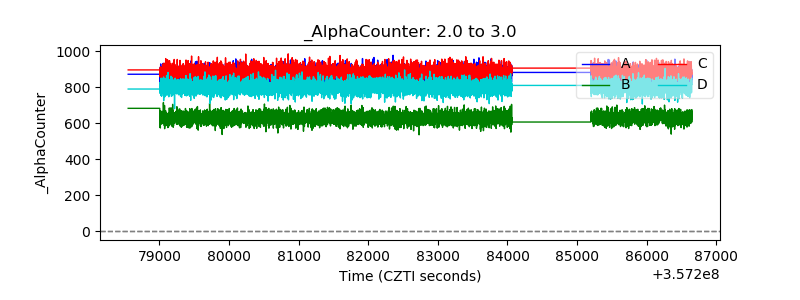 |
| _CPM_Rate | 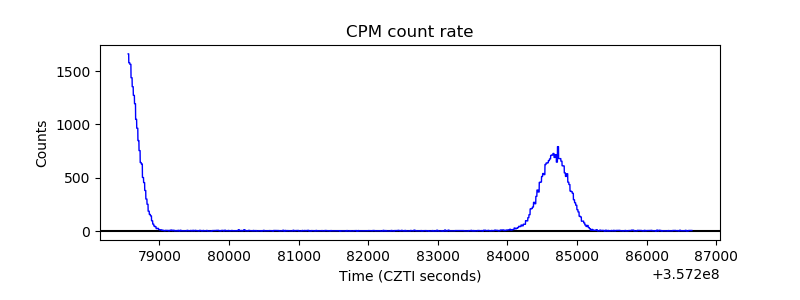 |
| CZT Counter |  |
| +2.5 Volts monitor |  |
| +5 Volts monitor |  |
| _ROLL_ROT |  |
| _Roll_DEC | 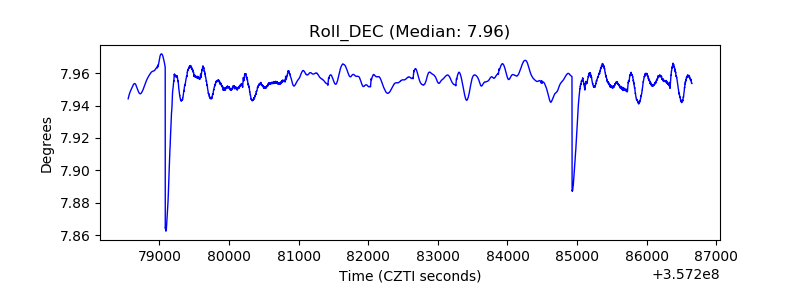 |
| _Roll_RA |  |
| Veto Counter |  |