| Param | Original file | Final file |
|---|---|---|
| Filename | modeM0/AS1A10_102T01_9000004340_30183cztM0_level2.evt | modeM0/AS1A10_102T01_9000004340_30183cztM0_level2_quad_clean.evt |
| Size (bytes) | 918,426,240 | 68,855,040 |
| Size | 875.9 MB | 65.7 MB |
| Events in quadrant A | 3,433,086 | 443,488 |
| Events in quadrant B | 5,323,150 | 444,630 |
| Events in quadrant C | 14,586,108 | 300,379 |
| Events in quadrant D | 4,007,479 | 415,470 |
| Mode SS | |||
|---|---|---|---|
| Quadrant | BADHDUFLAG | Total packets | Discarded packets |
| A | 0 | 140 | 0 |
| B | 0 | 140 | 0 |
| C | 0 | 140 | 0 |
| D | 0 | 140 | 0 |
| Mode M9 | |||
|---|---|---|---|
| Quadrant | BADHDUFLAG | Total packets | Discarded packets |
| A | 0 | 8 | 0 |
| B | 0 | 8 | 0 |
| C | 0 | 8 | 0 |
| D | 0 | 8 | 0 |
| Mode M0 | |||
|---|---|---|---|
| Quadrant | BADHDUFLAG | Total packets | Discarded packets |
| A | 0 | 14312 | 2 |
| B | 0 | 20909 | 2 |
| C | 0 | 48052 | 2 |
| D | 0 | 16286 | 2 |
| Quadrant | Total seconds | Saturated seconds | Saturation percentage |
|---|---|---|---|
| A | 6880 | 110 | 1.598837% |
| B | 6880 | 201 | 2.921512% |
| C | 6881 | 5375 | 78.113646% |
| D | 6881 | 187 | 2.717628% |
Noise dominated data is calculated using 1-second bins in cleaned event files. If a bin has >2000 counts, and if more than 50% of those come from <1% of pixels, then it is considered to be noise-dominated and hence unusable.
| Quadrant | # 1 sec bins | Bins with >0 counts | Bins with >2000 counts | High rate bins dominated by noise | Noise dominated (total time) | Noise dominated (detector-on time) | Marked lightcurve |
|---|---|---|---|---|---|---|---|
| A | 7660 | 6880 | 0 | 0 | 0.00% | 0.00% | 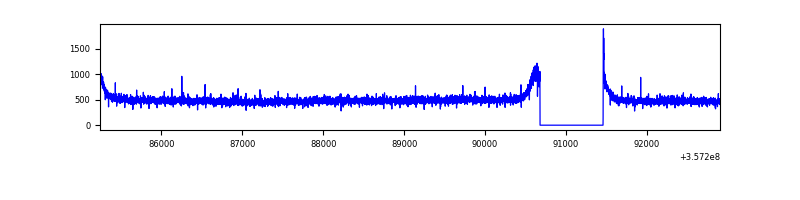 |
| B | 7660 | 6880 | 3 | 3 | 0.04% | 0.04% | 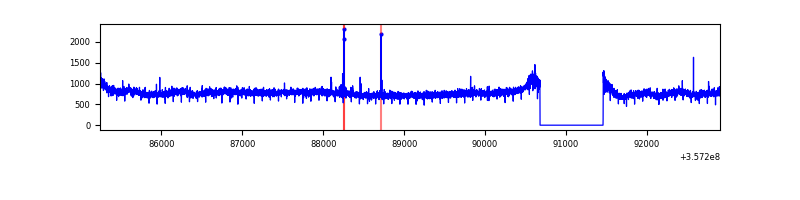 |
| C | 7661 | 6881 | 4328 | 4328 | 56.49% | 62.90% | 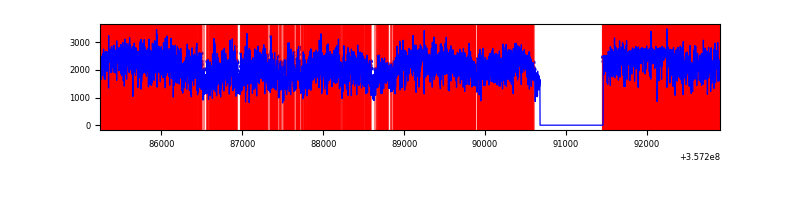 |
| D | 7661 | 6882 | 87 | 87 | 1.14% | 1.26% | 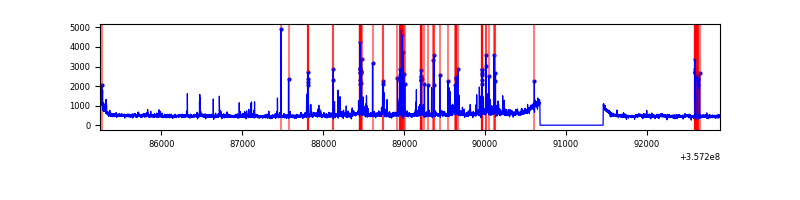 |
Top three noisy pixels from each quadrant. If the there are fewer than three noisy pixels in the level2.evt file, extra rows are filled as -1
| Pixel properties | Quadrant properties | ||||||
|---|---|---|---|---|---|---|---|
| Quadrant | DetID | PixID | Counts | Sigma | Mean | Median | Sigma |
| A | 13 | 254 | 11238 | 57.99 | 888 | 869 | 178.8 |
| A | 8 | 192 | 10911 | 56.16 | 888 | 869 | 178.8 |
| A | 3 | 137 | 8841 | 44.58 | 888 | 869 | 178.8 |
| B | 6 | 159 | 1852386 | 10801.06 | 878 | 858 | 171.4 |
| B | 12 | 111 | 21630 | 121.18 | 878 | 858 | 171.4 |
| B | 11 | 111 | 19718 | 110.02 | 878 | 858 | 171.4 |
| C | 3 | 233 | 11958848 | 79469.99 | 641 | 644 | 150.5 |
| C | 14 | 238 | 100523 | 663.76 | 641 | 644 | 150.5 |
| C | 2 | 114 | 12444 | 78.42 | 641 | 644 | 150.5 |
| D | 1 | 52 | 365946 | 1809.9 | 843 | 825 | 201.7 |
| D | 8 | 195 | 193623 | 955.7 | 843 | 825 | 201.7 |
| D | 13 | 104 | 138011 | 680.03 | 843 | 825 | 201.7 |
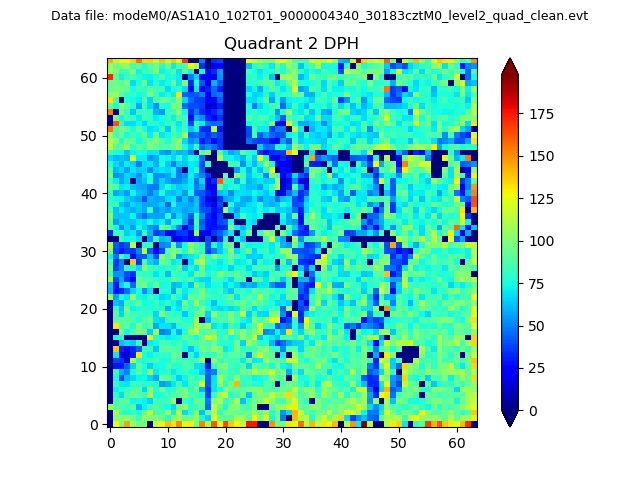
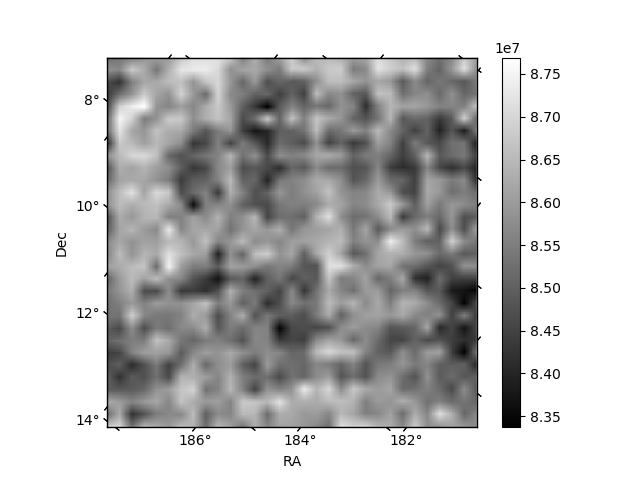
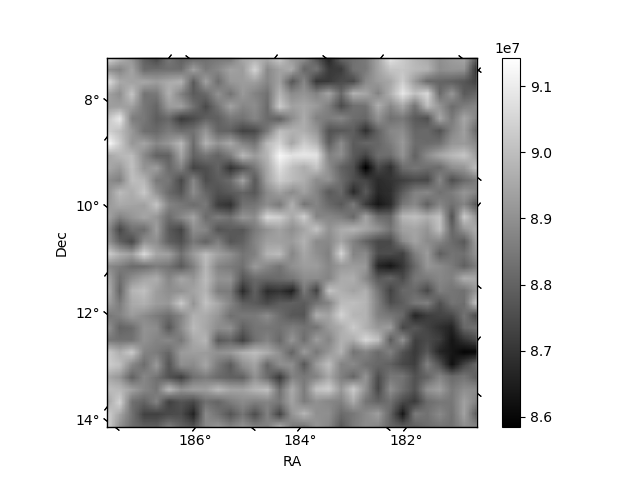
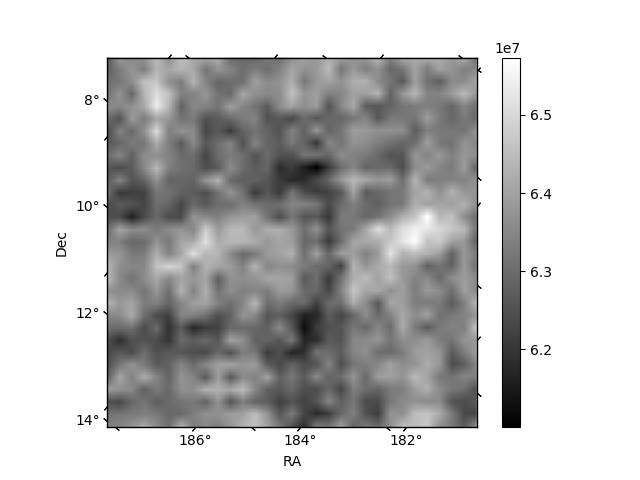
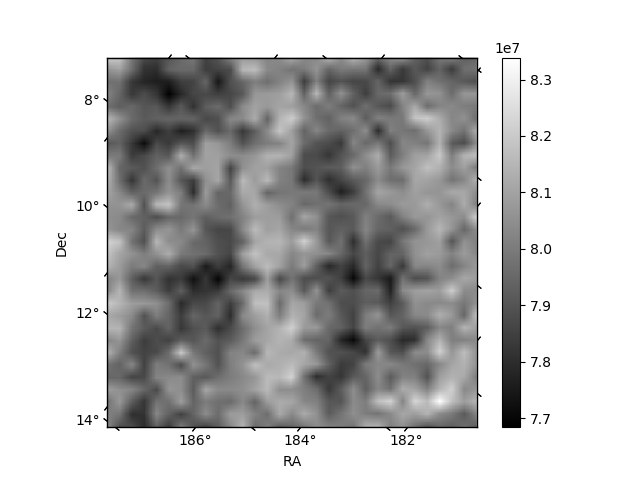
Histogram calculated using DETX and DETY for each event in the final _common_clean file
| Quadrant A | 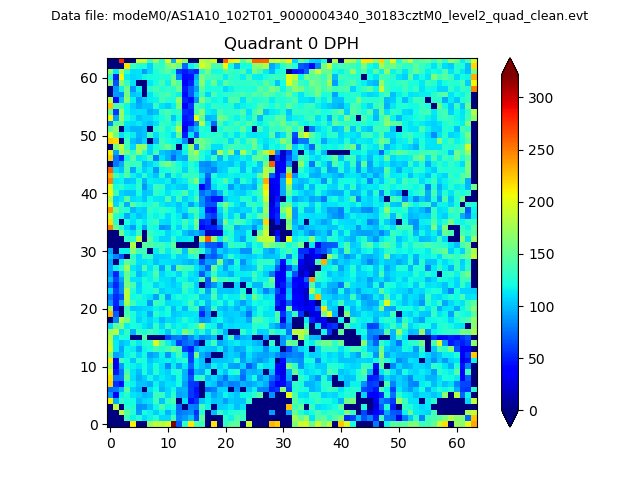 |
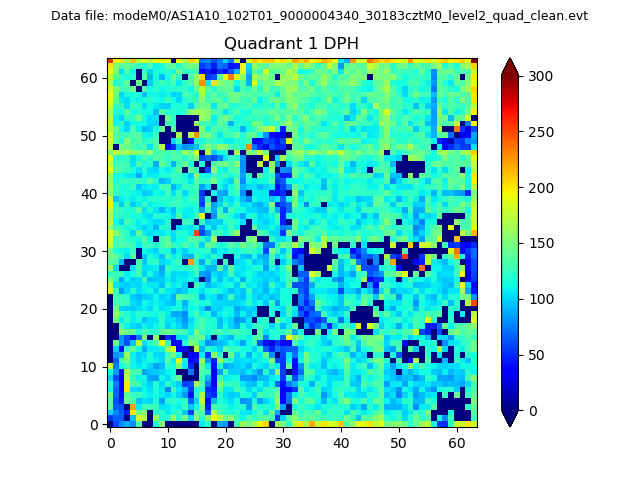 |
Quadrant B |
|---|---|---|---|
| Quadrant D | 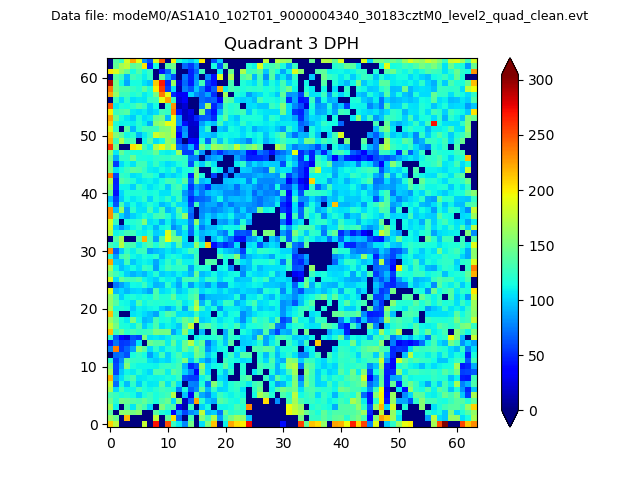 |
 |
Quadrant C |
| Plot type | Count rate plots | Images |
|---|---|---|
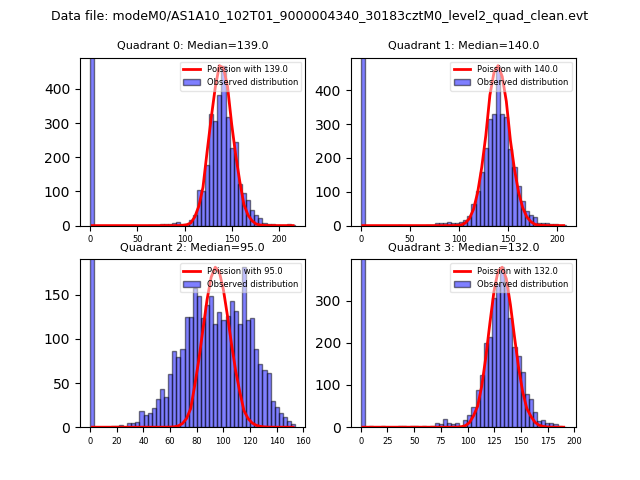
| Comparison with Poisson distribution Blue bars denote a histogram of data divided into 1 sec bins. Red curve is a Poisson curve with rate = median count rate of data. |
 |
 |
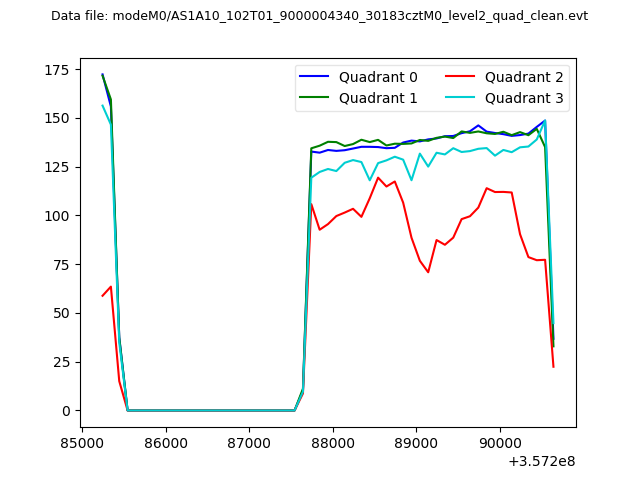
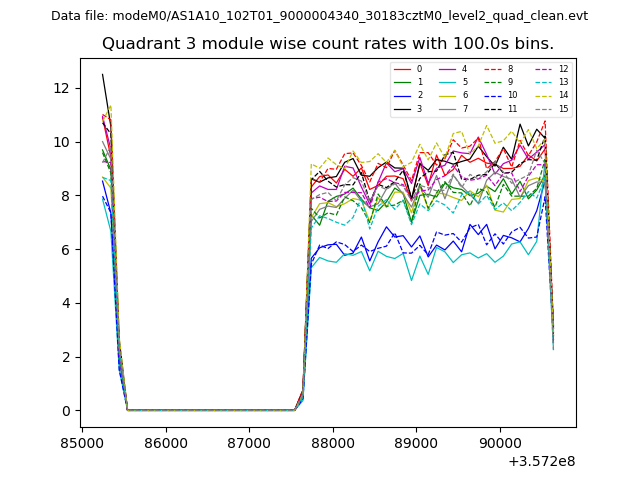
| Quadrant-wise count rates Data is divided into 100 sec bins |
 |
|
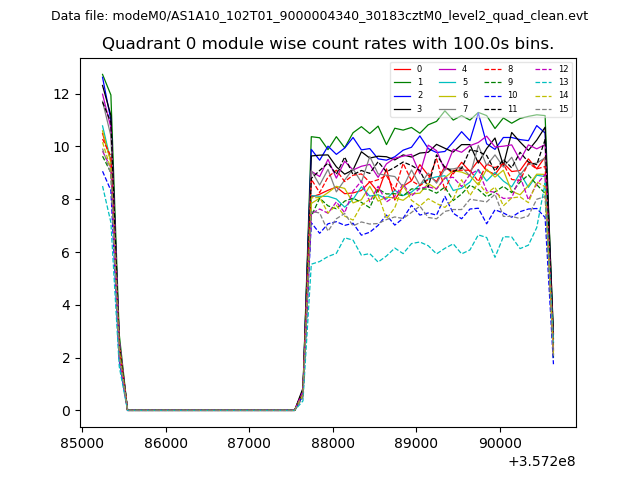
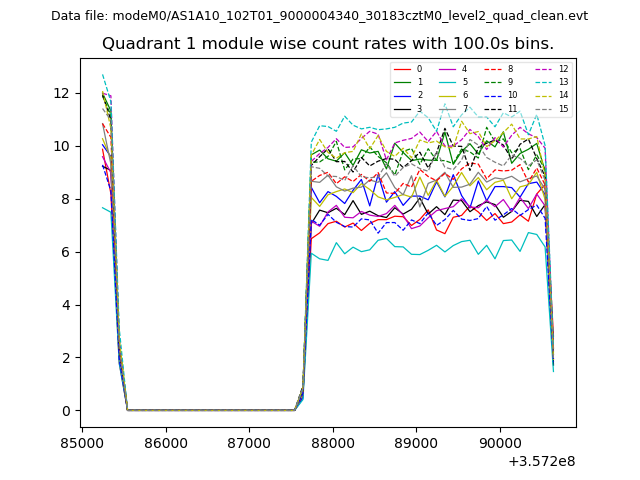
| Module-wise count rates for Quadrant A Data is divided into 100 sec bins |
 |
 |
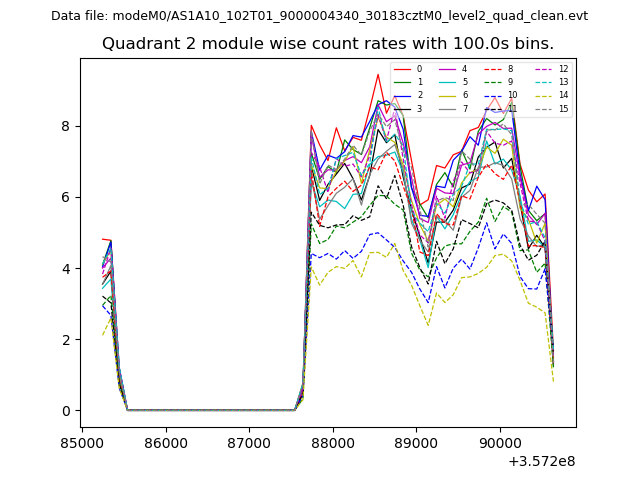
| Module-wise count rates for Quadrant B Data is divided into 100 sec bins |
 |
 |
| Module-wise count rates for Quadrant C Data is divided into 100 sec bins |
 |
 |
| Module-wise count rates for Quadrant D Data is divided into 100 sec bins |
 |
 |
| Parameter | Plot |
|---|---|
| CZT HV Monitor | 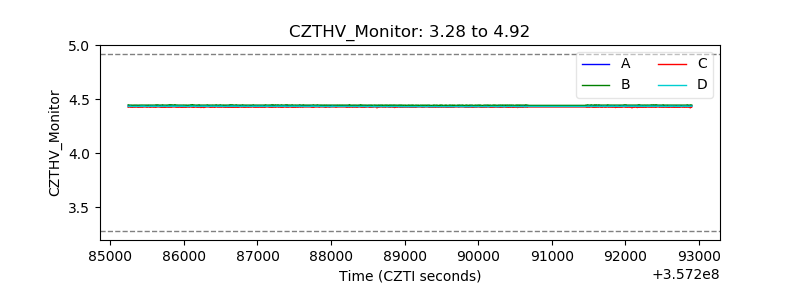 |
| D_VDD | 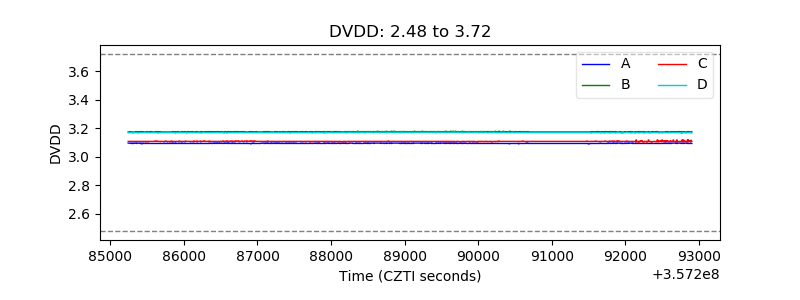 |
| Temperature 1 | 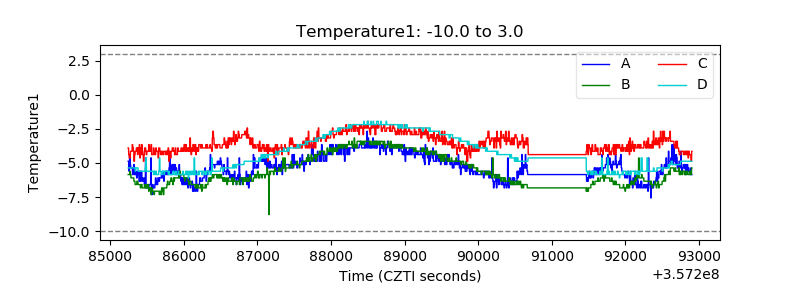 |
| Veto HV Monitor |  |
| Veto LLD | 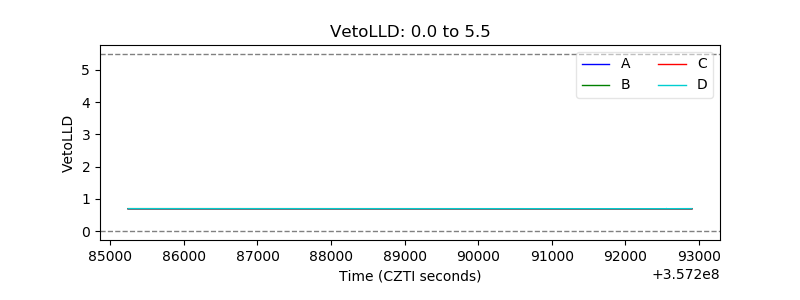 |
| Alpha Counter | 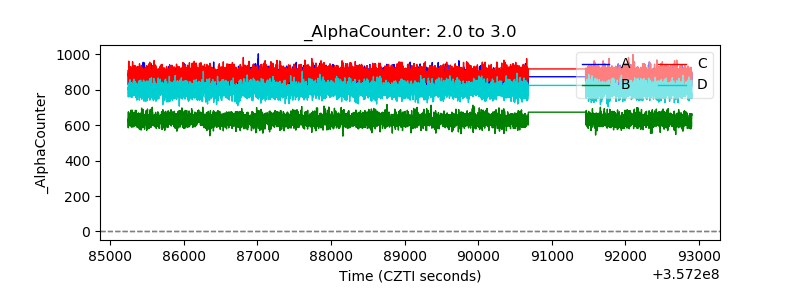 |
| _CPM_Rate | 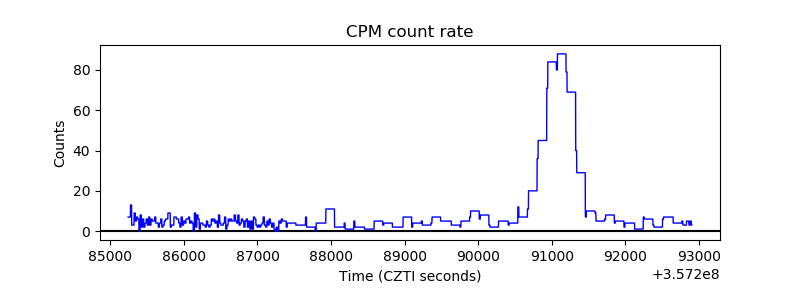 |
| CZT Counter | 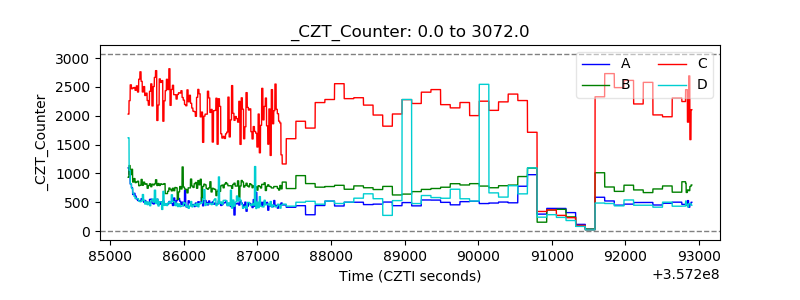 |
| +2.5 Volts monitor | 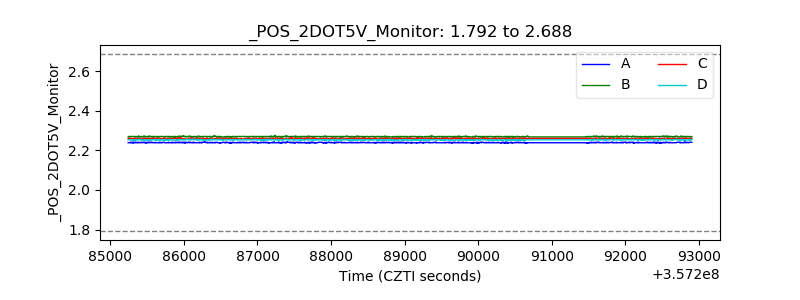 |
| +5 Volts monitor |  |
| _ROLL_ROT | 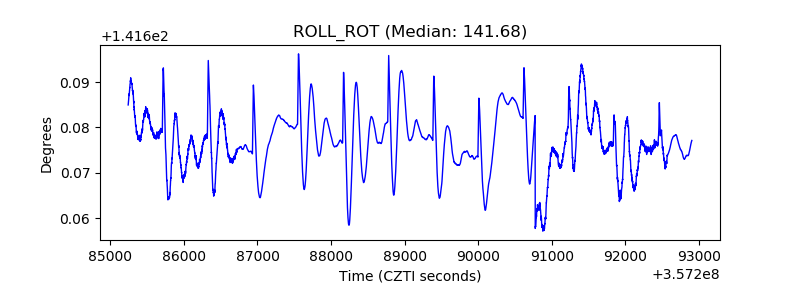 |
| _Roll_DEC | 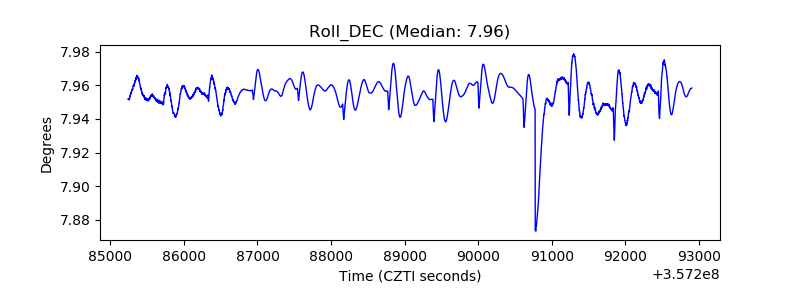 |
| _Roll_RA | 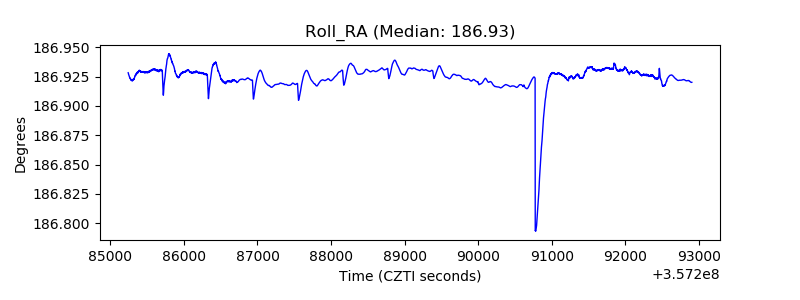 |
| Veto Counter | 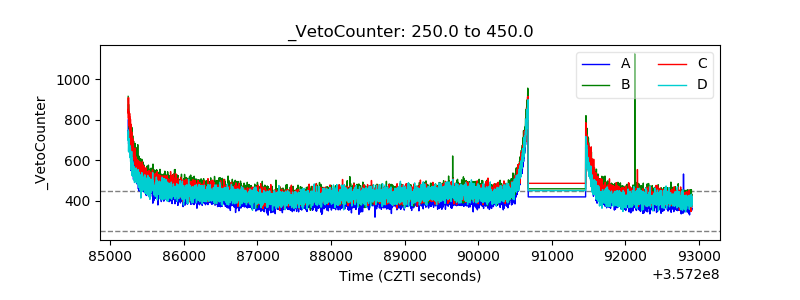 |