| Param | Original file | Final file |
|---|---|---|
| Filename | modeM0/AS1A10_102T01_9000004340_30184cztM0_level2.evt | modeM0/AS1A10_102T01_9000004340_30184cztM0_level2_quad_clean.evt |
| Size (bytes) | 917,691,840 | 77,803,200 |
| Size | 875.2 MB | 74.2 MB |
| Events in quadrant A | 3,767,780 | 482,471 |
| Events in quadrant B | 5,812,438 | 479,669 |
| Events in quadrant C | 13,100,067 | 413,594 |
| Events in quadrant D | 4,601,468 | 453,023 |
| Mode SS | |||
|---|---|---|---|
| Quadrant | BADHDUFLAG | Total packets | Discarded packets |
| A | 0 | 158 | 0 |
| B | 0 | 158 | 0 |
| C | 0 | 158 | 0 |
| D | 0 | 158 | 0 |
| Mode M9 | |||
|---|---|---|---|
| Quadrant | BADHDUFLAG | Total packets | Discarded packets |
| A | 0 | 10 | 0 |
| B | 0 | 10 | 0 |
| C | 0 | 10 | 0 |
| D | 0 | 10 | 0 |
| Mode M0 | |||
|---|---|---|---|
| Quadrant | BADHDUFLAG | Total packets | Discarded packets |
| A | 0 | 15924 | 2 |
| B | 0 | 23055 | 2 |
| C | 0 | 44192 | 2 |
| D | 0 | 18587 | 2 |
| Quadrant | Total seconds | Saturated seconds | Saturation percentage |
|---|---|---|---|
| A | 7566 | 292 | 3.859371% |
| B | 7566 | 396 | 5.233941% |
| C | 7566 | 3766 | 49.775311% |
| D | 7566 | 302 | 3.991541% |
Noise dominated data is calculated using 1-second bins in cleaned event files. If a bin has >2000 counts, and if more than 50% of those come from <1% of pixels, then it is considered to be noise-dominated and hence unusable.
| Quadrant | # 1 sec bins | Bins with >0 counts | Bins with >2000 counts | High rate bins dominated by noise | Noise dominated (total time) | Noise dominated (detector-on time) | Marked lightcurve |
|---|---|---|---|---|---|---|---|
| A | 8591 | 7566 | 0 | 0 | 0.00% | 0.00% | 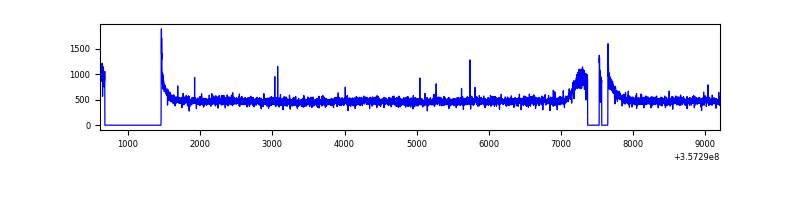 |
| B | 8591 | 7566 | 0 | 0 | 0.00% | 0.00% | 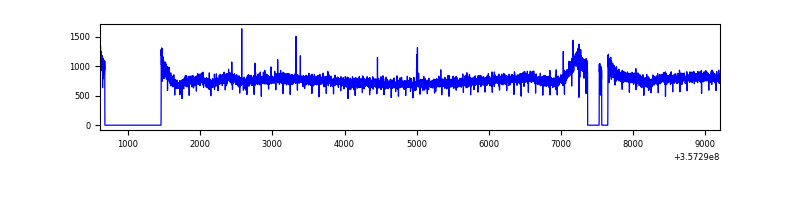 |
| C | 8591 | 7566 | 2486 | 2486 | 28.94% | 32.86% |  |
| D | 8591 | 7568 | 74 | 74 | 0.86% | 0.98% | 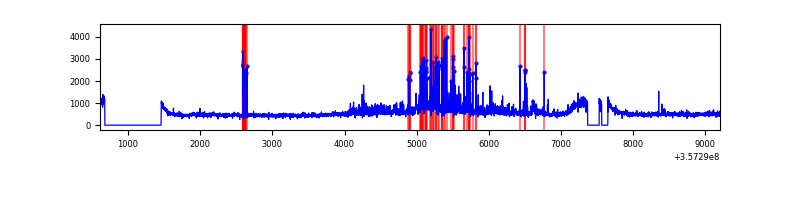 |
Top three noisy pixels from each quadrant. If the there are fewer than three noisy pixels in the level2.evt file, extra rows are filled as -1
| Pixel properties | Quadrant properties | ||||||
|---|---|---|---|---|---|---|---|
| Quadrant | DetID | PixID | Counts | Sigma | Mean | Median | Sigma |
| A | 8 | 192 | 23329 | 113.08 | 970 | 950 | 197.9 |
| A | 13 | 254 | 12260 | 57.15 | 970 | 950 | 197.9 |
| A | 3 | 137 | 10388 | 47.69 | 970 | 950 | 197.9 |
| B | 6 | 159 | 2049078 | 10910.93 | 953 | 925 | 187.7 |
| B | 12 | 111 | 23991 | 122.87 | 953 | 925 | 187.7 |
| B | 11 | 111 | 22228 | 113.48 | 953 | 925 | 187.7 |
| C | 3 | 233 | 9841680 | 52470.75 | 788 | 792 | 187.5 |
| C | 14 | 238 | 136547 | 723.83 | 788 | 792 | 187.5 |
| C | 14 | 254 | 22195 | 114.12 | 788 | 792 | 187.5 |
| D | 1 | 52 | 554170 | 2443.52 | 934 | 913 | 226.4 |
| D | 8 | 195 | 200791 | 882.78 | 934 | 913 | 226.4 |
| D | 13 | 104 | 121414 | 532.21 | 934 | 913 | 226.4 |
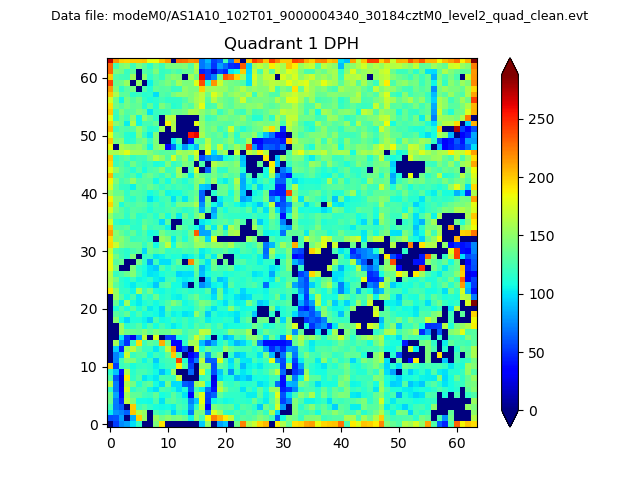
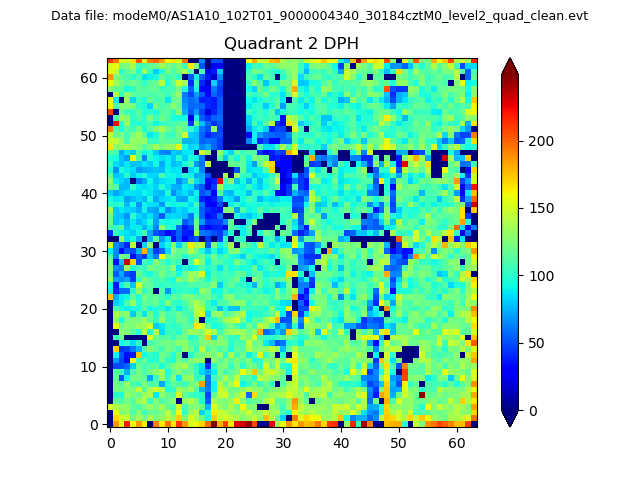
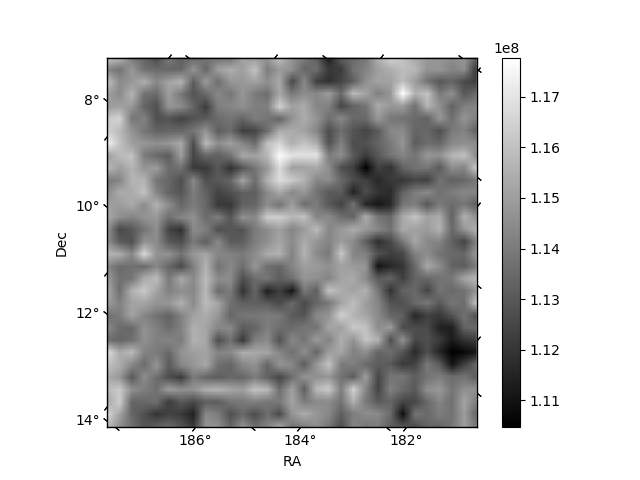
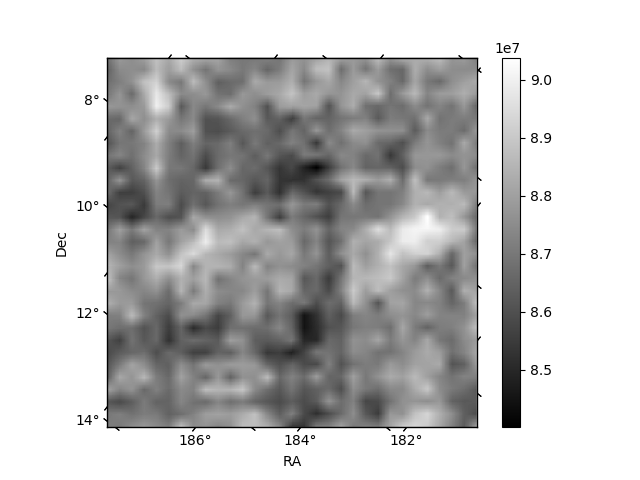
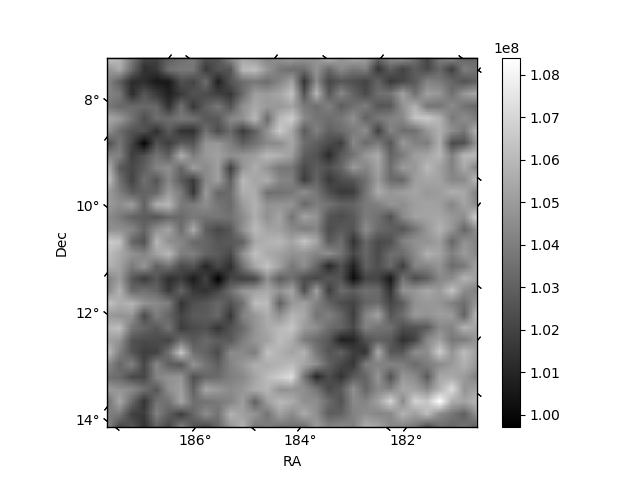
Histogram calculated using DETX and DETY for each event in the final _common_clean file
| Quadrant A | 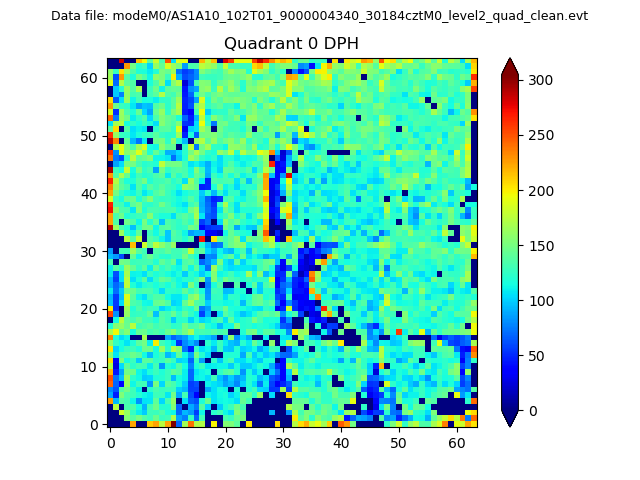 |
 |
Quadrant B |
|---|---|---|---|
| Quadrant D |  |
 |
Quadrant C |
| Plot type | Count rate plots | Images |
|---|---|---|
| Comparison with Poisson distribution Blue bars denote a histogram of data divided into 1 sec bins. Red curve is a Poisson curve with rate = median count rate of data. |
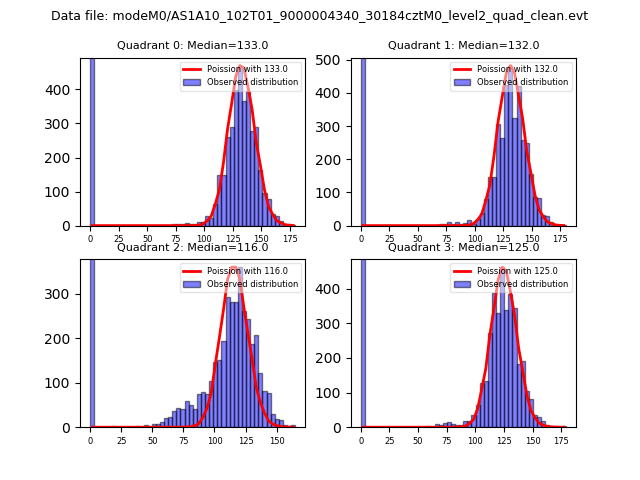 |
 |
| Quadrant-wise count rates Data is divided into 100 sec bins |
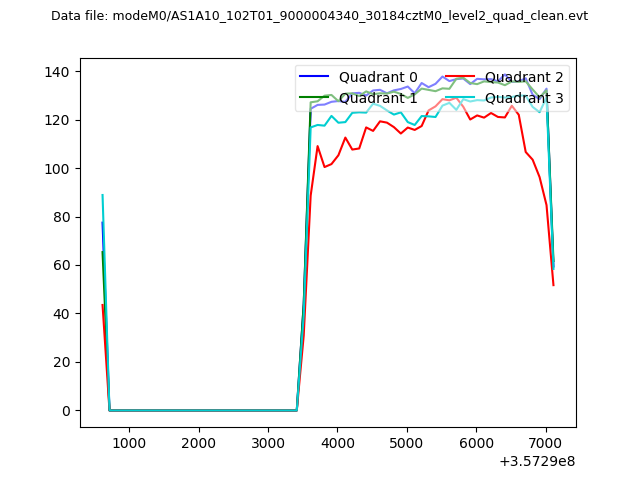 |
|
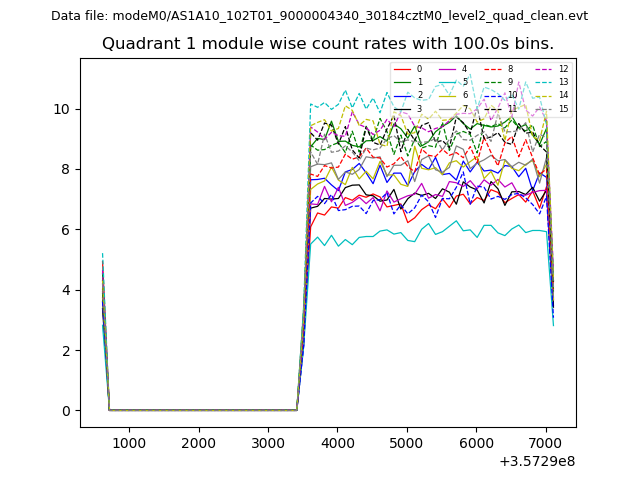
| Module-wise count rates for Quadrant A Data is divided into 100 sec bins |
 |
 |
| Module-wise count rates for Quadrant B Data is divided into 100 sec bins |
 |
 |
| Module-wise count rates for Quadrant C Data is divided into 100 sec bins |
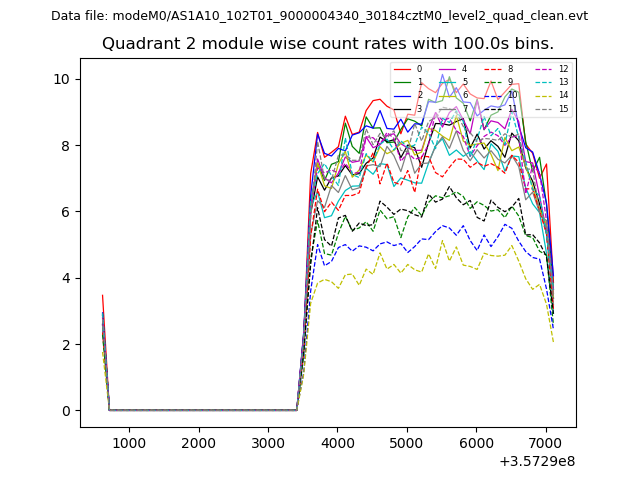 |
 |
| Module-wise count rates for Quadrant D Data is divided into 100 sec bins |
 |
 |
| Parameter | Plot |
|---|---|
| CZT HV Monitor | 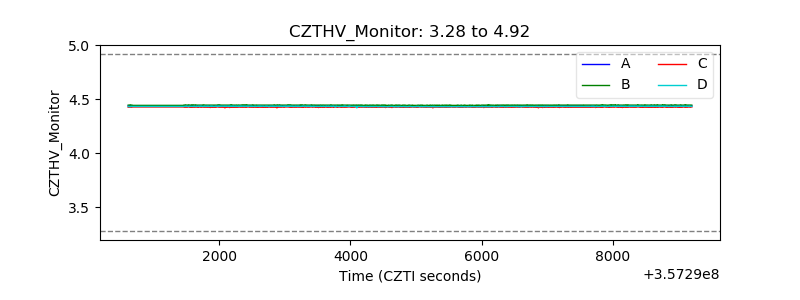 |
| D_VDD | 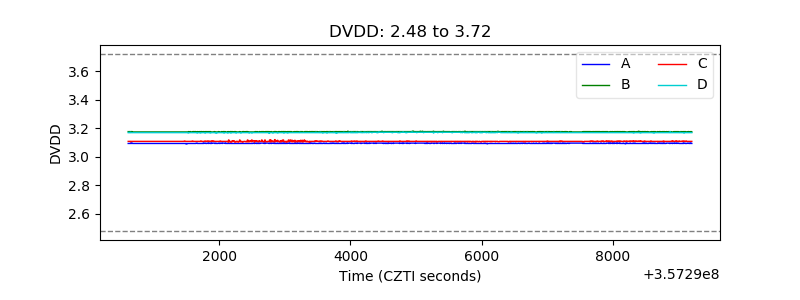 |
| Temperature 1 | 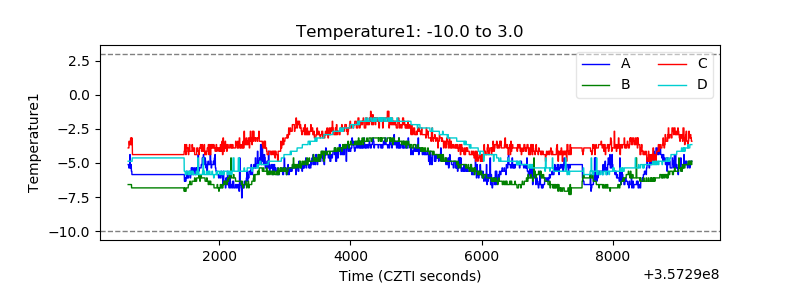 |
| Veto HV Monitor | 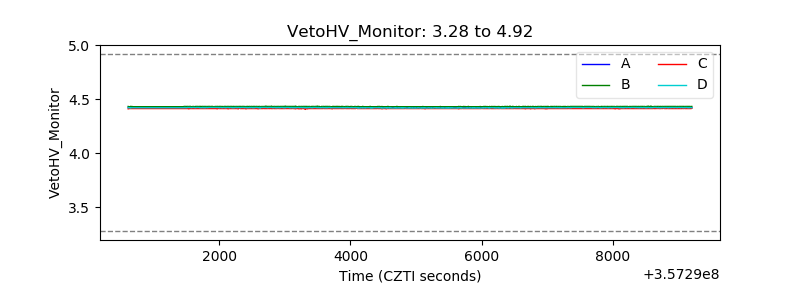 |
| Veto LLD | 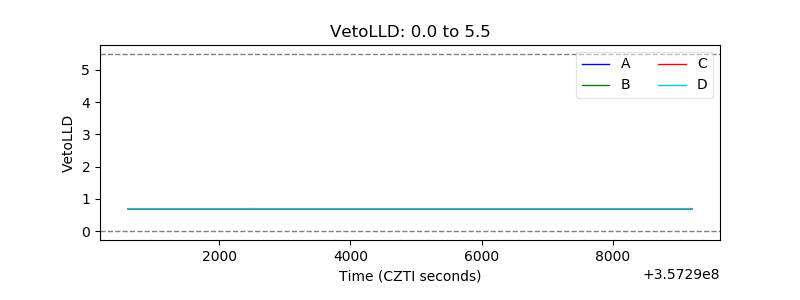 |
| Alpha Counter | 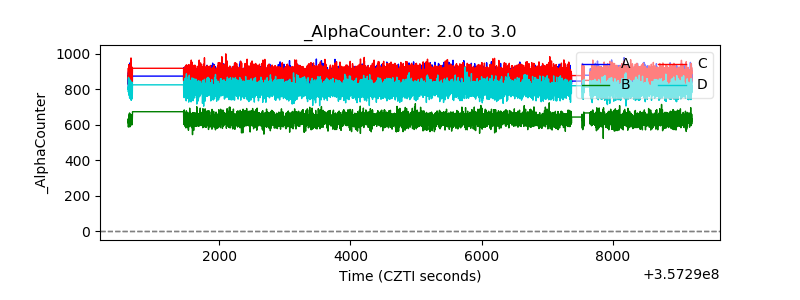 |
| _CPM_Rate | 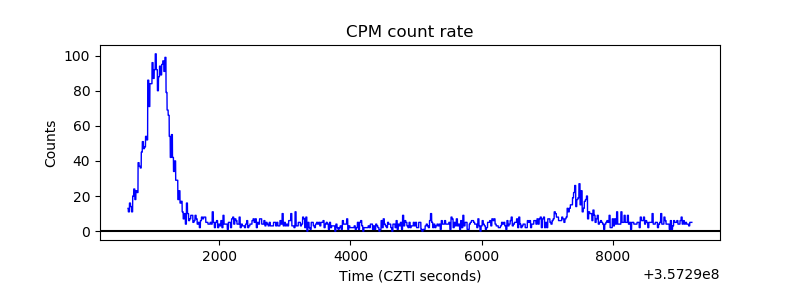 |
| CZT Counter | 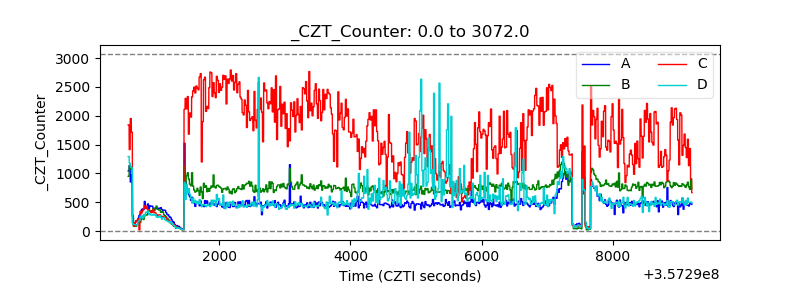 |
| +2.5 Volts monitor | 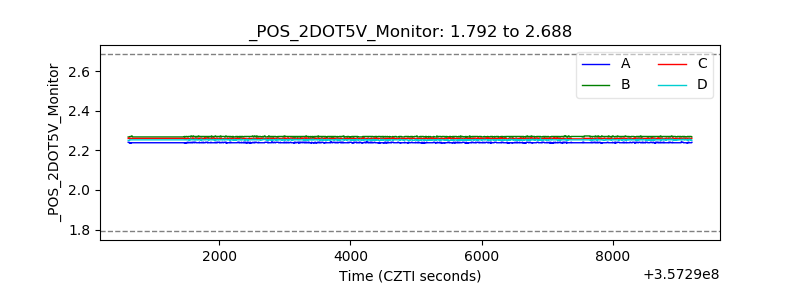 |
| +5 Volts monitor | 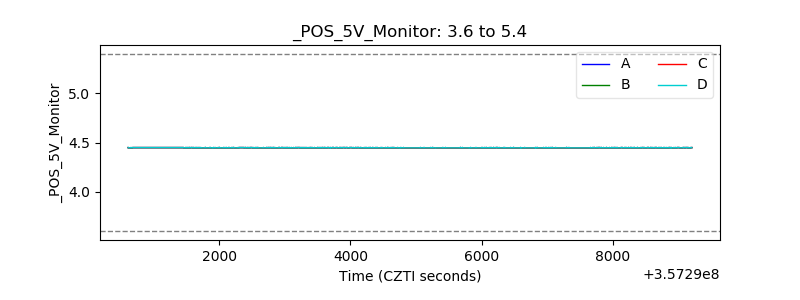 |
| _ROLL_ROT | 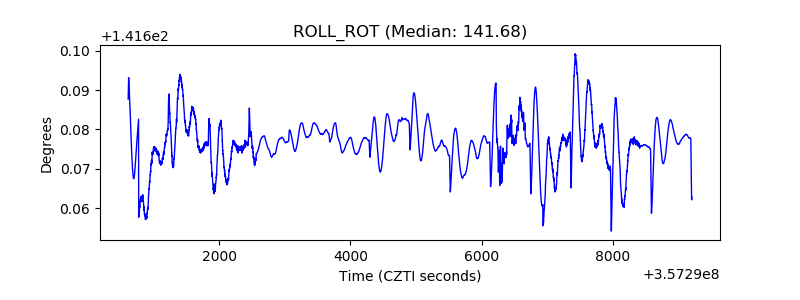 |
| _Roll_DEC | 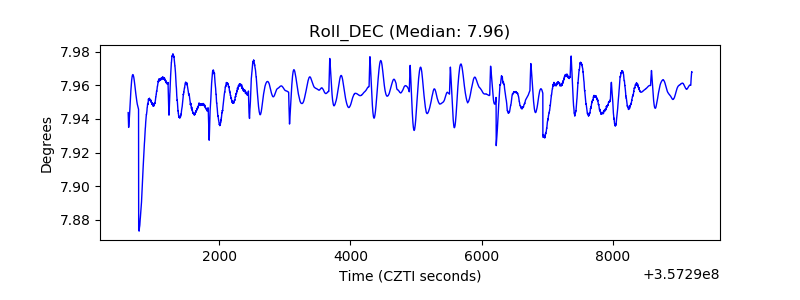 |
| _Roll_RA | 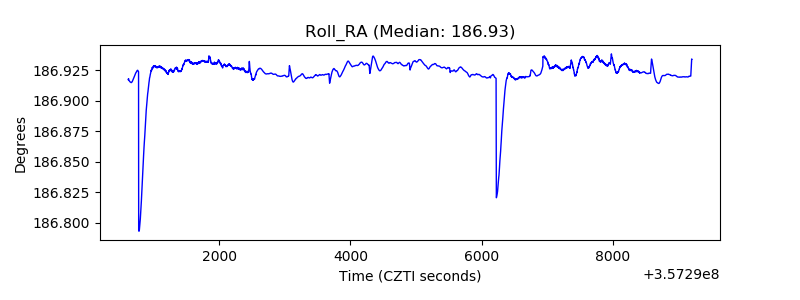 |
| Veto Counter | 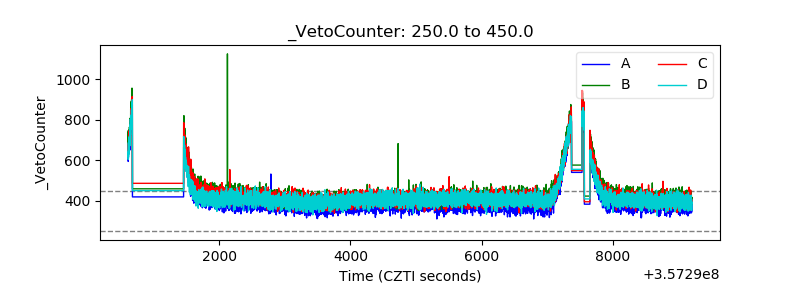 |