| Param | Original file | Final file |
|---|---|---|
| Filename | modeM0/AS1A10_102T01_9000004340_30185cztM0_level2.evt | modeM0/AS1A10_102T01_9000004340_30185cztM0_level2_quad_clean.evt |
| Size (bytes) | 936,221,760 | 79,542,720 |
| Size | 892.9 MB | 75.9 MB |
| Events in quadrant A | 3,780,060 | 496,051 |
| Events in quadrant B | 5,949,925 | 495,980 |
| Events in quadrant C | 12,196,251 | 434,983 |
| Events in quadrant D | 5,902,690 | 439,584 |
| Mode SS | |||
|---|---|---|---|
| Quadrant | BADHDUFLAG | Total packets | Discarded packets |
| A | 0 | 156 | 0 |
| B | 0 | 156 | 0 |
| C | 0 | 156 | 0 |
| D | 0 | 156 | 0 |
| Mode M0 | |||
|---|---|---|---|
| Quadrant | BADHDUFLAG | Total packets | Discarded packets |
| A | 0 | 16138 | 1 |
| B | 0 | 23502 | 1 |
| C | 0 | 41691 | 1 |
| D | 0 | 22464 | 1 |
| Quadrant | Total seconds | Saturated seconds | Saturation percentage |
|---|---|---|---|
| A | 7784 | 195 | 2.505139% |
| B | 7785 | 335 | 4.303147% |
| C | 7785 | 2737 | 35.157354% |
| D | 7785 | 867 | 11.136802% |
Noise dominated data is calculated using 1-second bins in cleaned event files. If a bin has >2000 counts, and if more than 50% of those come from <1% of pixels, then it is considered to be noise-dominated and hence unusable.
| Quadrant | # 1 sec bins | Bins with >0 counts | Bins with >2000 counts | High rate bins dominated by noise | Noise dominated (total time) | Noise dominated (detector-on time) | Marked lightcurve |
|---|---|---|---|---|---|---|---|
| A | 7819 | 7785 | 2 | 2 | 0.03% | 0.03% | 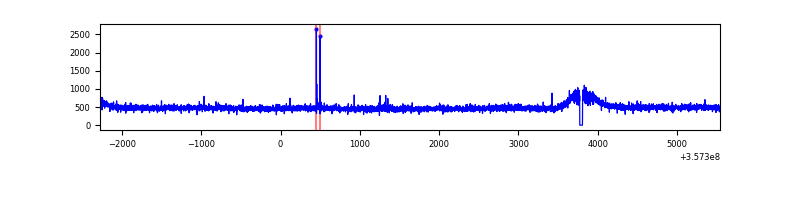 |
| B | 7820 | 7786 | 0 | 0 | 0.00% | 0.00% | 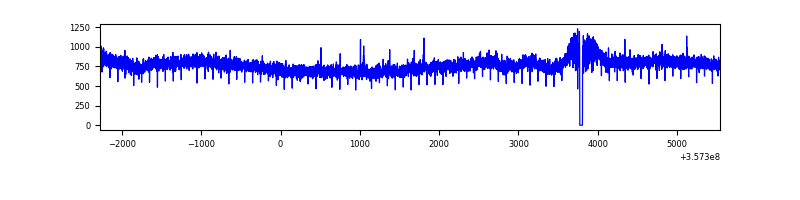 |
| C | 7820 | 7785 | 1385 | 1385 | 17.71% | 17.79% | 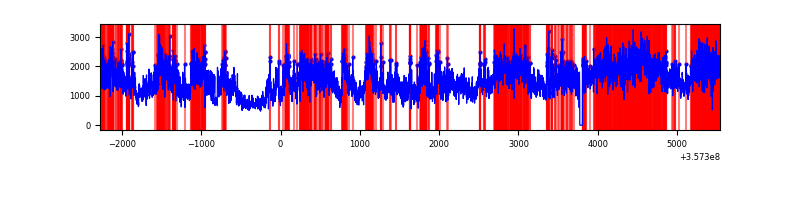 |
| D | 7820 | 7786 | 533 | 533 | 6.82% | 6.85% | 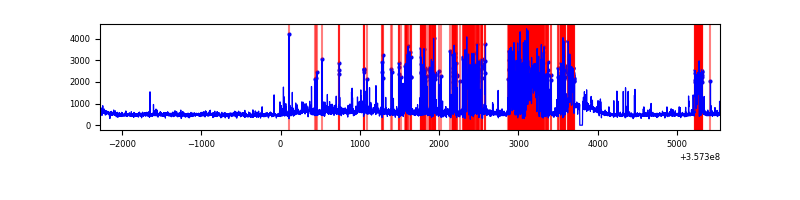 |
Top three noisy pixels from each quadrant. If the there are fewer than three noisy pixels in the level2.evt file, extra rows are filled as -1
| Pixel properties | Quadrant properties | ||||||
|---|---|---|---|---|---|---|---|
| Quadrant | DetID | PixID | Counts | Sigma | Mean | Median | Sigma |
| A | 14 | 254 | 13013 | 60.2 | 976 | 953 | 200.3 |
| A | 13 | 254 | 12771 | 58.99 | 976 | 953 | 200.3 |
| A | 3 | 137 | 10527 | 47.79 | 976 | 953 | 200.3 |
| B | 6 | 159 | 2171151 | 11450.8 | 960 | 932 | 189.5 |
| B | 12 | 111 | 24317 | 123.39 | 960 | 932 | 189.5 |
| B | 11 | 111 | 22065 | 111.5 | 960 | 932 | 189.5 |
| C | 3 | 233 | 8743211 | 43516.96 | 847 | 850 | 200.9 |
| C | 14 | 238 | 134276 | 664.15 | 847 | 850 | 200.9 |
| C | 2 | 114 | 16672 | 78.75 | 847 | 850 | 200.9 |
| D | 1 | 52 | 2026000 | 9391.51 | 885 | 862 | 215.6 |
| D | 8 | 195 | 217902 | 1006.52 | 885 | 862 | 215.6 |
| D | 13 | 104 | 133906 | 616.99 | 885 | 862 | 215.6 |
Histogram calculated using DETX and DETY for each event in the final _common_clean file
| Quadrant A | 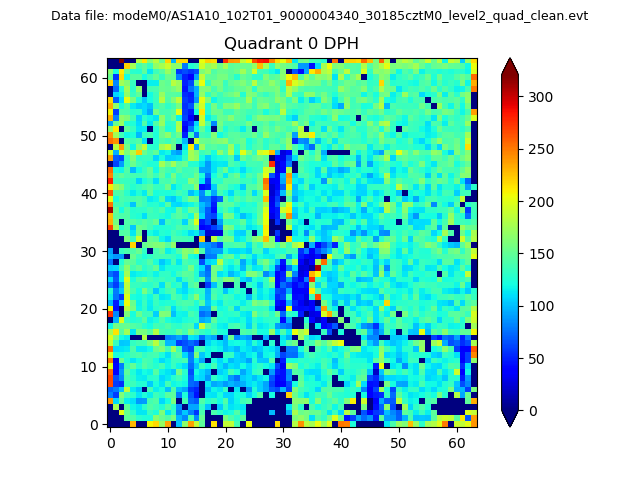 |
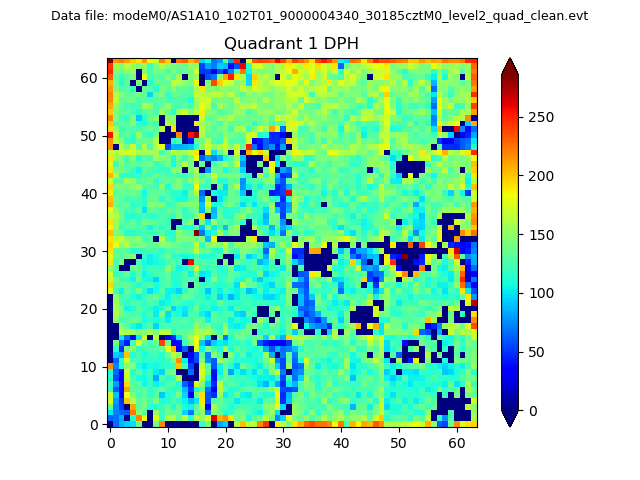 |
Quadrant B |
|---|---|---|---|
| Quadrant D | 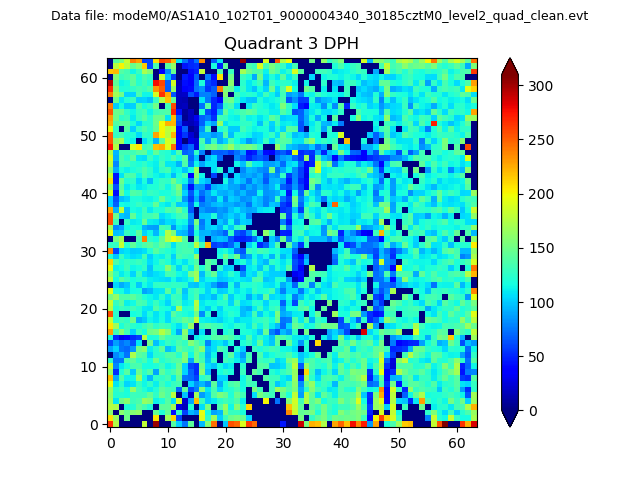 |
 |
Quadrant C |
| Plot type | Count rate plots | Images |
|---|---|---|
| Comparison with Poisson distribution Blue bars denote a histogram of data divided into 1 sec bins. Red curve is a Poisson curve with rate = median count rate of data. |
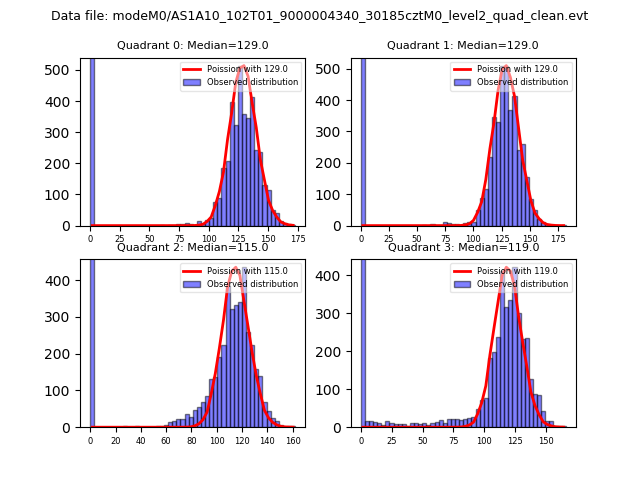 |
 |
| Quadrant-wise count rates Data is divided into 100 sec bins |
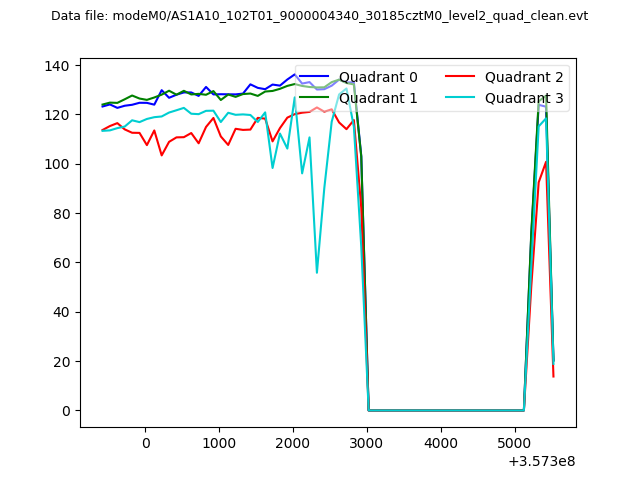 |
|
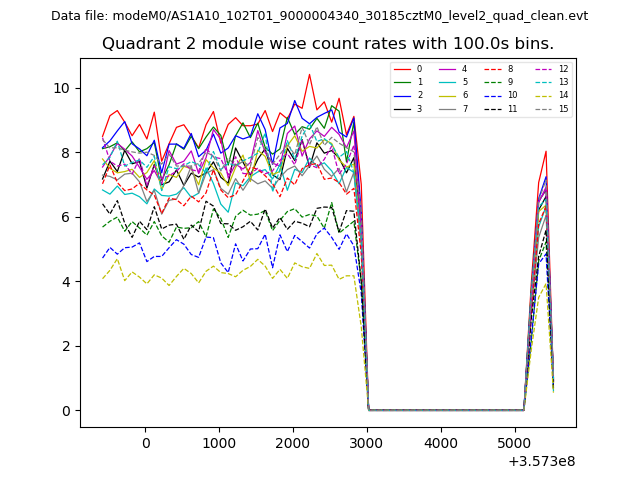
| Module-wise count rates for Quadrant A Data is divided into 100 sec bins |
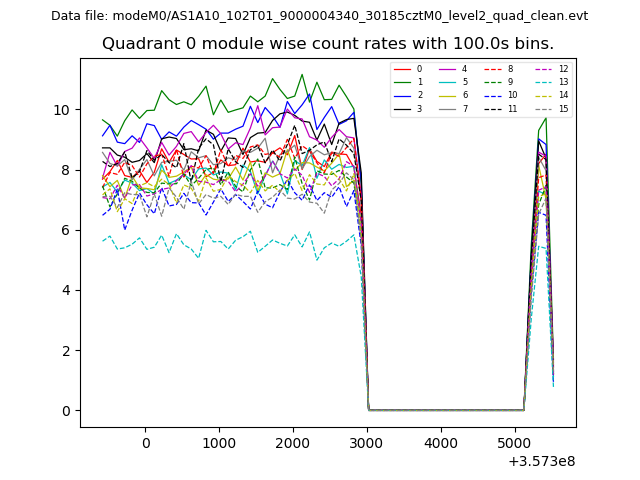 |
 |
| Module-wise count rates for Quadrant B Data is divided into 100 sec bins |
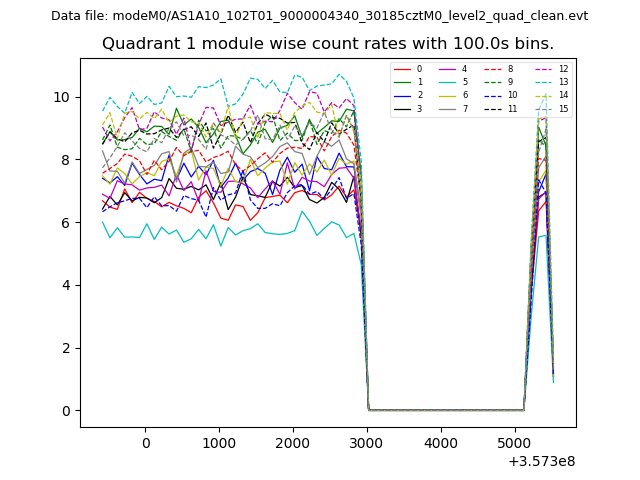 |
 |
| Module-wise count rates for Quadrant C Data is divided into 100 sec bins |
 |
 |
| Module-wise count rates for Quadrant D Data is divided into 100 sec bins |
 |
 |
| Parameter | Plot |
|---|---|
| CZT HV Monitor | 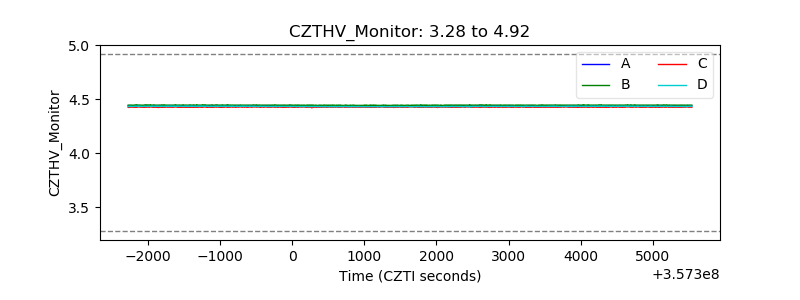 |
| D_VDD | 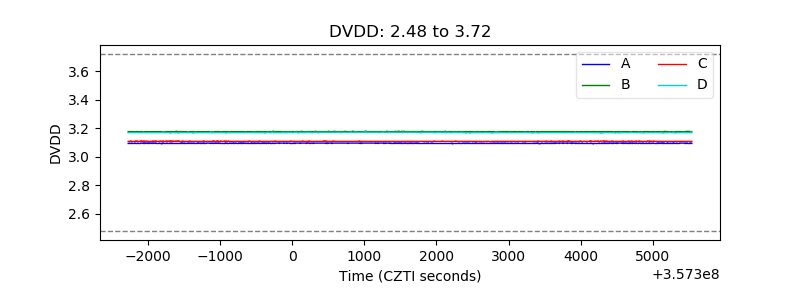 |
| Temperature 1 |  |
| Veto HV Monitor | 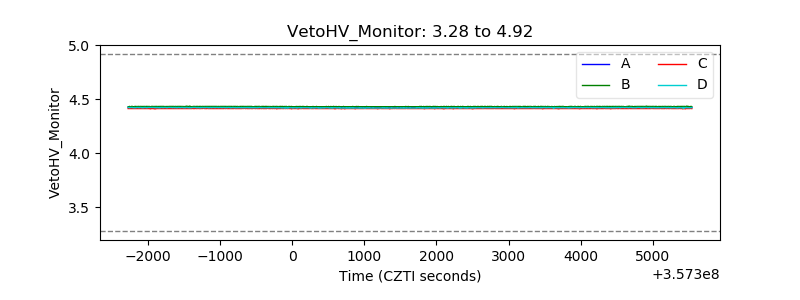 |
| Veto LLD | 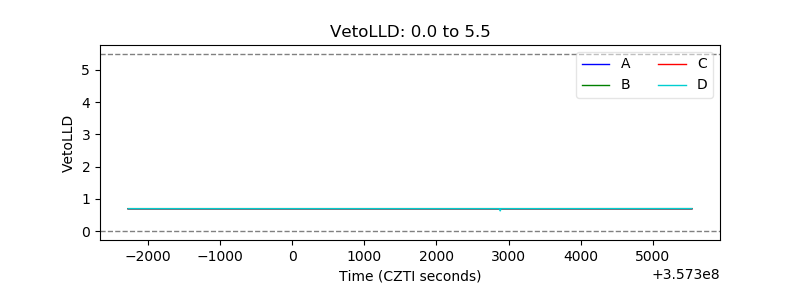 |
| Alpha Counter | 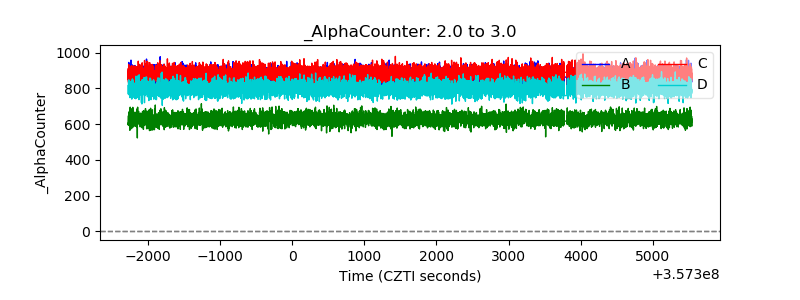 |
| _CPM_Rate | 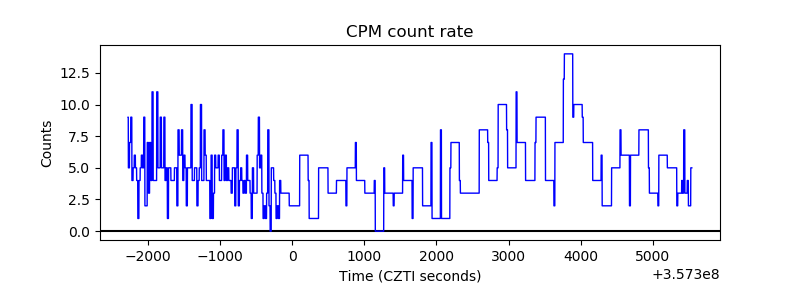 |
| CZT Counter |  |
| +2.5 Volts monitor |  |
| +5 Volts monitor |  |
| _ROLL_ROT |  |
| _Roll_DEC |  |
| _Roll_RA |  |
| Veto Counter |  |