| Param | Original file | Final file |
|---|---|---|
| Filename | modeM0/AS1A10_102T01_9000004340_30186cztM0_level2.evt | modeM0/AS1A10_102T01_9000004340_30186cztM0_level2_quad_clean.evt |
| Size (bytes) | 454,916,160 | 32,503,680 |
| Size | 433.8 MB | 31.0 MB |
| Events in quadrant A | 1,788,895 | 196,725 |
| Events in quadrant B | 2,713,773 | 197,656 |
| Events in quadrant C | 6,557,038 | 154,543 |
| Events in quadrant D | 2,477,283 | 184,311 |
| Mode SS | |||
|---|---|---|---|
| Quadrant | BADHDUFLAG | Total packets | Discarded packets |
| A | 0 | 70 | 0 |
| B | 0 | 70 | 0 |
| C | 0 | 70 | 0 |
| D | 0 | 70 | 0 |
| Mode M0 | |||
|---|---|---|---|
| Quadrant | BADHDUFLAG | Total packets | Discarded packets |
| A | 0 | 7519 | 1 |
| B | 0 | 10771 | 1 |
| C | 0 | 21922 | 1 |
| D | 0 | 9559 | 1 |
| Quadrant | Total seconds | Saturated seconds | Saturation percentage |
|---|---|---|---|
| A | 3530 | 189 | 5.354108% |
| B | 3531 | 302 | 8.552818% |
| C | 3531 | 2253 | 63.806287% |
| D | 3531 | 325 | 9.204191% |
Noise dominated data is calculated using 1-second bins in cleaned event files. If a bin has >2000 counts, and if more than 50% of those come from <1% of pixels, then it is considered to be noise-dominated and hence unusable.
| Quadrant | # 1 sec bins | Bins with >0 counts | Bins with >2000 counts | High rate bins dominated by noise | Noise dominated (total time) | Noise dominated (detector-on time) | Marked lightcurve |
|---|---|---|---|---|---|---|---|
| A | 3565 | 3531 | 0 | 0 | 0.00% | 0.00% | 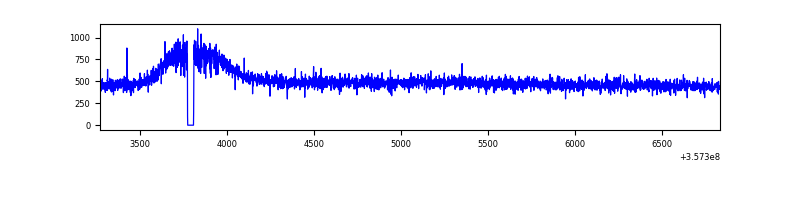 |
| B | 3566 | 3532 | 0 | 0 | 0.00% | 0.00% | 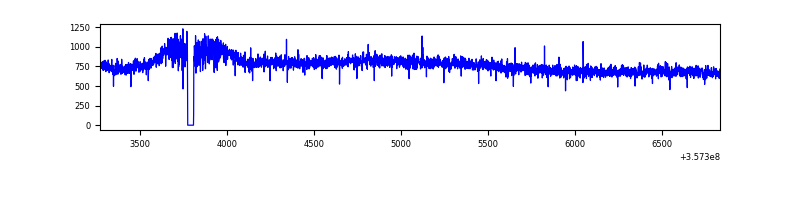 |
| C | 3566 | 3531 | 1268 | 1268 | 35.56% | 35.91% | 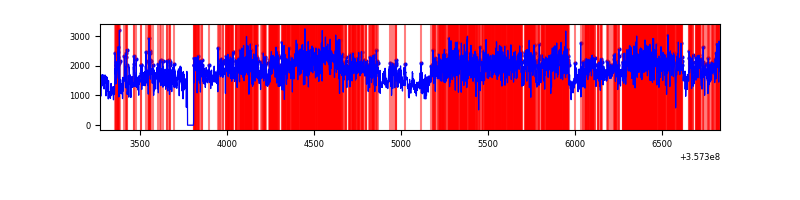 |
| D | 3566 | 3532 | 168 | 168 | 4.71% | 4.76% | 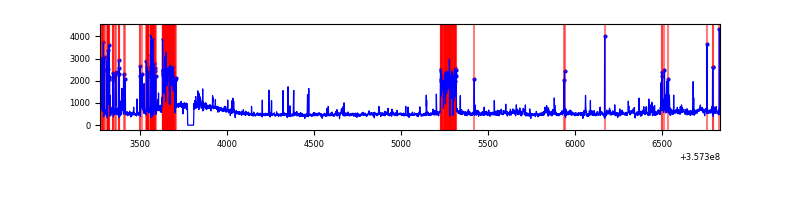 |
Top three noisy pixels from each quadrant. If the there are fewer than three noisy pixels in the level2.evt file, extra rows are filled as -1
| Pixel properties | Quadrant properties | ||||||
|---|---|---|---|---|---|---|---|
| Quadrant | DetID | PixID | Counts | Sigma | Mean | Median | Sigma |
| A | 13 | 254 | 5624 | 53.49 | 463 | 451 | 96.7 |
| A | 3 | 137 | 5032 | 47.37 | 463 | 451 | 96.7 |
| A | 0 | 226 | 3928 | 35.96 | 463 | 451 | 96.7 |
| B | 6 | 159 | 946882 | 10419.01 | 448 | 434 | 90.8 |
| B | 12 | 111 | 11569 | 122.57 | 448 | 434 | 90.8 |
| B | 11 | 111 | 10798 | 114.09 | 448 | 434 | 90.8 |
| C | 3 | 233 | 5054912 | 57452.64 | 367 | 367 | 88.0 |
| C | 14 | 238 | 58257 | 658.01 | 367 | 367 | 88.0 |
| C | 2 | 114 | 7002 | 75.42 | 367 | 367 | 88.0 |
| D | 1 | 52 | 534291 | 5110.13 | 432 | 420 | 104.5 |
| D | 15 | 0 | 124275 | 1185.52 | 432 | 420 | 104.5 |
| D | 8 | 195 | 85351 | 812.95 | 432 | 420 | 104.5 |
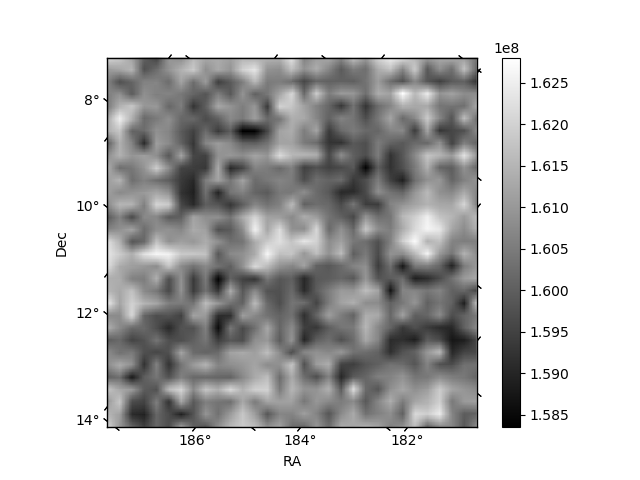
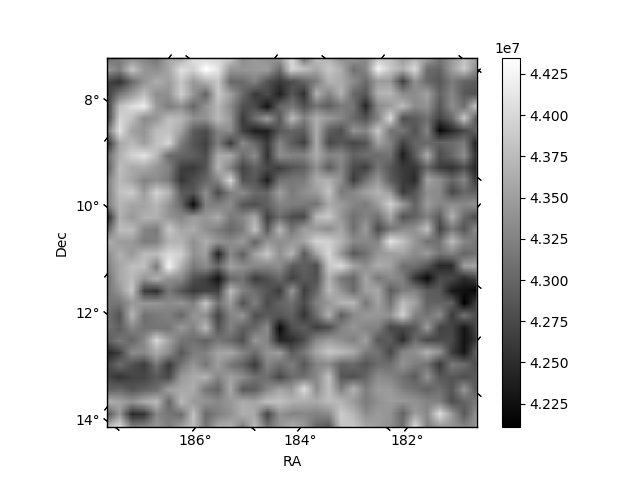
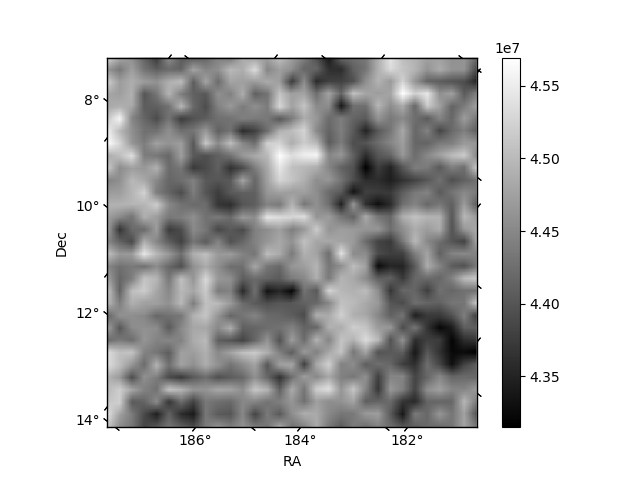
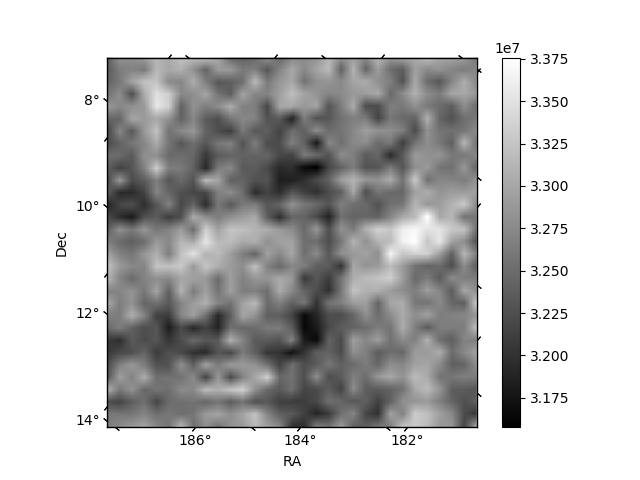
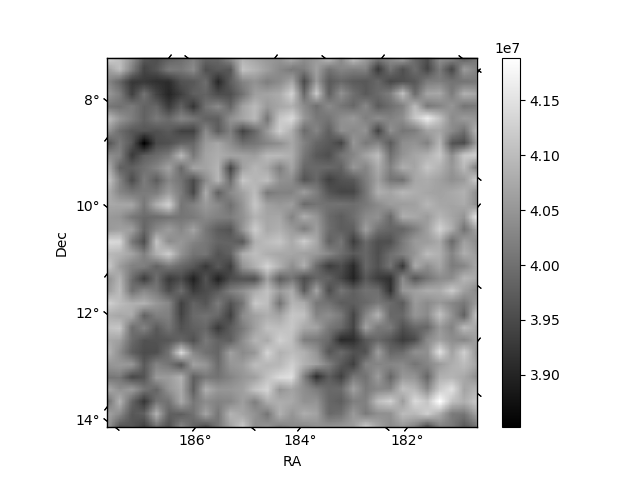
Histogram calculated using DETX and DETY for each event in the final _common_clean file
| Quadrant A | 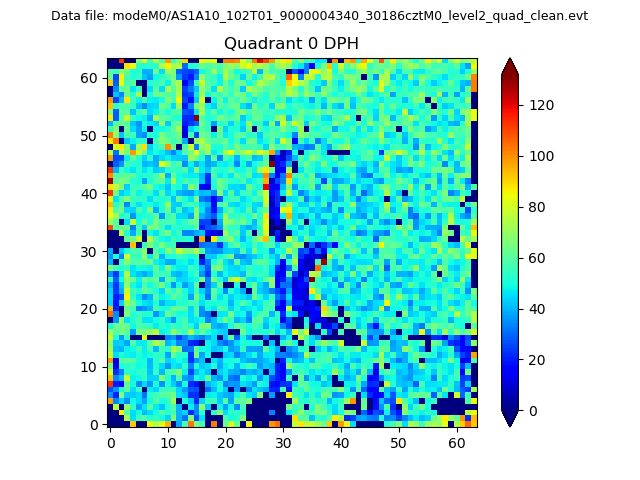 |
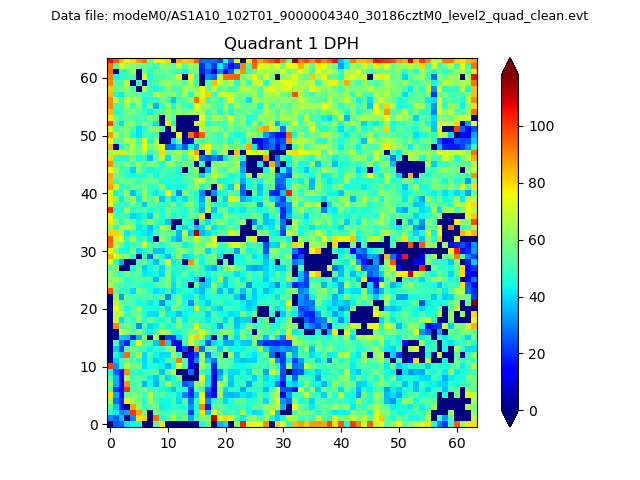 |
Quadrant B |
|---|---|---|---|
| Quadrant D | 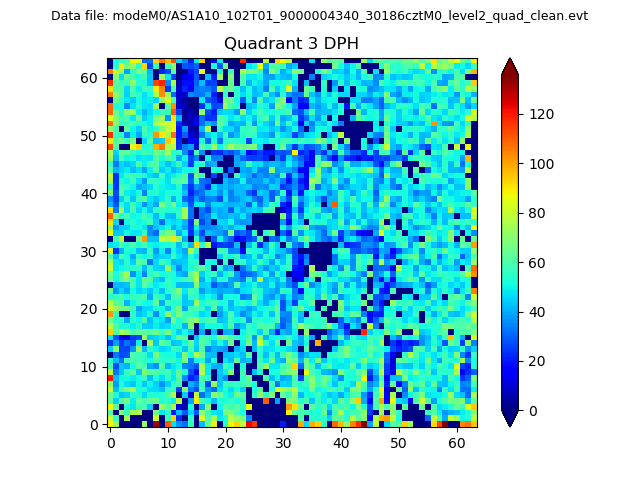 |
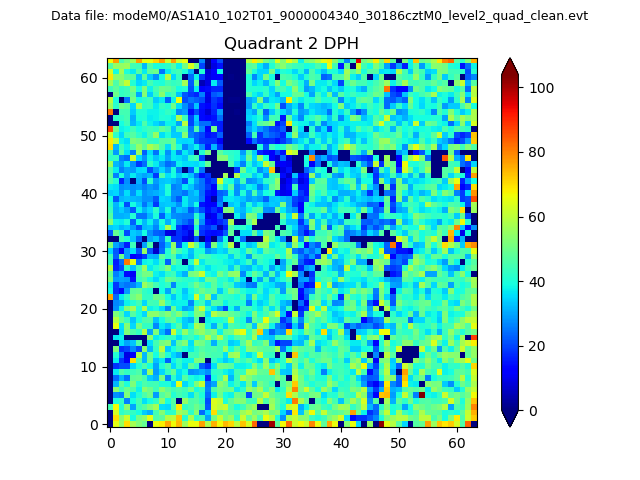 |
Quadrant C |
| Plot type | Count rate plots | Images |
|---|---|---|
| Comparison with Poisson distribution Blue bars denote a histogram of data divided into 1 sec bins. Red curve is a Poisson curve with rate = median count rate of data. |
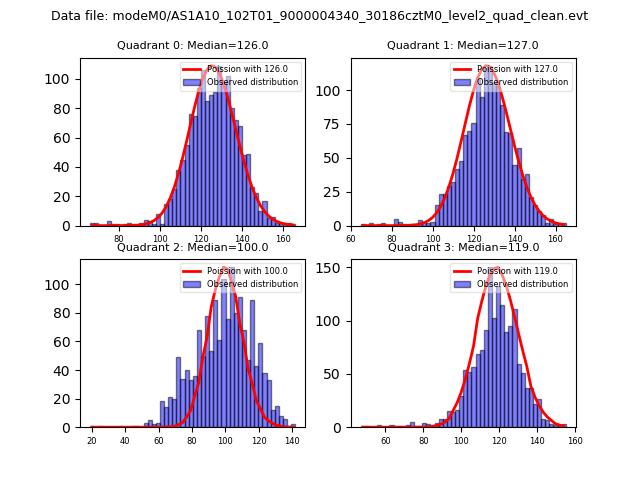 |
 |
| Quadrant-wise count rates Data is divided into 100 sec bins |
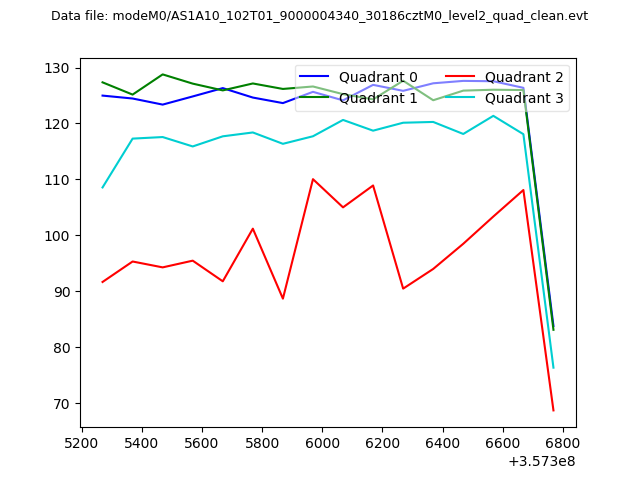 |
|
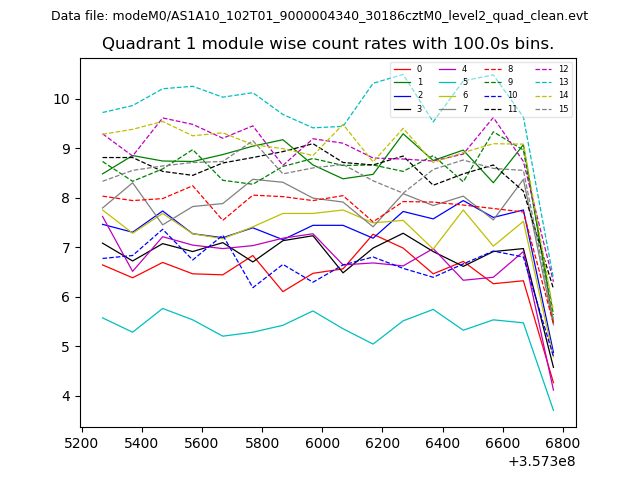
| Module-wise count rates for Quadrant A Data is divided into 100 sec bins |
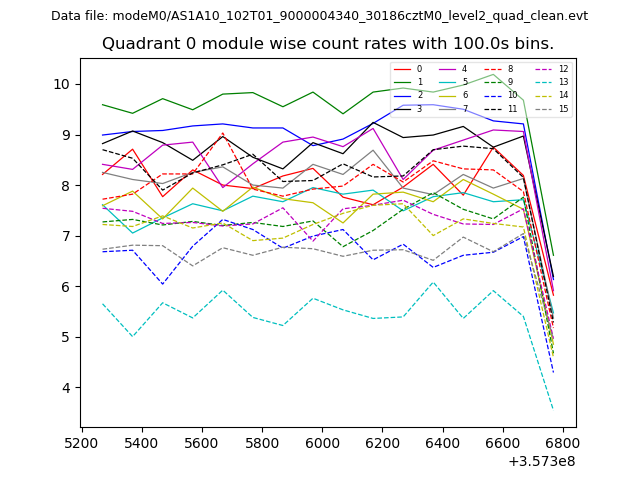 |
 |
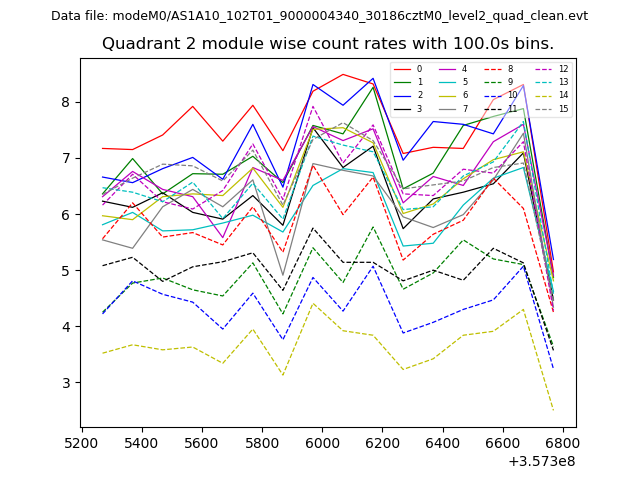
| Module-wise count rates for Quadrant B Data is divided into 100 sec bins |
 |
 |
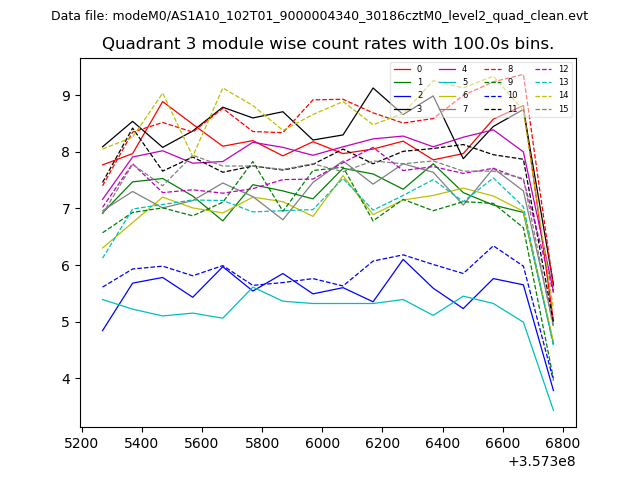
| Module-wise count rates for Quadrant C Data is divided into 100 sec bins |
 |
 |
| Module-wise count rates for Quadrant D Data is divided into 100 sec bins |
 |
 |
| Parameter | Plot |
|---|---|
| CZT HV Monitor | 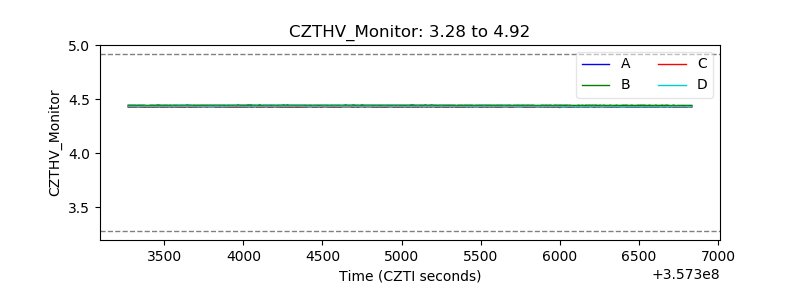 |
| D_VDD | 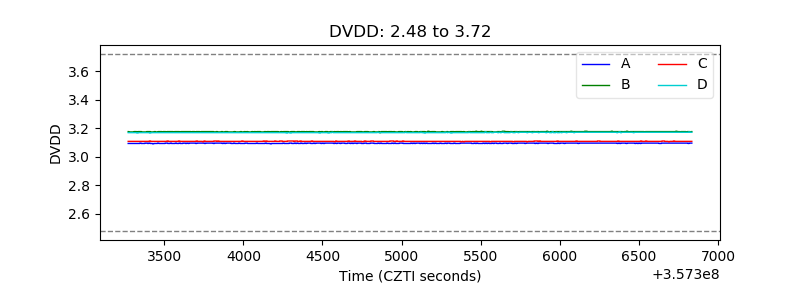 |
| Temperature 1 | 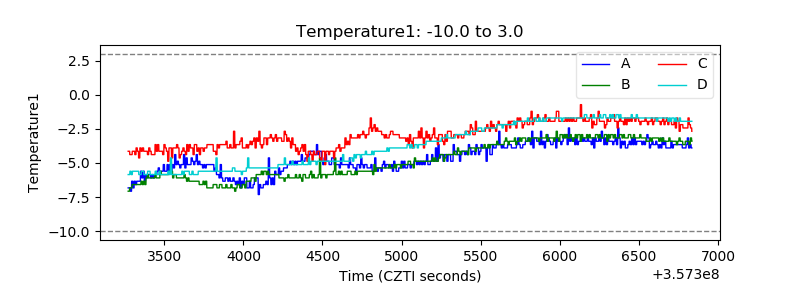 |
| Veto HV Monitor | 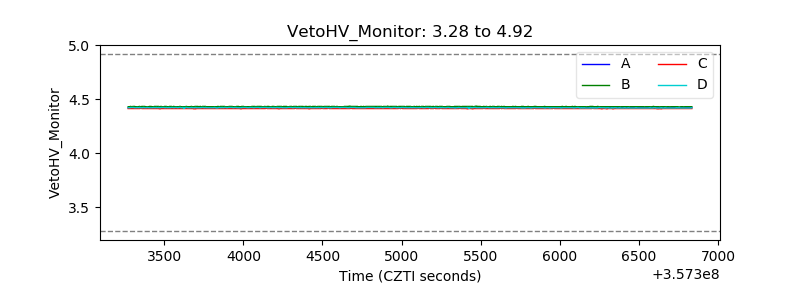 |
| Veto LLD | 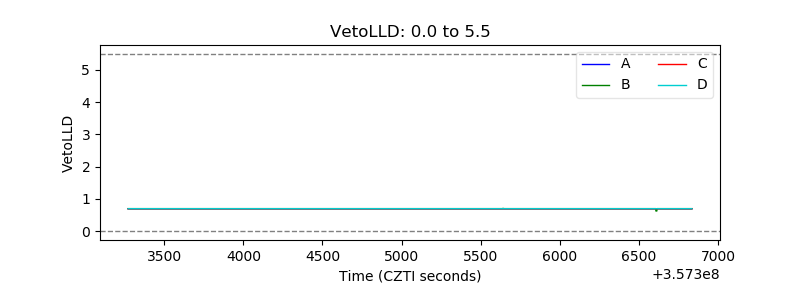 |
| Alpha Counter | 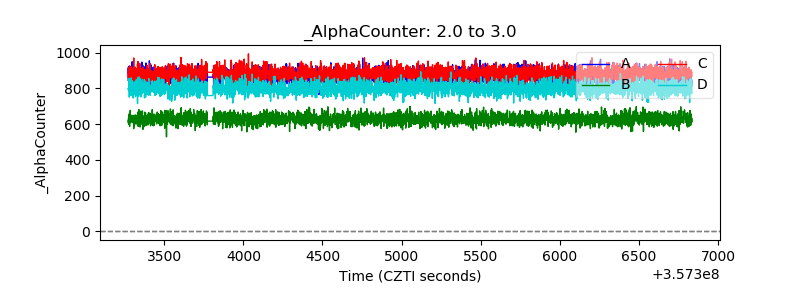 |
| _CPM_Rate | 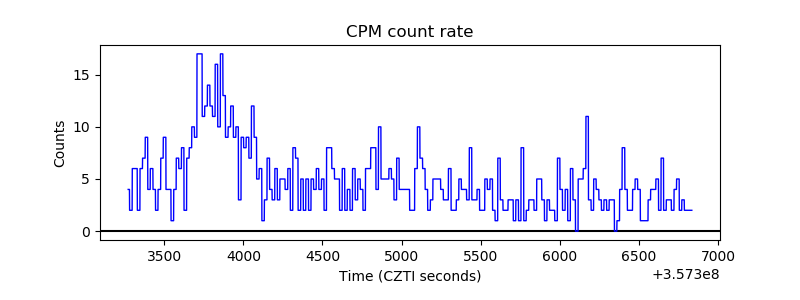 |
| CZT Counter | 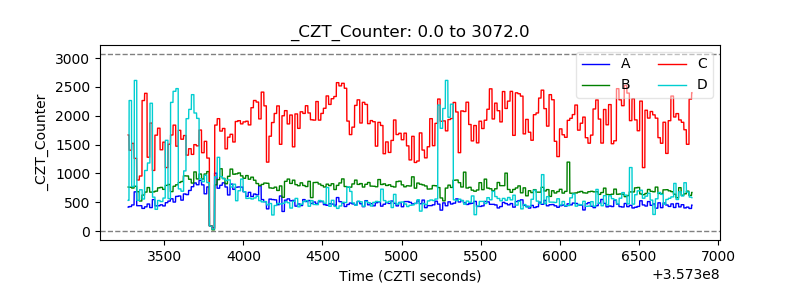 |
| +2.5 Volts monitor | 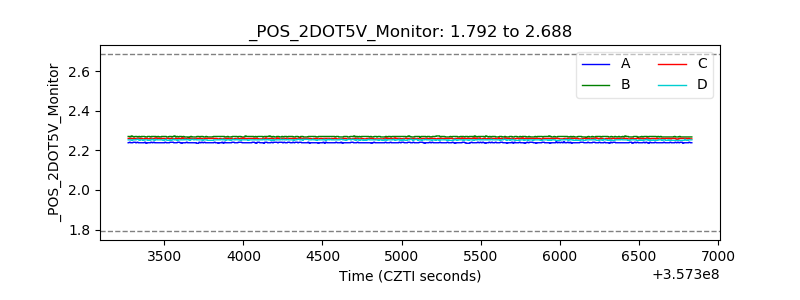 |
| +5 Volts monitor | 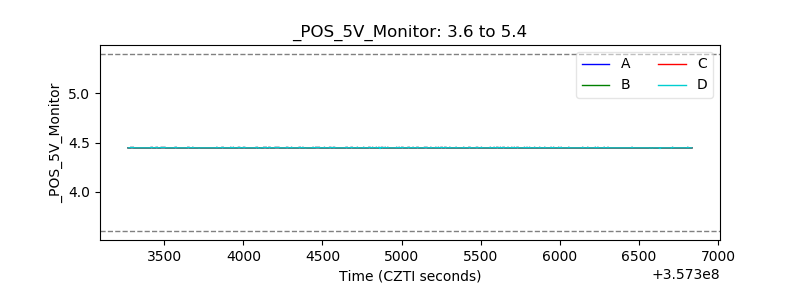 |
| _ROLL_ROT | 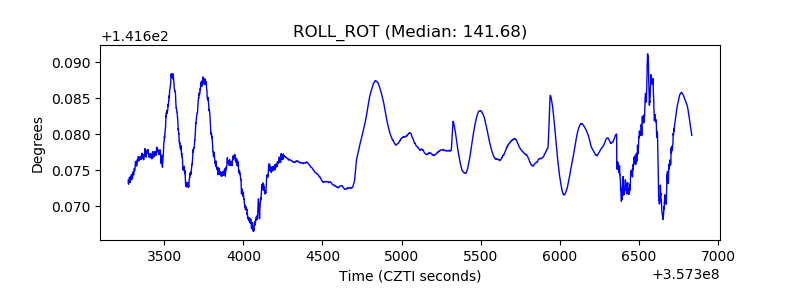 |
| _Roll_DEC | 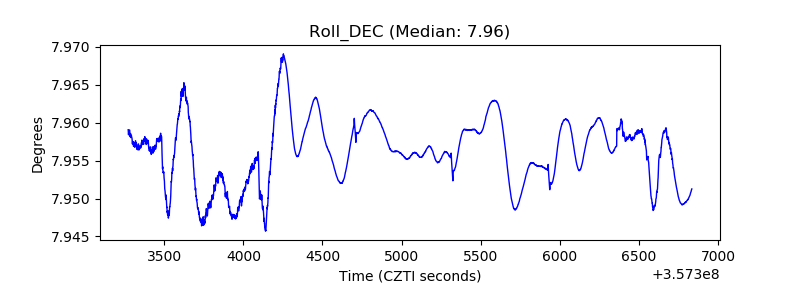 |
| _Roll_RA | 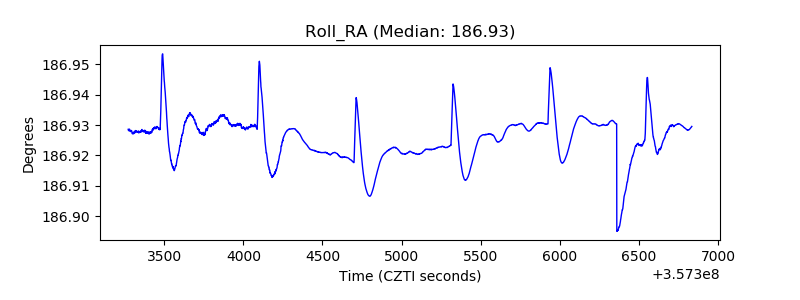 |
| Veto Counter | 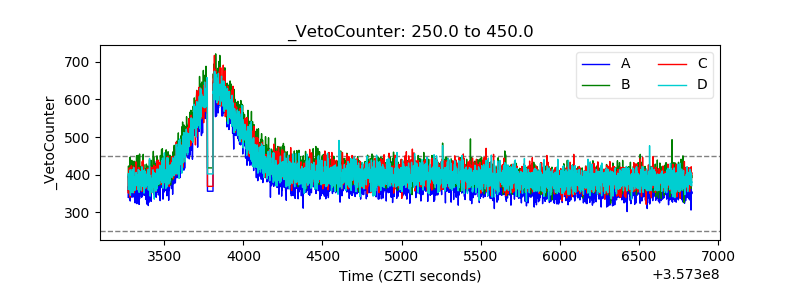 |