| Param | Original file | Final file |
|---|---|---|
| Filename | modeM0/AS1A10_050T05_9000004342cztM0_level2.fits | modeM0/AS1A10_050T05_9000004342cztM0_level2_quad_clean.evt |
| Size (bytes) | 286,364,160 | 290,419,200 |
| Size | 273.1 MB | 277.0 MB |
| Events in quadrant A | 1,810,010 | 1,892,209 |
| Events in quadrant B | 1,707,256 | 1,847,016 |
| Events in quadrant C | 1,529,410 | 1,341,293 |
| Events in quadrant D | 1,542,646 | 1,636,275 |
| Mode M9 | |||
|---|---|---|---|
| Quadrant | BADHDUFLAG | Total packets | Discarded packets |
| A | 0 | 43 | 0 |
| B | 0 | 43 | 0 |
| C | 0 | 43 | 0 |
| D | 0 | 43 | 0 |
| Mode M0 | |||
|---|---|---|---|
| Quadrant | BADHDUFLAG | Total packets | Discarded packets |
| A | 0 | 62997 | 0 |
| B | 0 | 91756 | 0 |
| C | 0 | 158105 | 0 |
| D | 0 | 81115 | 0 |
| Mode SS | |||
|---|---|---|---|
| Quadrant | BADHDUFLAG | Total packets | Discarded packets |
| A | 0 | 620 | 0 |
| B | 0 | 620 | 0 |
| C | 0 | 620 | 0 |
| D | 0 | 620 | 0 |
| Quadrant | Total seconds | Saturated seconds | Saturation percentage |
|---|---|---|---|
| A | 30221 | 476 | 1.575064% |
| B | 30221 | 693 | 2.293107% |
| C | 30221 | 10254 | 33.930049% |
| D | 30221 | 980 | 3.242778% |
Noise dominated data is calculated using 1-second bins in cleaned event files. If a bin has >2000 counts, and if more than 50% of those come from <1% of pixels, then it is considered to be noise-dominated and hence unusable.
| Quadrant | # 1 sec bins | Bins with >0 counts | Bins with >2000 counts | High rate bins dominated by noise | Noise dominated (total time) | Noise dominated (detector-on time) | Marked lightcurve |
|---|---|---|---|---|---|---|---|
| A | 34676 | 30215 | 0 | 0 | 0.00% | 0.00% |  |
| B | 34676 | 30215 | 0 | 0 | 0.00% | 0.00% |  |
| C | 34676 | 30213 | 0 | 0 | 0.00% | 0.00% |  |
| D | 34676 | 30215 | 0 | 0 | 0.00% | 0.00% | 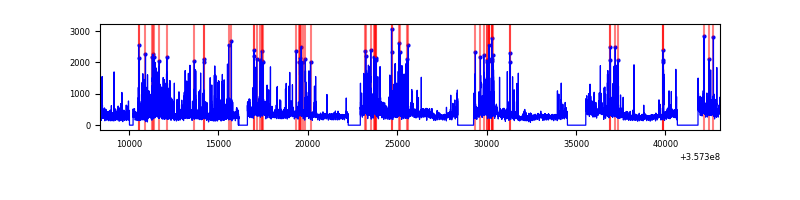 |
Top three noisy pixels from each quadrant. If the there are fewer than three noisy pixels in the level2.evt file, extra rows are filled as -1
| Pixel properties | Quadrant properties | ||||||
|---|---|---|---|---|---|---|---|
| Quadrant | DetID | PixID | Counts | Sigma | Mean | Median | Sigma |
| A | 0 | 29 | 1785 | 11.51 | 471 | 442 | 116.6 |
| A | 7 | 110 | 1428 | 8.45 | 471 | 442 | 116.6 |
| A | 0 | 30 | 1359 | 7.86 | 471 | 442 | 116.6 |
| B | 2 | 9 | 1363 | 10.16 | 450 | 428 | 92.1 |
| B | 3 | 80 | 1178 | 8.15 | 450 | 428 | 92.1 |
| B | 3 | 17 | 1159 | 7.94 | 450 | 428 | 92.1 |
| C | 1 | 81 | 1271 | 8.65 | 403 | 376 | 103.5 |
| C | 1 | 80 | 1217 | 8.13 | 403 | 376 | 103.5 |
| C | 12 | 241 | 1072 | 6.73 | 403 | 376 | 103.5 |
| D | 3 | 14 | 1165 | 6.44 | 441 | 402 | 118.5 |
| D | 15 | 46 | 1160 | 6.39 | 441 | 402 | 118.5 |
| D | 10 | 189 | 1101 | 5.9 | 441 | 402 | 118.5 |
Histogram calculated using DETX and DETY for each event in the final _common_clean file
| Quadrant A |  |
 |
Quadrant B |
|---|---|---|---|
| Quadrant D | 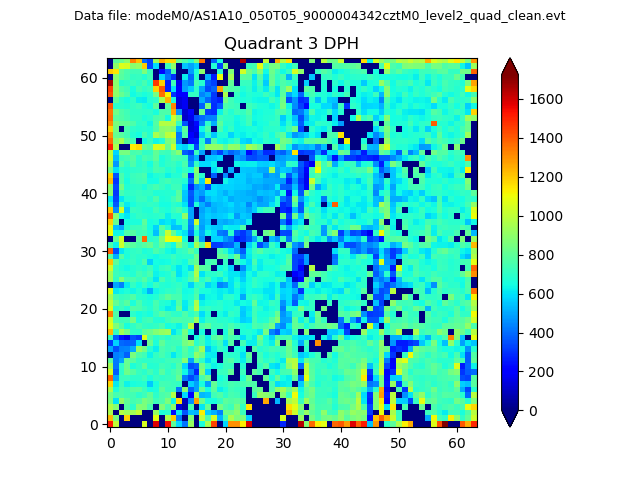 |
 |
Quadrant C |
| Plot type | Count rate plots | Images |
|---|---|---|
| Comparison with Poisson distribution Blue bars denote a histogram of data divided into 1 sec bins. Red curve is a Poisson curve with rate = median count rate of data. |
 |
 |
| Quadrant-wise count rates Data is divided into 100 sec bins |
 |
|
| Module-wise count rates for Quadrant A Data is divided into 100 sec bins |
 |
 |
| Module-wise count rates for Quadrant B Data is divided into 100 sec bins |
 |
 |
| Module-wise count rates for Quadrant C Data is divided into 100 sec bins |
 |
 |
| Module-wise count rates for Quadrant D Data is divided into 100 sec bins |
 |
 |
| Parameter | Plot |
|---|---|
| CZT HV Monitor |  |
| D_VDD |  |
| Temperature 1 |  |
| Veto HV Monitor |  |
| Veto LLD |  |
| Alpha Counter |  |
| _CPM_Rate |  |
| CZT Counter |  |
| +2.5 Volts monitor |  |
| +5 Volts monitor |  |
| _ROLL_ROT |  |
| _Roll_DEC |  |
| _Roll_RA |  |
| Veto Counter |  |