| Param | Original file | Final file |
|---|---|---|
| Filename | modeM0/AS1A10_050T05_9000004342_30186cztM0_level2.evt | modeM0/AS1A10_050T05_9000004342_30186cztM0_level2_quad_clean.evt |
| Size (bytes) | 459,267,840 | 44,354,880 |
| Size | 438.0 MB | 42.3 MB |
| Events in quadrant A | 1,728,165 | 306,323 |
| Events in quadrant B | 2,636,835 | 303,611 |
| Events in quadrant C | 6,907,265 | 194,903 |
| Events in quadrant D | 2,405,777 | 296,273 |
| Mode M9 | |||
|---|---|---|---|
| Quadrant | BADHDUFLAG | Total packets | Discarded packets |
| A | 0 | 2 | 0 |
| B | 0 | 2 | 0 |
| C | 0 | 2 | 0 |
| D | 0 | 2 | 0 |
| Mode M0 | |||
|---|---|---|---|
| Quadrant | BADHDUFLAG | Total packets | Discarded packets |
| A | 0 | 7279 | 1 |
| B | 0 | 10452 | 1 |
| C | 0 | 22857 | 1 |
| D | 0 | 9375 | 1 |
| Mode SS | |||
|---|---|---|---|
| Quadrant | BADHDUFLAG | Total packets | Discarded packets |
| A | 0 | 70 | 0 |
| B | 0 | 70 | 0 |
| C | 0 | 70 | 0 |
| D | 0 | 70 | 0 |
| Quadrant | Total seconds | Saturated seconds | Saturation percentage |
|---|---|---|---|
| A | 3392 | 179 | 5.277123% |
| B | 3391 | 242 | 7.136538% |
| C | 3391 | 2630 | 77.558242% |
| D | 3391 | 242 | 7.136538% |
Noise dominated data is calculated using 1-second bins in cleaned event files. If a bin has >2000 counts, and if more than 50% of those come from <1% of pixels, then it is considered to be noise-dominated and hence unusable.
| Quadrant | # 1 sec bins | Bins with >0 counts | Bins with >2000 counts | High rate bins dominated by noise | Noise dominated (total time) | Noise dominated (detector-on time) | Marked lightcurve |
|---|---|---|---|---|---|---|---|
| A | 3592 | 3392 | 0 | 0 | 0.00% | 0.00% |  |
| B | 3591 | 3391 | 1 | 1 | 0.03% | 0.03% |  |
| C | 3591 | 3391 | 1915 | 1915 | 53.33% | 56.47% | 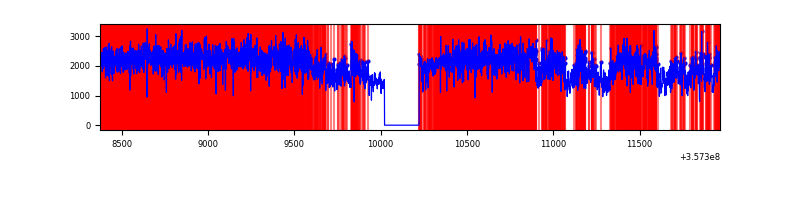 |
| D | 3591 | 3392 | 81 | 81 | 2.26% | 2.39% | 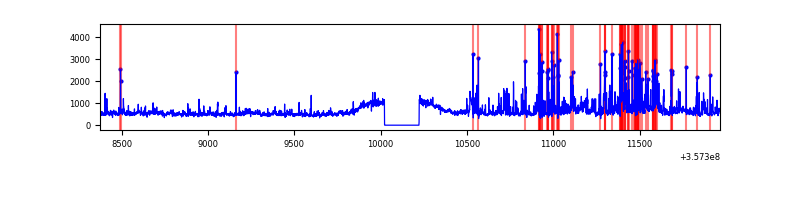 |
Top three noisy pixels from each quadrant. If the there are fewer than three noisy pixels in the level2.evt file, extra rows are filled as -1
| Pixel properties | Quadrant properties | ||||||
|---|---|---|---|---|---|---|---|
| Quadrant | DetID | PixID | Counts | Sigma | Mean | Median | Sigma |
| A | 8 | 192 | 9635 | 99.73 | 445 | 432 | 92.3 |
| A | 13 | 254 | 5821 | 58.4 | 445 | 432 | 92.3 |
| A | 3 | 137 | 4793 | 47.26 | 445 | 432 | 92.3 |
| B | 6 | 159 | 922648 | 10538.57 | 432 | 420 | 87.5 |
| B | 0 | 190 | 11386 | 125.31 | 432 | 420 | 87.5 |
| B | 12 | 111 | 11112 | 122.18 | 432 | 420 | 87.5 |
| C | 3 | 233 | 5563983 | 69686.78 | 330 | 332 | 79.8 |
| C | 14 | 238 | 49047 | 610.17 | 330 | 332 | 79.8 |
| C | 2 | 114 | 6538 | 77.73 | 330 | 332 | 79.8 |
| D | 1 | 52 | 425777 | 3941.61 | 431 | 420 | 107.9 |
| D | 8 | 195 | 113591 | 1048.71 | 431 | 420 | 107.9 |
| D | 2 | 250 | 92713 | 855.24 | 431 | 420 | 107.9 |
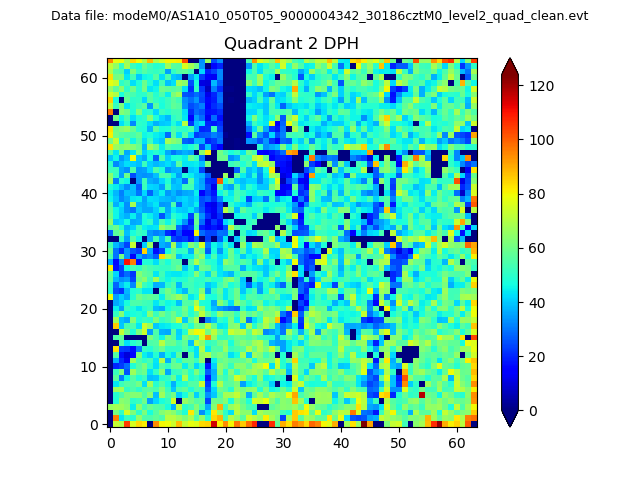
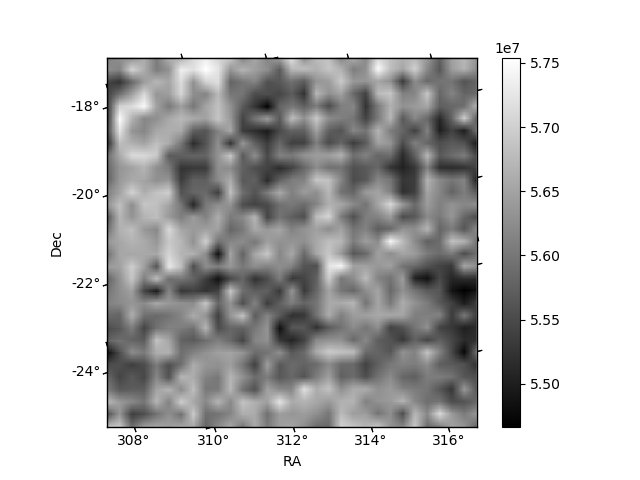
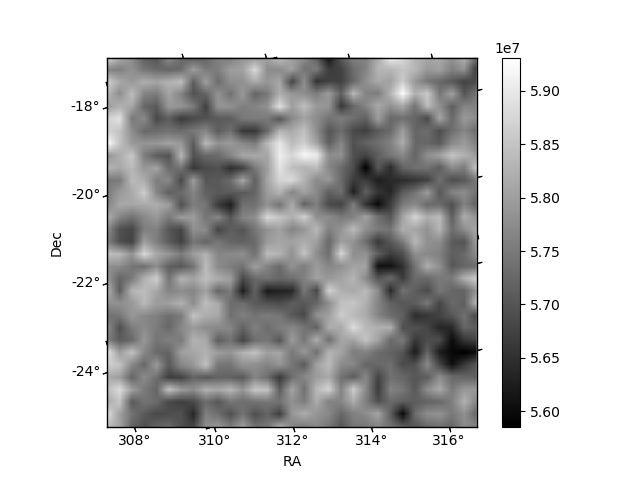
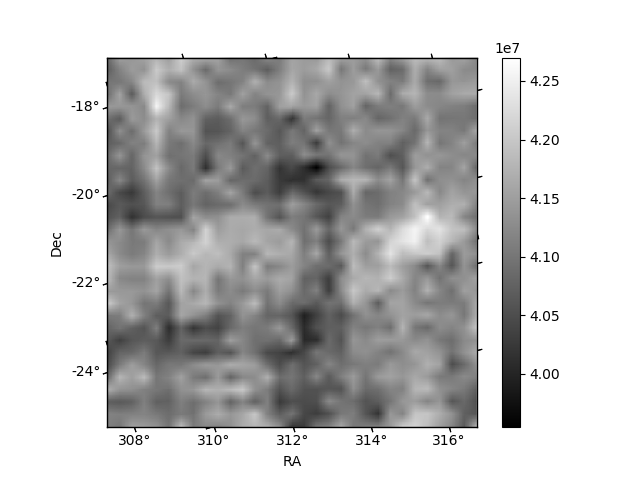
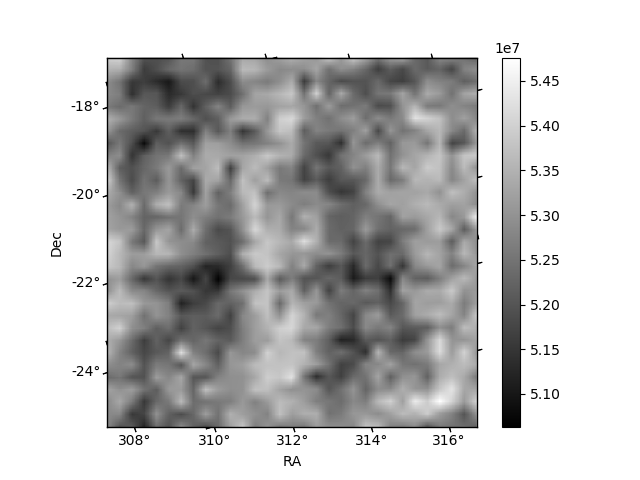
Histogram calculated using DETX and DETY for each event in the final _common_clean file
| Quadrant A | 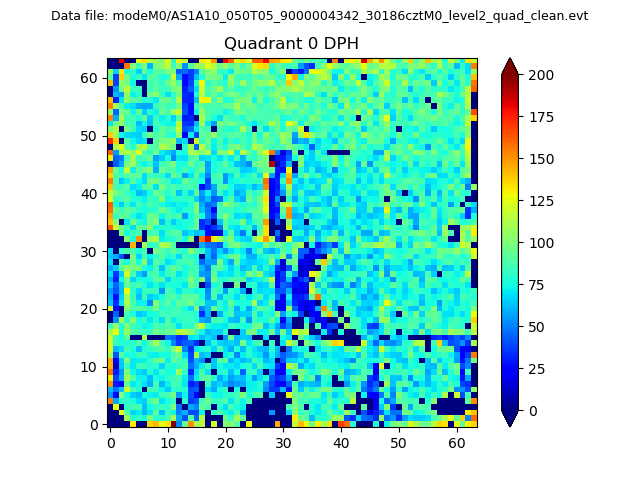 |
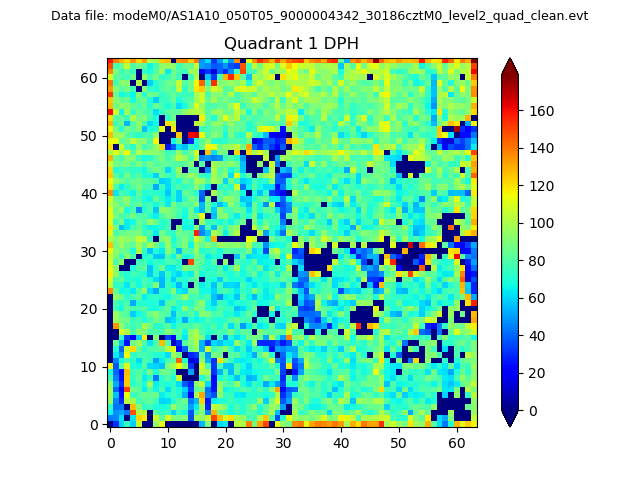 |
Quadrant B |
|---|---|---|---|
| Quadrant D | 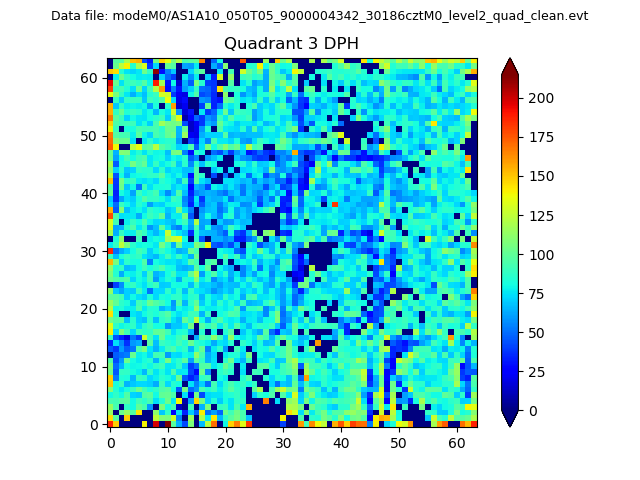 |
 |
Quadrant C |
| Plot type | Count rate plots | Images |
|---|---|---|
| Comparison with Poisson distribution Blue bars denote a histogram of data divided into 1 sec bins. Red curve is a Poisson curve with rate = median count rate of data. |
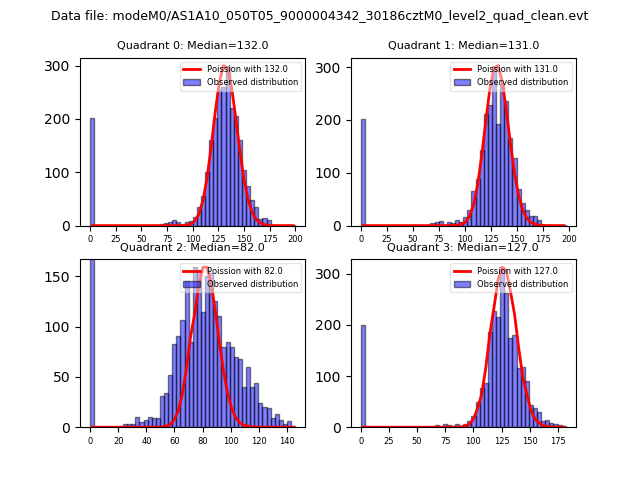 |
 |
| Quadrant-wise count rates Data is divided into 100 sec bins |
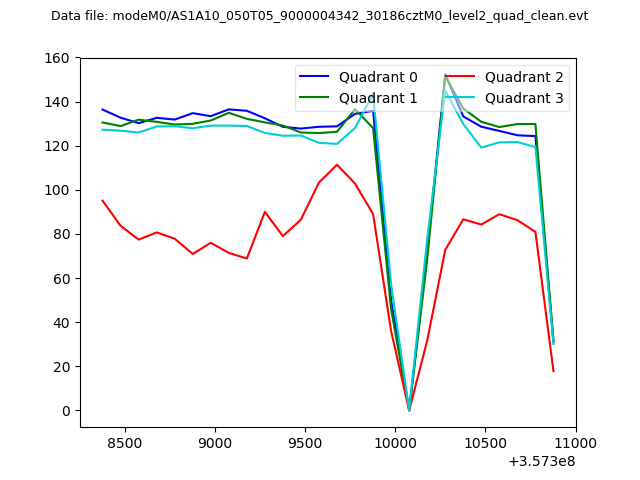 |
|
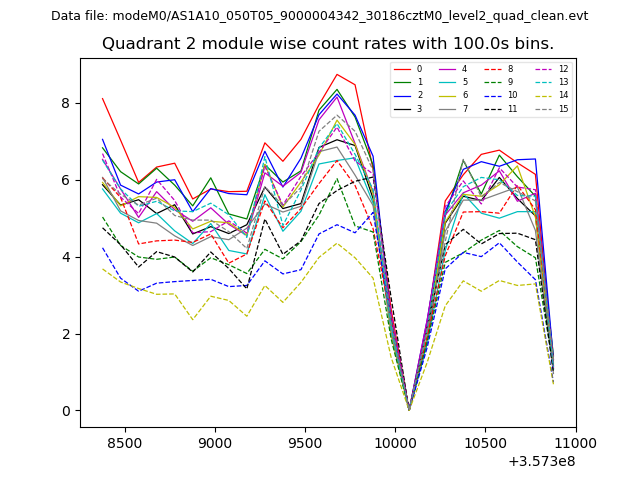
| Module-wise count rates for Quadrant A Data is divided into 100 sec bins |
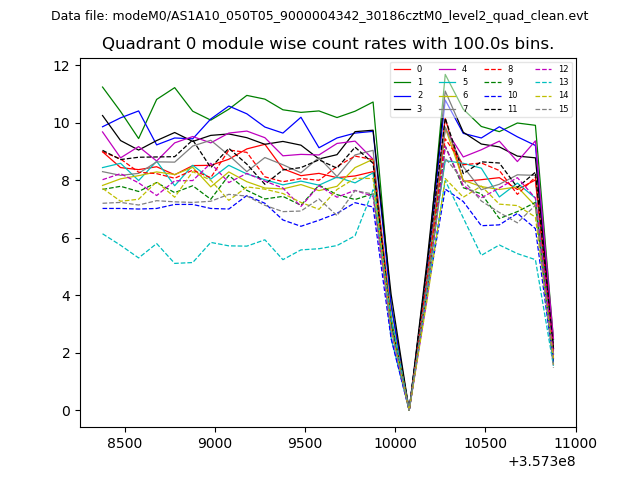 |
 |
| Module-wise count rates for Quadrant B Data is divided into 100 sec bins |
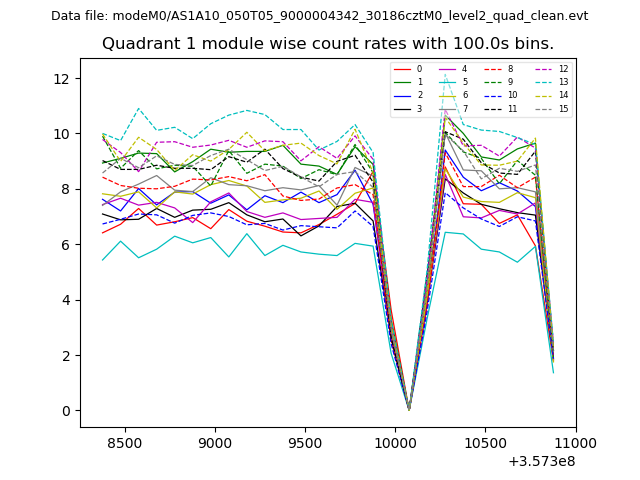 |
 |
| Module-wise count rates for Quadrant C Data is divided into 100 sec bins |
 |
 |
| Module-wise count rates for Quadrant D Data is divided into 100 sec bins |
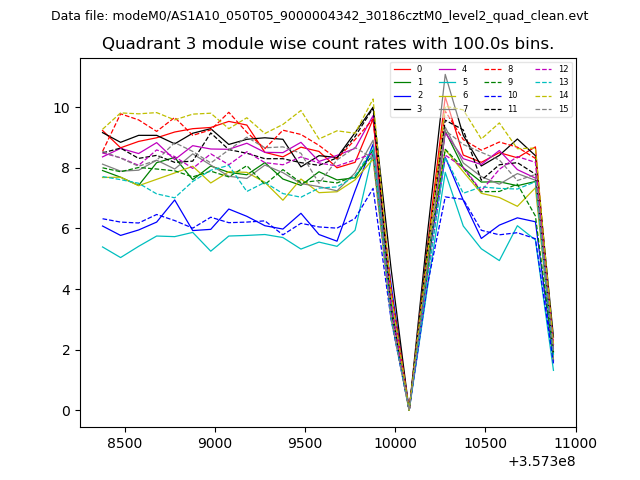 |
 |
| Parameter | Plot |
|---|---|
| CZT HV Monitor | 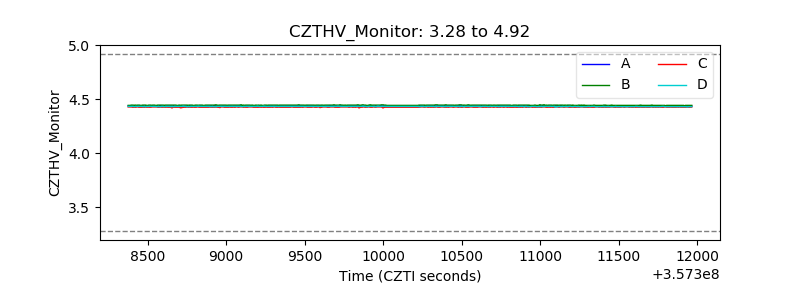 |
| D_VDD | 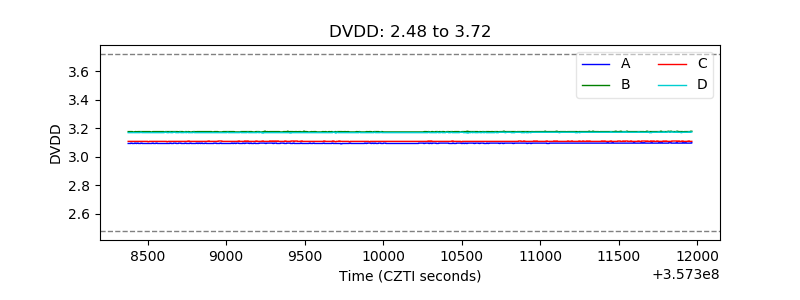 |
| Temperature 1 | 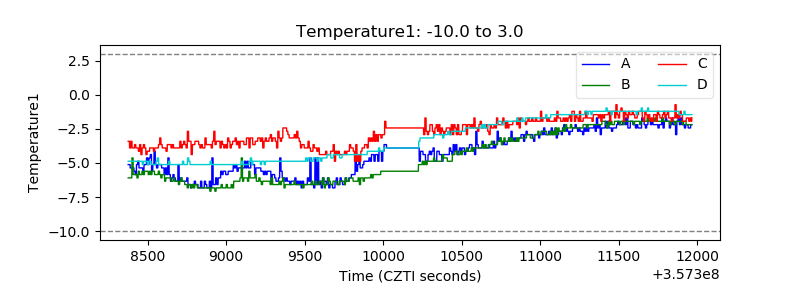 |
| Veto HV Monitor | 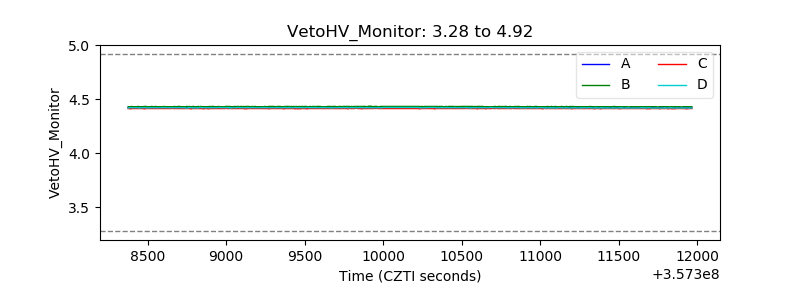 |
| Veto LLD | 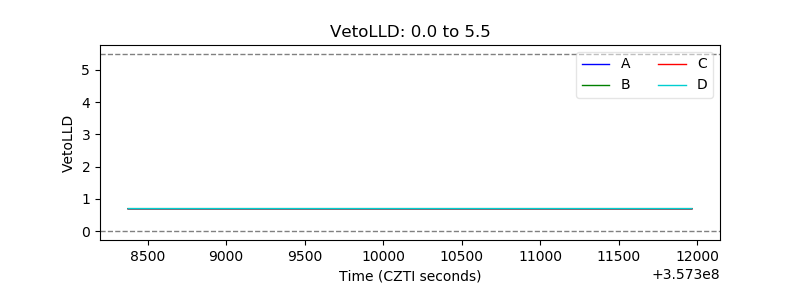 |
| Alpha Counter | 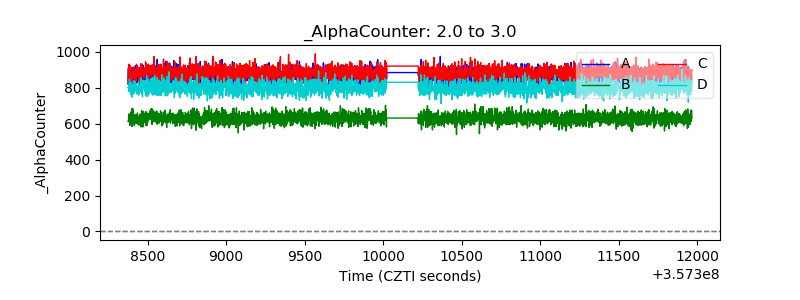 |
| _CPM_Rate | 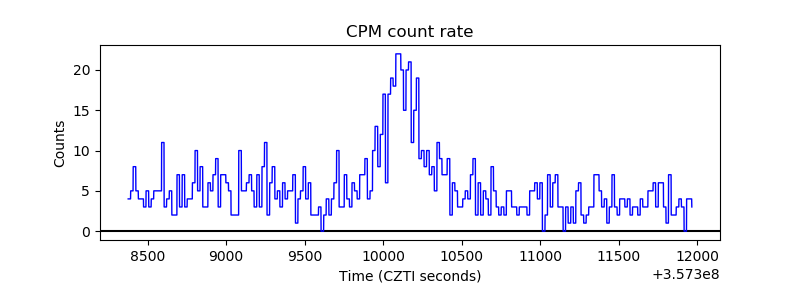 |
| CZT Counter | 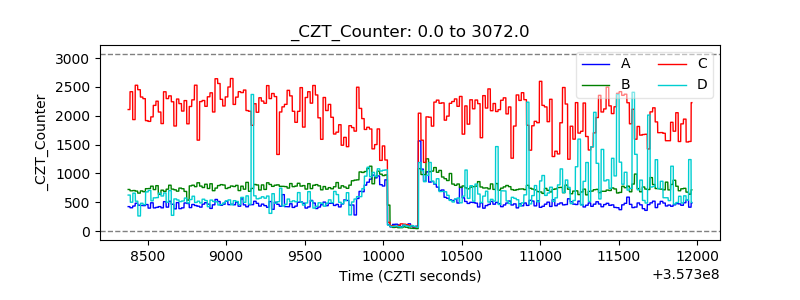 |
| +2.5 Volts monitor |  |
| +5 Volts monitor |  |
| _ROLL_ROT | 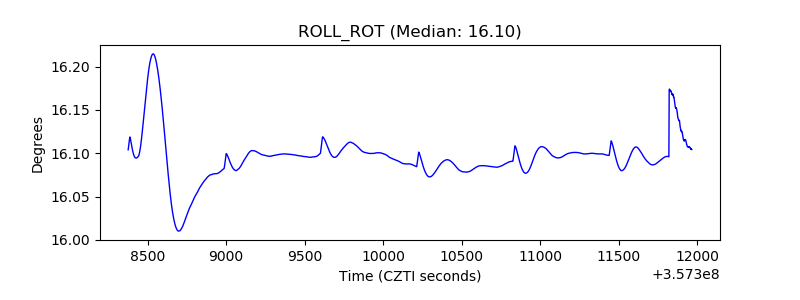 |
| _Roll_DEC | 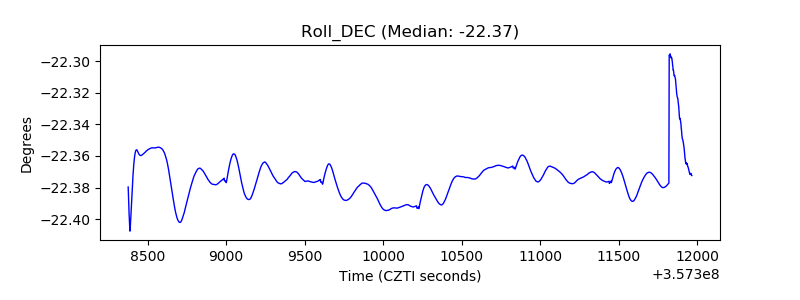 |
| _Roll_RA | 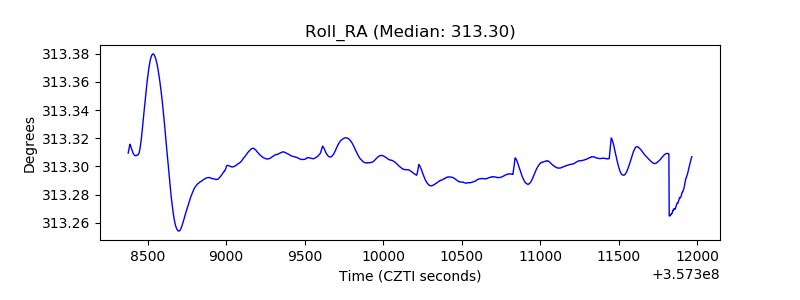 |
| Veto Counter | 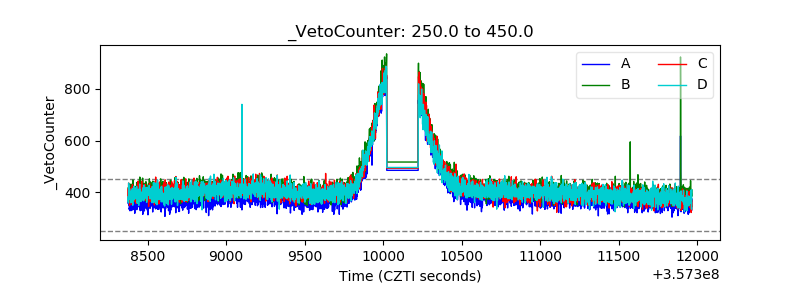 |