| Param | Original file | Final file |
|---|---|---|
| Filename | modeM0/AS1A10_050T05_9000004342_30188cztM0_level2.evt | modeM0/AS1A10_050T05_9000004342_30188cztM0_level2_quad_clean.evt |
| Size (bytes) | 977,019,840 | 79,680,960 |
| Size | 931.8 MB | 76.0 MB |
| Events in quadrant A | 3,877,805 | 495,005 |
| Events in quadrant B | 6,106,023 | 489,831 |
| Events in quadrant C | 13,232,826 | 386,455 |
| Events in quadrant D | 5,818,306 | 468,796 |
| Mode M9 | |||
|---|---|---|---|
| Quadrant | BADHDUFLAG | Total packets | Discarded packets |
| A | 0 | 5 | 0 |
| B | 0 | 5 | 0 |
| C | 0 | 5 | 0 |
| D | 0 | 5 | 0 |
| Mode M0 | |||
|---|---|---|---|
| Quadrant | BADHDUFLAG | Total packets | Discarded packets |
| A | 0 | 16773 | 1 |
| B | 0 | 24775 | 1 |
| C | 0 | 45110 | 1 |
| D | 0 | 22860 | 1 |
| Mode SS | |||
|---|---|---|---|
| Quadrant | BADHDUFLAG | Total packets | Discarded packets |
| A | 0 | 166 | 0 |
| B | 0 | 166 | 0 |
| C | 0 | 166 | 0 |
| D | 0 | 166 | 0 |
| Quadrant | Total seconds | Saturated seconds | Saturation percentage |
|---|---|---|---|
| A | 8229 | 77 | 0.935715% |
| B | 8229 | 125 | 1.519018% |
| C | 8229 | 3223 | 39.166363% |
| D | 8230 | 280 | 3.402187% |
Noise dominated data is calculated using 1-second bins in cleaned event files. If a bin has >2000 counts, and if more than 50% of those come from <1% of pixels, then it is considered to be noise-dominated and hence unusable.
| Quadrant | # 1 sec bins | Bins with >0 counts | Bins with >2000 counts | High rate bins dominated by noise | Noise dominated (total time) | Noise dominated (detector-on time) | Marked lightcurve |
|---|---|---|---|---|---|---|---|
| A | 8724 | 8229 | 0 | 0 | 0.00% | 0.00% | 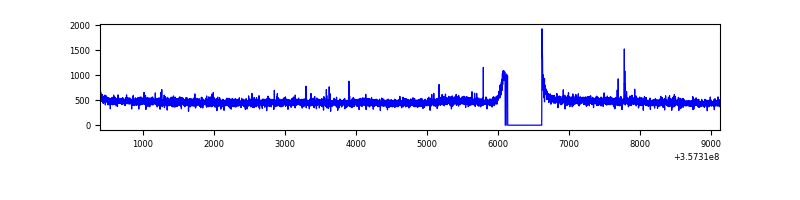 |
| B | 8724 | 8229 | 1 | 1 | 0.01% | 0.01% | 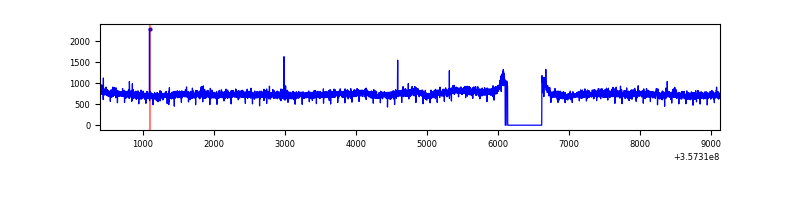 |
| C | 8724 | 8229 | 2249 | 2249 | 25.78% | 27.33% | 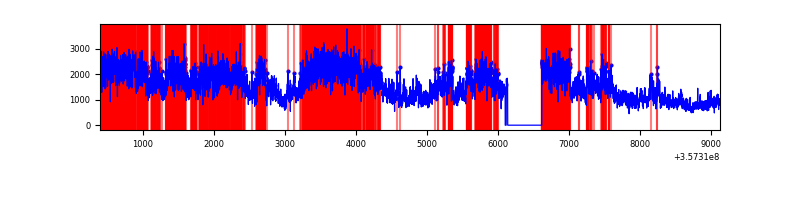 |
| D | 8725 | 8231 | 171 | 171 | 1.96% | 2.08% | 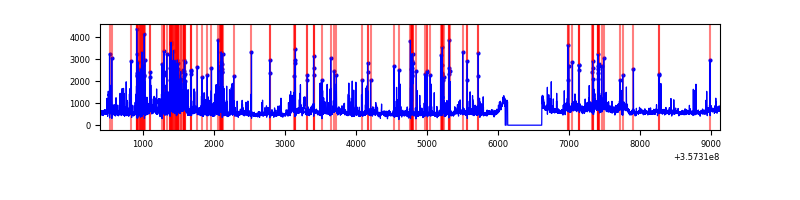 |
Top three noisy pixels from each quadrant. If the there are fewer than three noisy pixels in the level2.evt file, extra rows are filled as -1
| Pixel properties | Quadrant properties | ||||||
|---|---|---|---|---|---|---|---|
| Quadrant | DetID | PixID | Counts | Sigma | Mean | Median | Sigma |
| A | 13 | 254 | 14994 | 68.92 | 999 | 975 | 203.4 |
| A | 8 | 192 | 12273 | 55.54 | 999 | 975 | 203.4 |
| A | 3 | 137 | 10441 | 46.54 | 999 | 975 | 203.4 |
| B | 6 | 159 | 2228370 | 11682.82 | 980 | 951 | 190.7 |
| B | 0 | 190 | 29056 | 147.41 | 980 | 951 | 190.7 |
| B | 12 | 111 | 23912 | 120.43 | 980 | 951 | 190.7 |
| C | 3 | 233 | 9719197 | 47654.68 | 860 | 864 | 203.9 |
| C | 14 | 238 | 136595 | 665.57 | 860 | 864 | 203.9 |
| C | 2 | 114 | 17783 | 82.96 | 860 | 864 | 203.9 |
| D | 1 | 52 | 998110 | 4005.78 | 951 | 930 | 248.9 |
| D | 8 | 195 | 353968 | 1418.19 | 951 | 930 | 248.9 |
| D | 13 | 104 | 237927 | 952.04 | 951 | 930 | 248.9 |
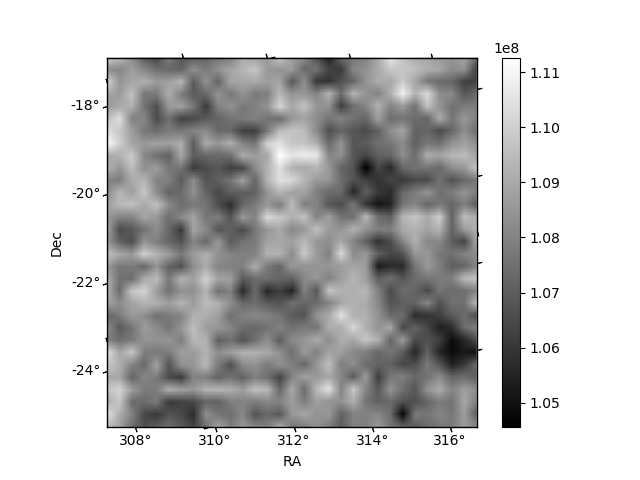
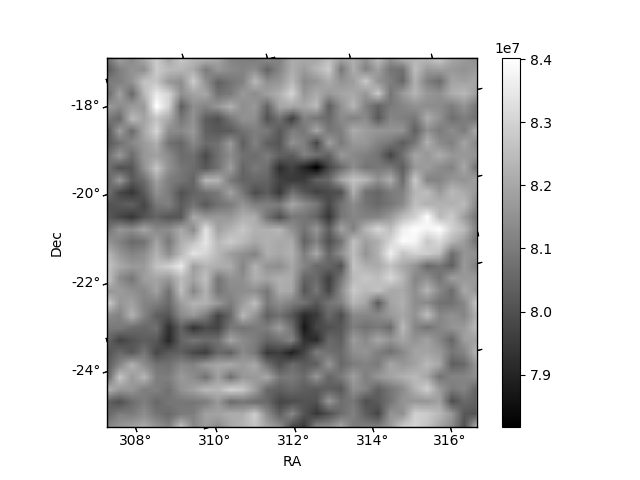
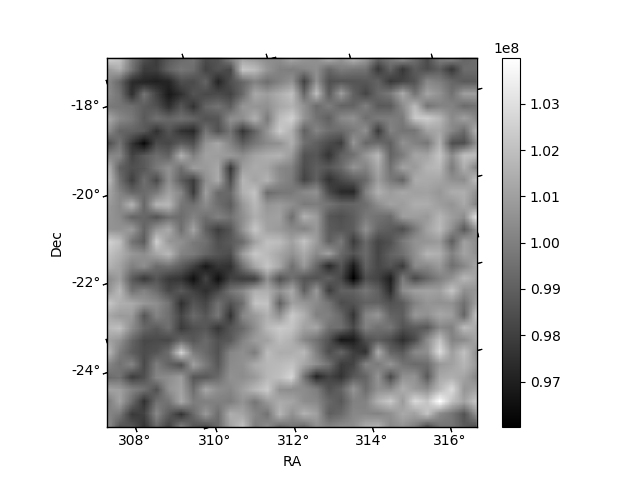
Histogram calculated using DETX and DETY for each event in the final _common_clean file
| Quadrant A | 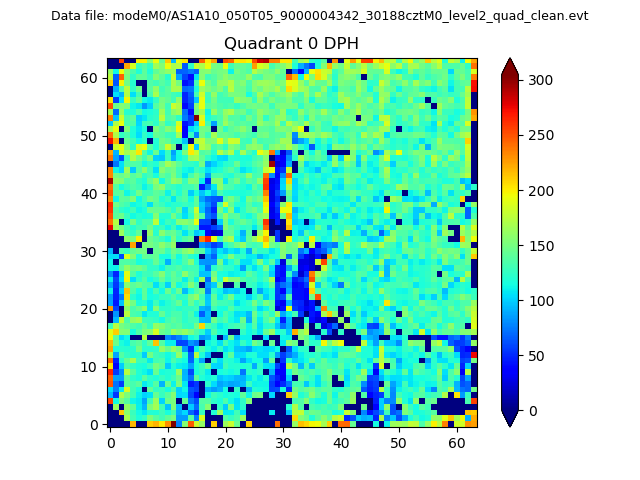 |
 |
Quadrant B |
|---|---|---|---|
| Quadrant D | 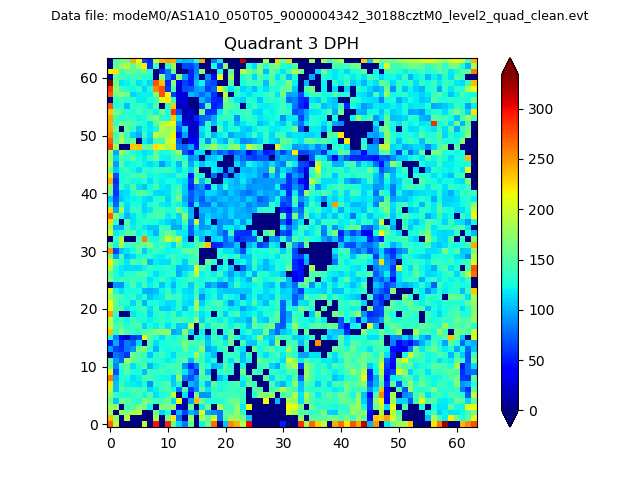 |
 |
Quadrant C |
| Plot type | Count rate plots | Images |
|---|---|---|
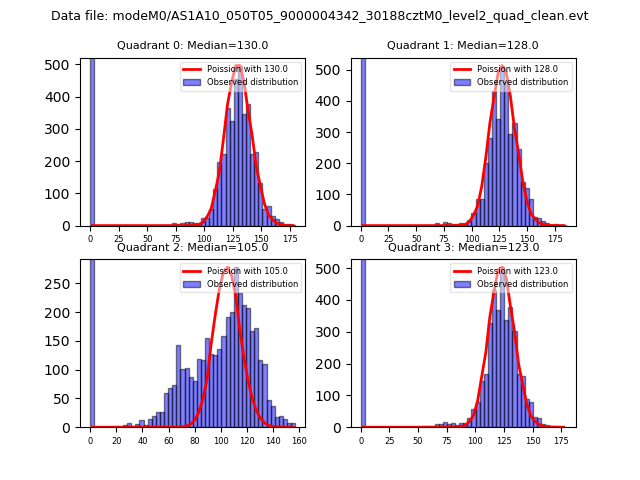
| Comparison with Poisson distribution Blue bars denote a histogram of data divided into 1 sec bins. Red curve is a Poisson curve with rate = median count rate of data. |
 |
 |
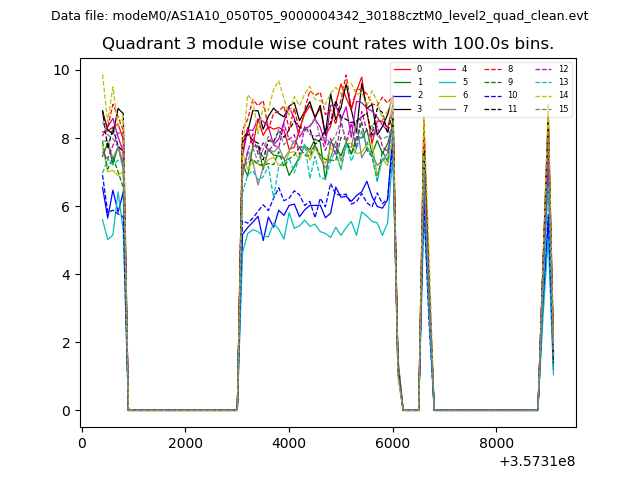
| Quadrant-wise count rates Data is divided into 100 sec bins |
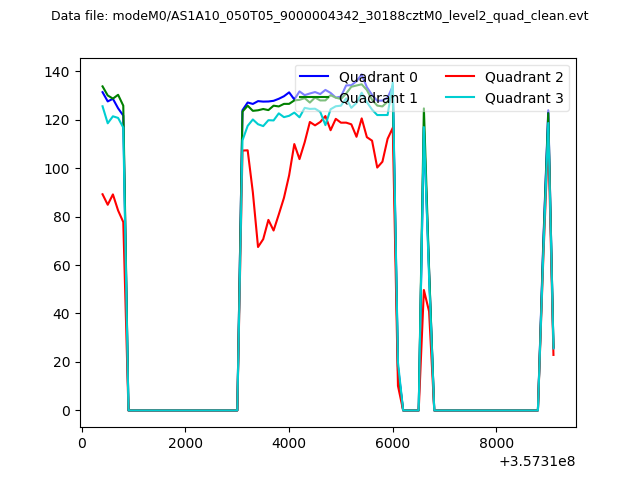 |
|
| Module-wise count rates for Quadrant A Data is divided into 100 sec bins |
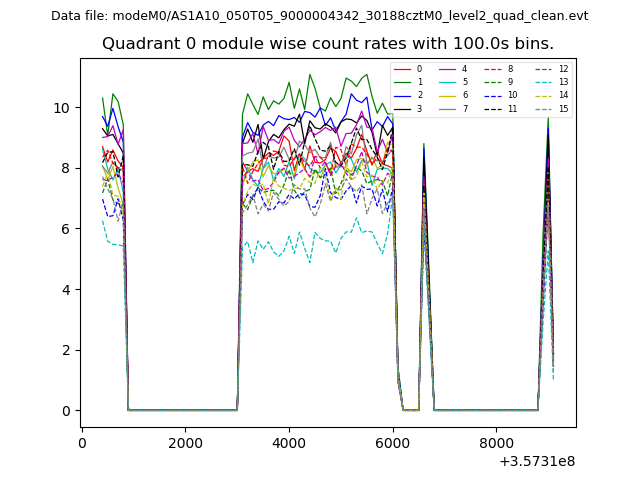 |
 |
| Module-wise count rates for Quadrant B Data is divided into 100 sec bins |
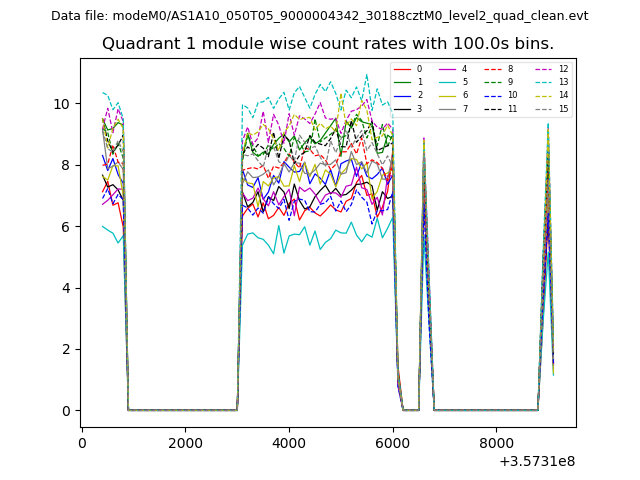 |
 |
| Module-wise count rates for Quadrant C Data is divided into 100 sec bins |
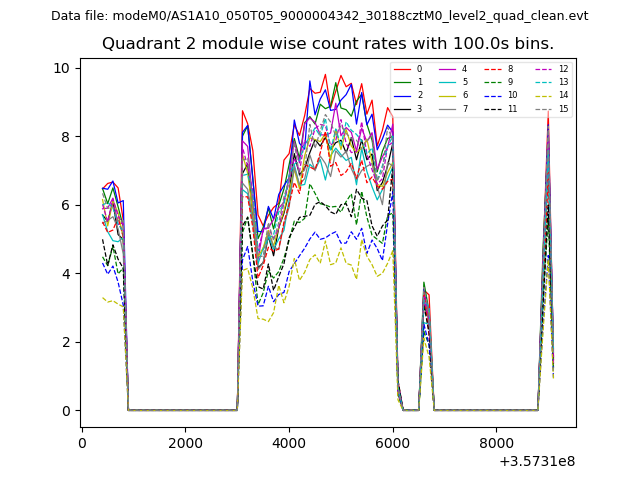 |
 |
| Module-wise count rates for Quadrant D Data is divided into 100 sec bins |
 |
 |
| Parameter | Plot |
|---|---|
| CZT HV Monitor | 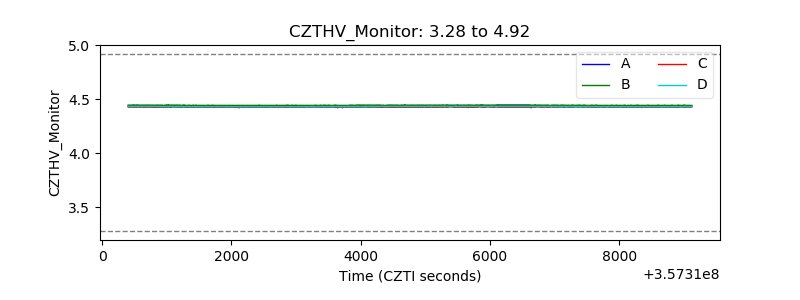 |
| D_VDD | 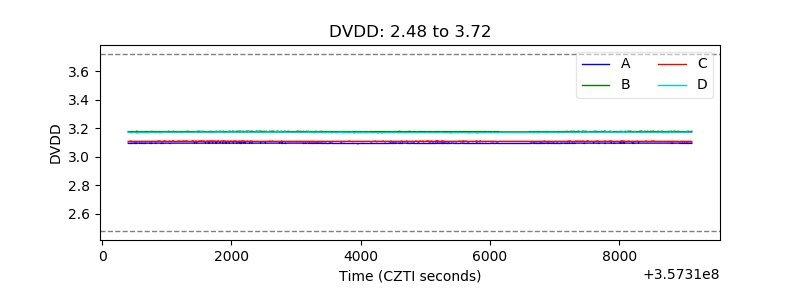 |
| Temperature 1 | 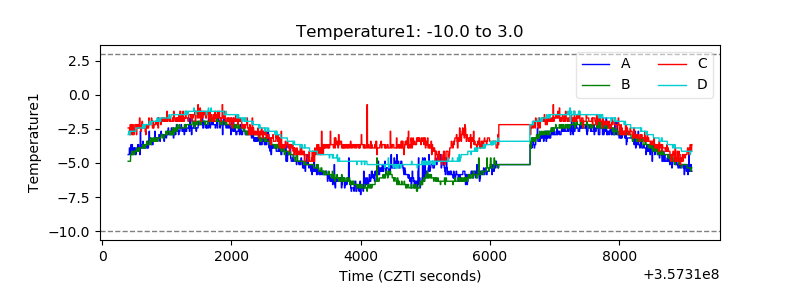 |
| Veto HV Monitor | 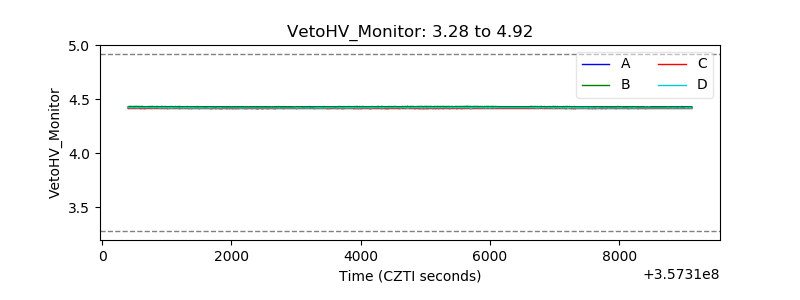 |
| Veto LLD | 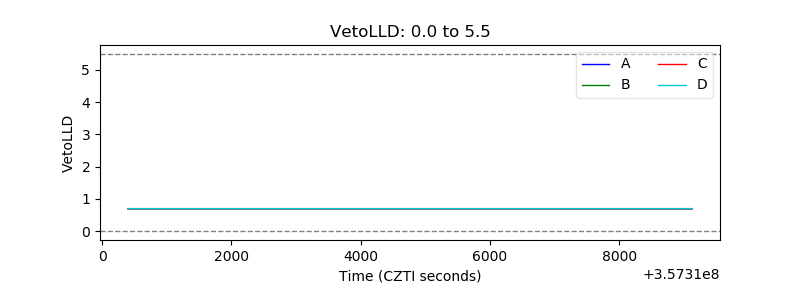 |
| Alpha Counter | 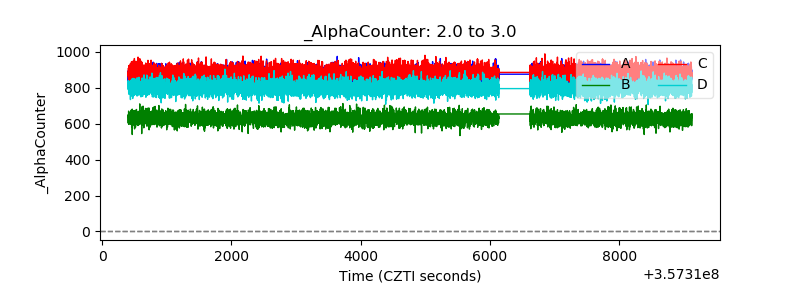 |
| _CPM_Rate | 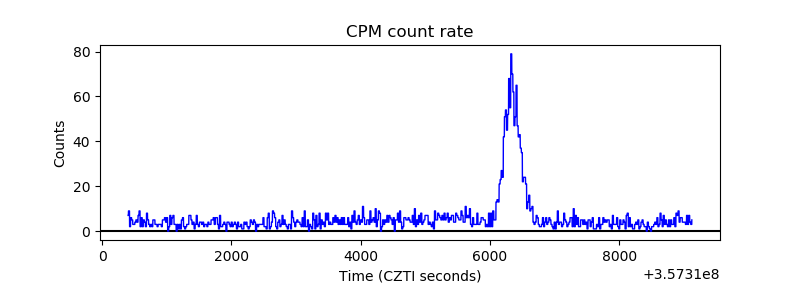 |
| CZT Counter | 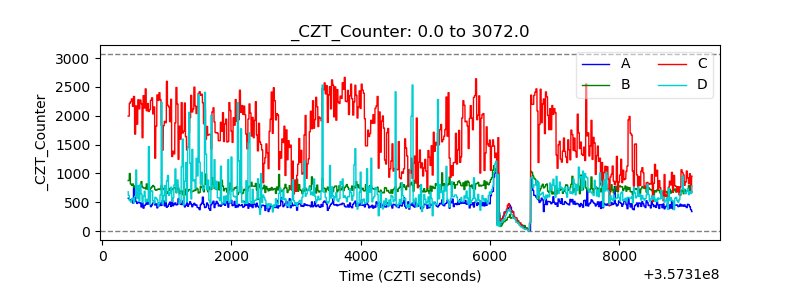 |
| +2.5 Volts monitor |  |
| +5 Volts monitor |  |
| _ROLL_ROT | 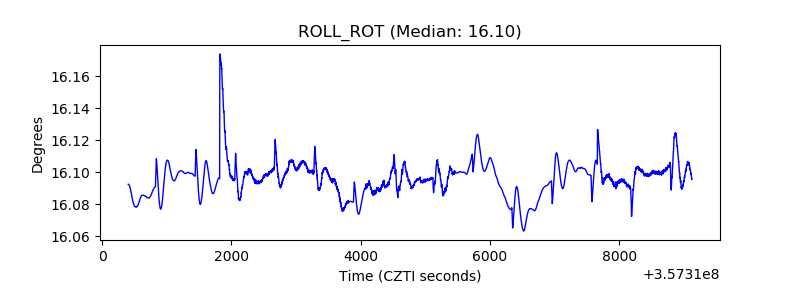 |
| _Roll_DEC | 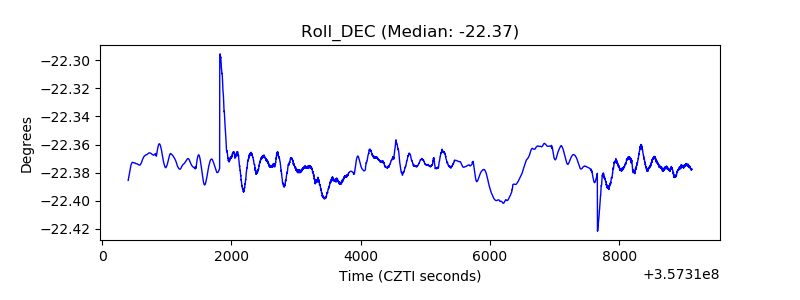 |
| _Roll_RA | 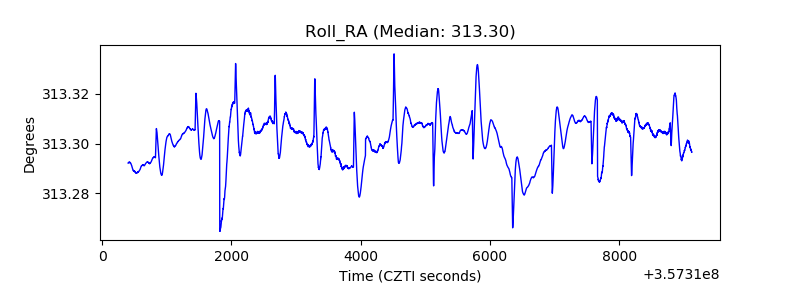 |
| Veto Counter | 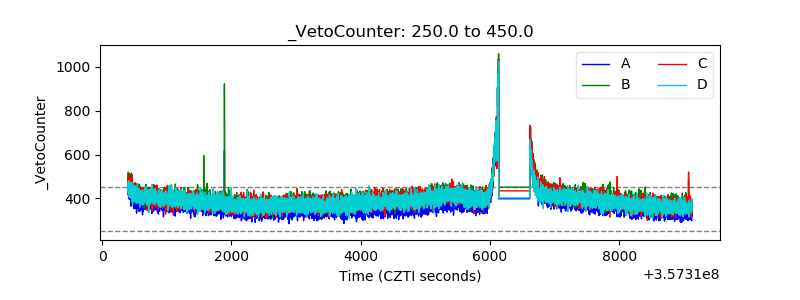 |