| Param | Original file | Final file |
|---|---|---|
| Filename | modeM0/AS1A10_050T05_9000004342_30189cztM0_level2.evt | modeM0/AS1A10_050T05_9000004342_30189cztM0_level2_quad_clean.evt |
| Size (bytes) | 1,252,379,520 | 135,357,120 |
| Size | 1.2 GB | 129.1 MB |
| Events in quadrant A | 4,949,350 | 897,811 |
| Events in quadrant B | 7,980,650 | 881,991 |
| Events in quadrant C | 16,818,550 | 749,687 |
| Events in quadrant D | 7,480,753 | 848,290 |
| Mode M9 | |||
|---|---|---|---|
| Quadrant | BADHDUFLAG | Total packets | Discarded packets |
| A | 0 | 15 | 0 |
| B | 0 | 15 | 0 |
| C | 0 | 15 | 0 |
| D | 0 | 15 | 0 |
| Mode M0 | |||
|---|---|---|---|
| Quadrant | BADHDUFLAG | Total packets | Discarded packets |
| A | 0 | 21388 | 2 |
| B | 0 | 31476 | 2 |
| C | 0 | 57260 | 2 |
| D | 0 | 29306 | 2 |
| Mode SS | |||
|---|---|---|---|
| Quadrant | BADHDUFLAG | Total packets | Discarded packets |
| A | 0 | 212 | 0 |
| B | 0 | 212 | 0 |
| C | 0 | 212 | 0 |
| D | 0 | 212 | 0 |
| Quadrant | Total seconds | Saturated seconds | Saturation percentage |
|---|---|---|---|
| A | 10401 | 114 | 1.096048% |
| B | 10402 | 182 | 1.749664% |
| C | 10402 | 4076 | 39.184772% |
| D | 10402 | 409 | 3.931936% |
Noise dominated data is calculated using 1-second bins in cleaned event files. If a bin has >2000 counts, and if more than 50% of those come from <1% of pixels, then it is considered to be noise-dominated and hence unusable.
| Quadrant | # 1 sec bins | Bins with >0 counts | Bins with >2000 counts | High rate bins dominated by noise | Noise dominated (total time) | Noise dominated (detector-on time) | Marked lightcurve |
|---|---|---|---|---|---|---|---|
| A | 11971 | 10401 | 0 | 0 | 0.00% | 0.00% | 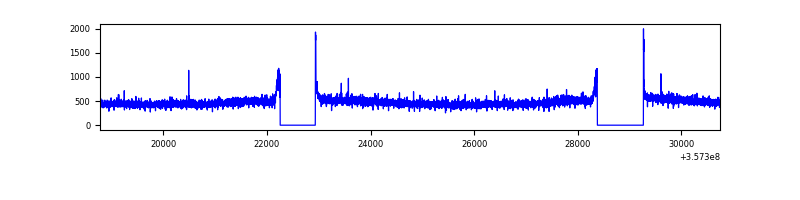 |
| B | 11972 | 10402 | 5 | 5 | 0.04% | 0.05% | 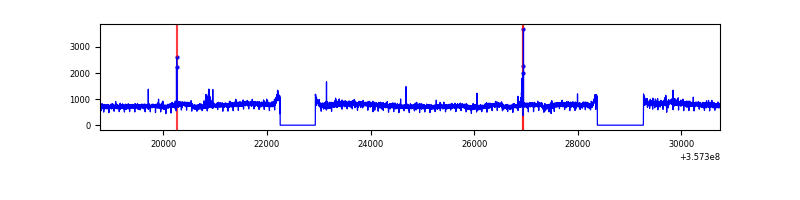 |
| C | 11972 | 10402 | 2525 | 2525 | 21.09% | 24.27% | 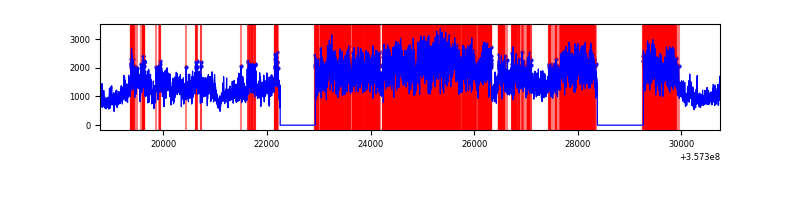 |
| D | 11972 | 10402 | 261 | 261 | 2.18% | 2.51% | 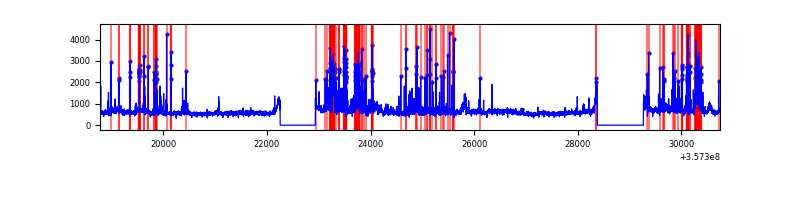 |
Top three noisy pixels from each quadrant. If the there are fewer than three noisy pixels in the level2.evt file, extra rows are filled as -1
| Pixel properties | Quadrant properties | ||||||
|---|---|---|---|---|---|---|---|
| Quadrant | DetID | PixID | Counts | Sigma | Mean | Median | Sigma |
| A | 8 | 192 | 27927 | 103.76 | 1273 | 1244 | 257.2 |
| A | 13 | 254 | 18951 | 68.86 | 1273 | 1244 | 257.2 |
| A | 3 | 137 | 13243 | 46.66 | 1273 | 1244 | 257.2 |
| B | 6 | 159 | 2960943 | 12085.2 | 1256 | 1223 | 244.9 |
| B | 0 | 230 | 56912 | 227.39 | 1256 | 1223 | 244.9 |
| B | 12 | 111 | 30336 | 118.87 | 1256 | 1223 | 244.9 |
| C | 3 | 233 | 12235269 | 46569.53 | 1116 | 1121 | 262.7 |
| C | 14 | 238 | 173531 | 656.28 | 1116 | 1121 | 262.7 |
| C | 15 | 208 | 26471 | 96.5 | 1116 | 1121 | 262.7 |
| D | 7 | 223 | 799559 | 2602.33 | 1219 | 1190 | 306.8 |
| D | 12 | 233 | 423264 | 1375.77 | 1219 | 1190 | 306.8 |
| D | 13 | 249 | 400317 | 1300.98 | 1219 | 1190 | 306.8 |
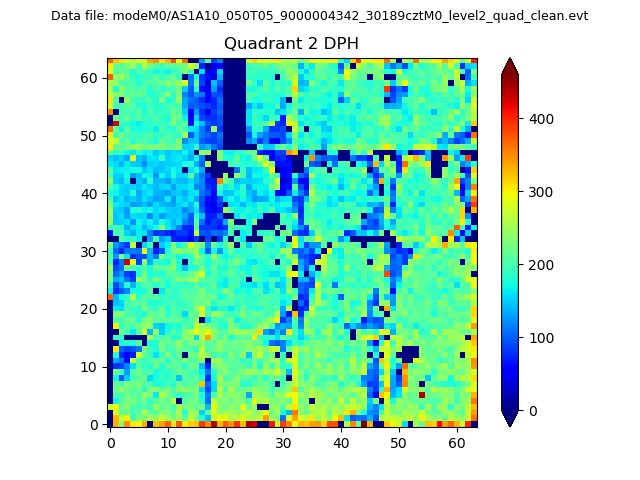
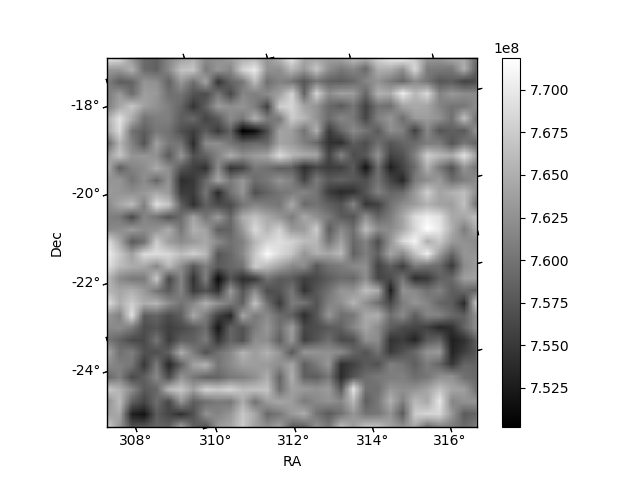
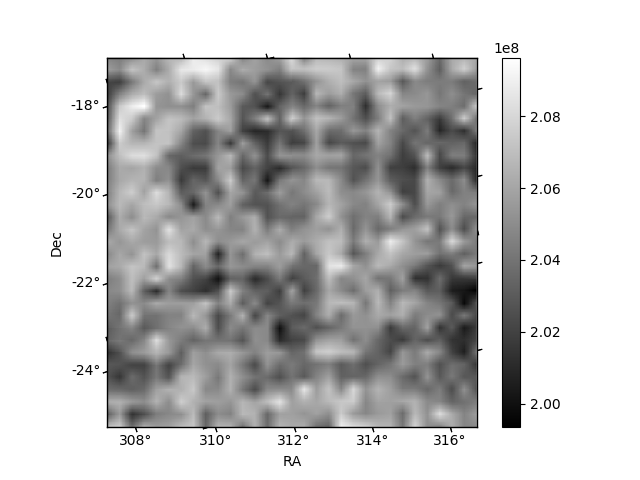
Histogram calculated using DETX and DETY for each event in the final _common_clean file
| Quadrant A | 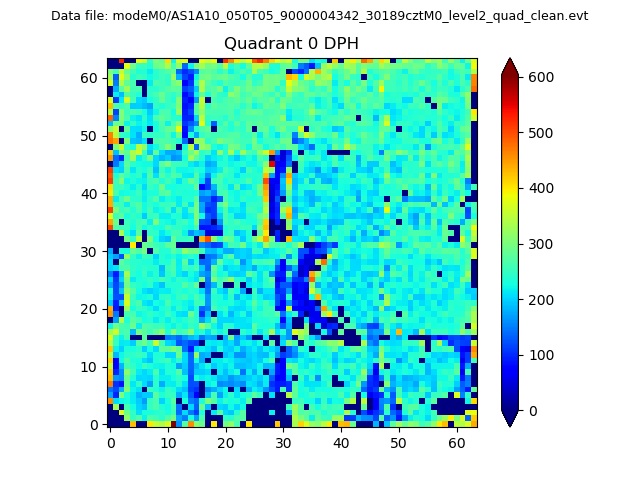 |
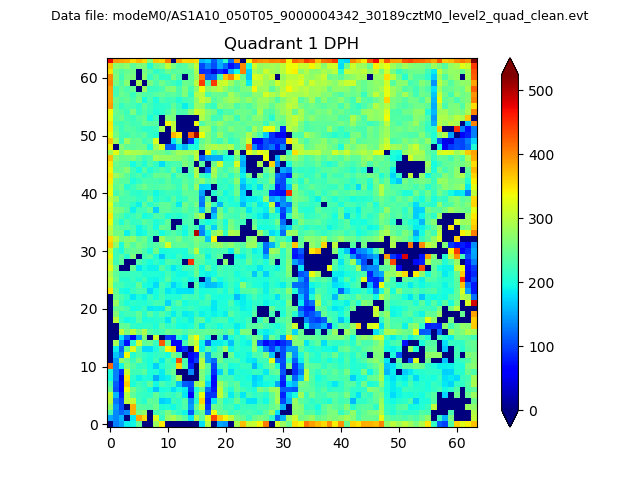 |
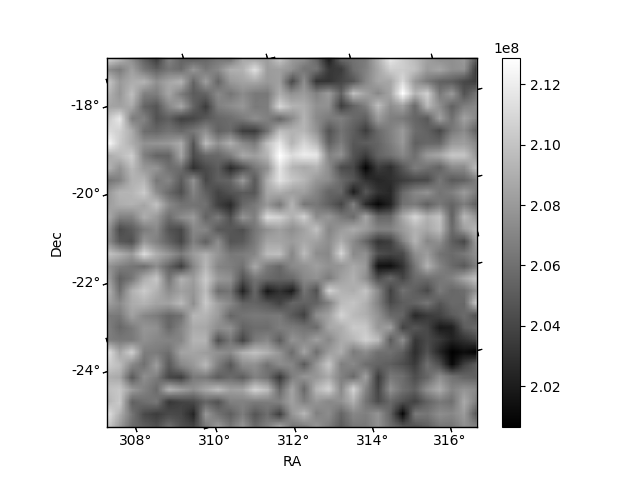
Quadrant B |
|---|---|---|---|
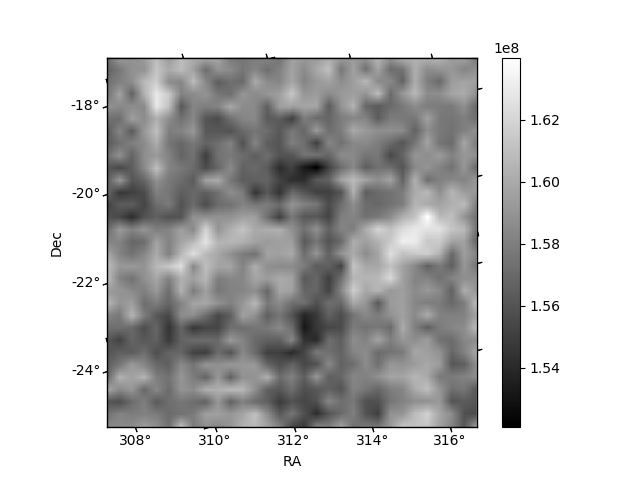
| Quadrant D | 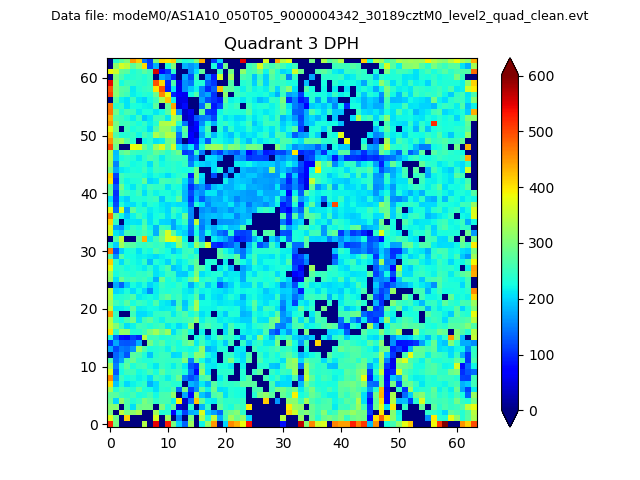 |
 |
Quadrant C |
| Plot type | Count rate plots | Images |
|---|---|---|
| Comparison with Poisson distribution Blue bars denote a histogram of data divided into 1 sec bins. Red curve is a Poisson curve with rate = median count rate of data. |
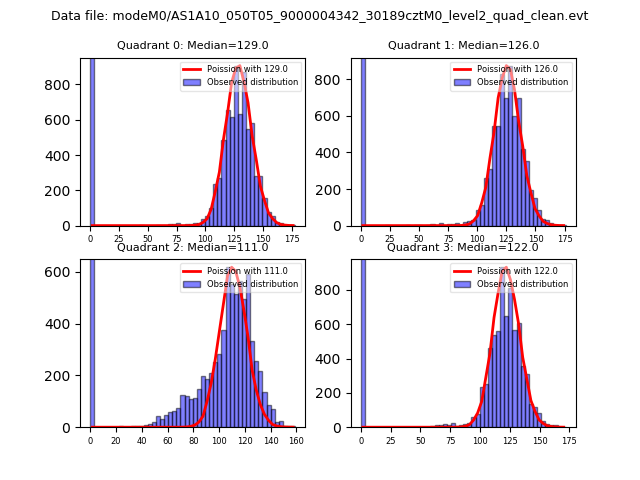 |
 |
| Quadrant-wise count rates Data is divided into 100 sec bins |
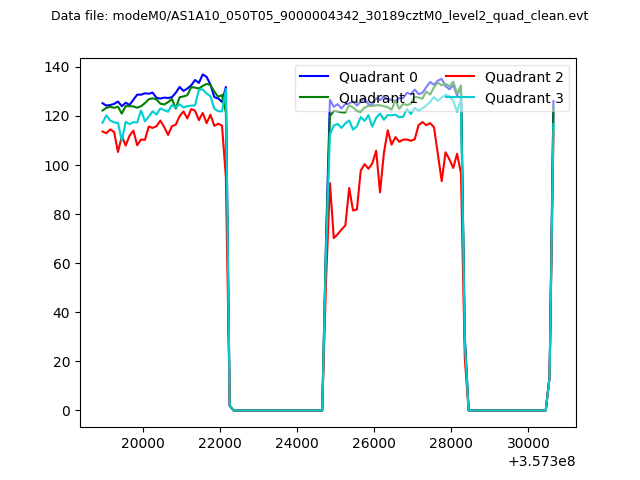 |
|
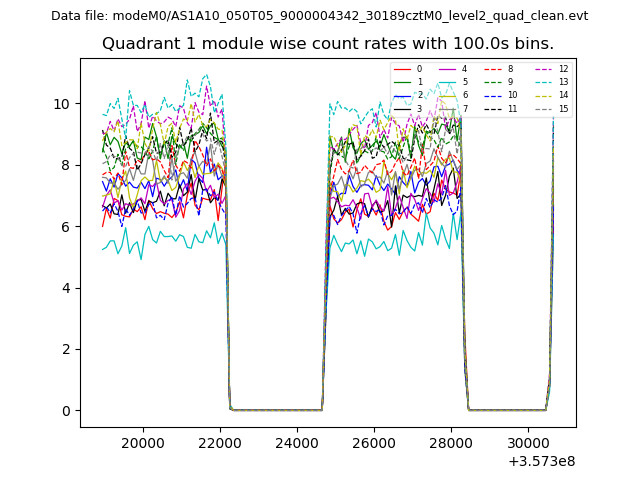
| Module-wise count rates for Quadrant A Data is divided into 100 sec bins |
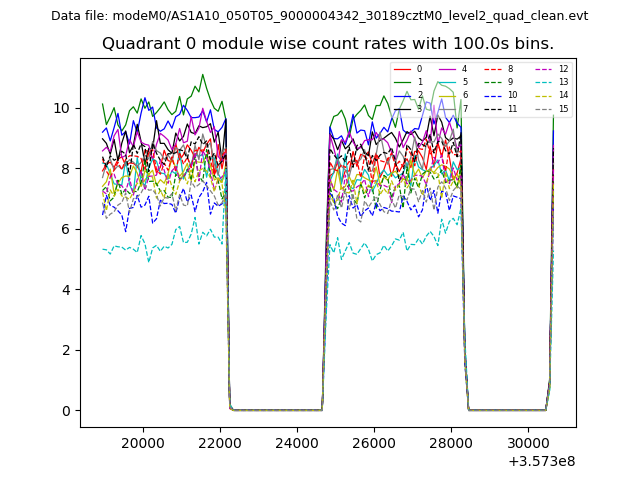 |
 |
| Module-wise count rates for Quadrant B Data is divided into 100 sec bins |
 |
 |
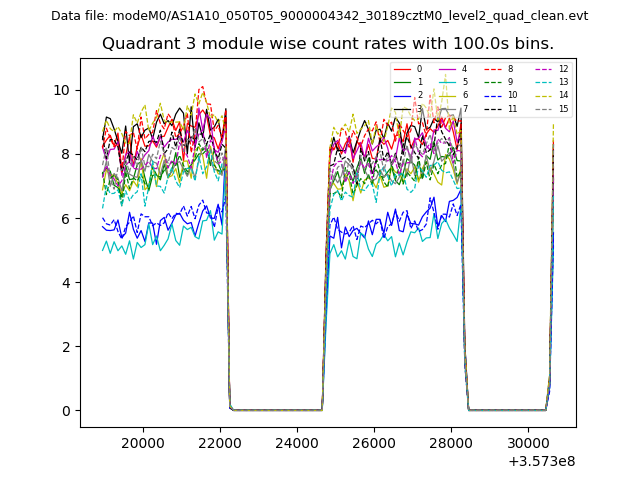
| Module-wise count rates for Quadrant C Data is divided into 100 sec bins |
 |
 |
| Module-wise count rates for Quadrant D Data is divided into 100 sec bins |
 |
 |
| Parameter | Plot |
|---|---|
| CZT HV Monitor |  |
| D_VDD | 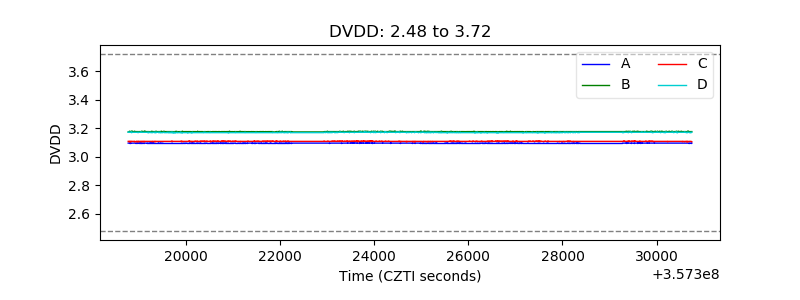 |
| Temperature 1 | 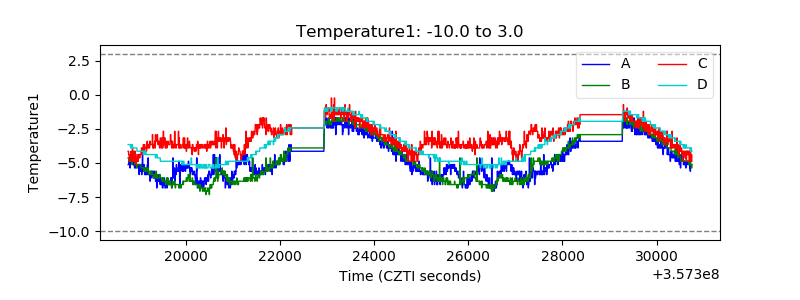 |
| Veto HV Monitor | 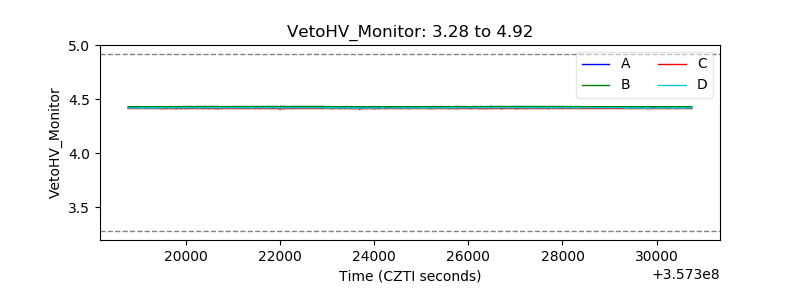 |
| Veto LLD | 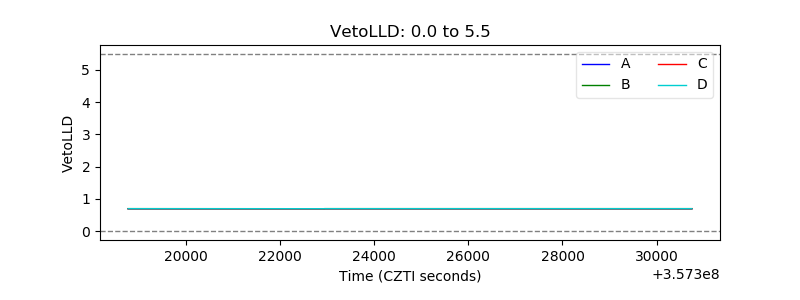 |
| Alpha Counter | 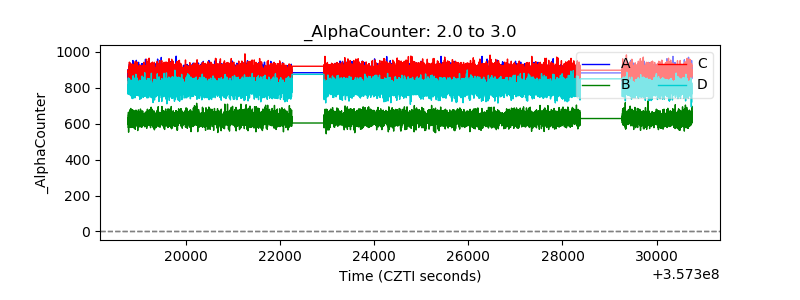 |
| _CPM_Rate | 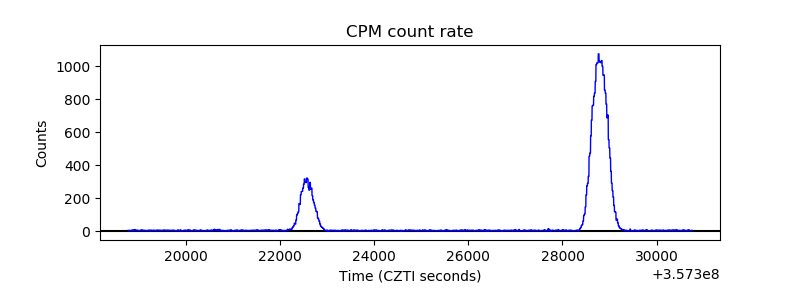 |
| CZT Counter | 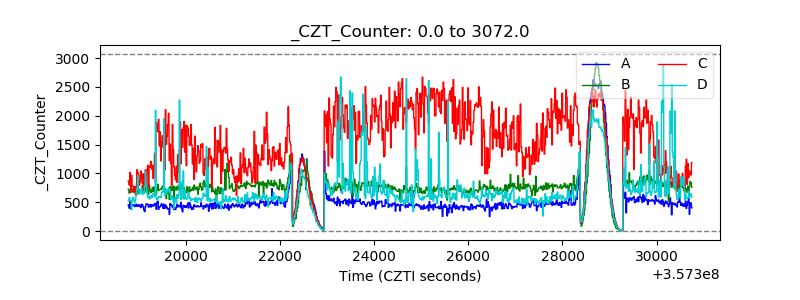 |
| +2.5 Volts monitor | 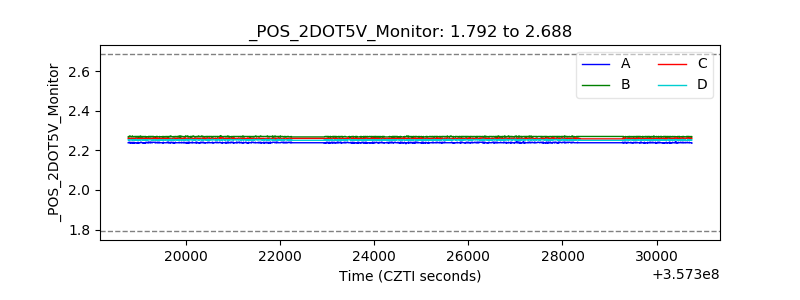 |
| +5 Volts monitor |  |
| _ROLL_ROT | 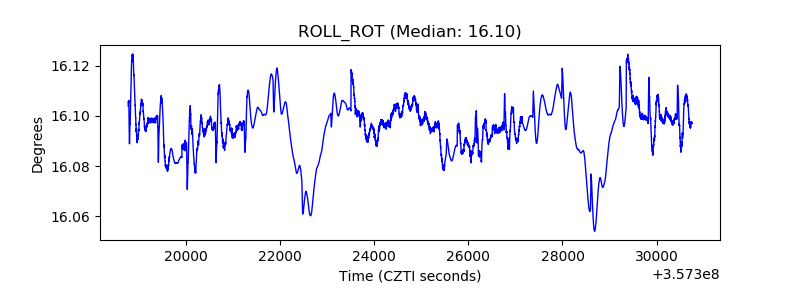 |
| _Roll_DEC | 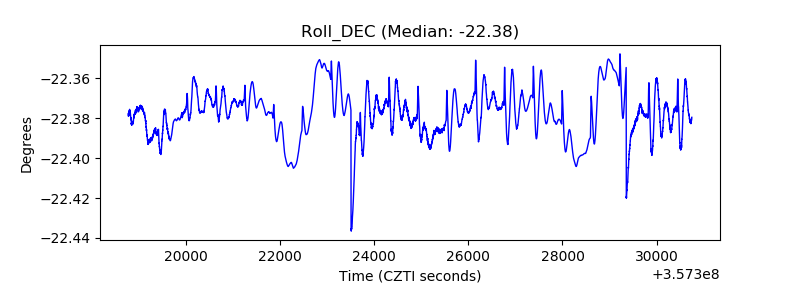 |
| _Roll_RA | 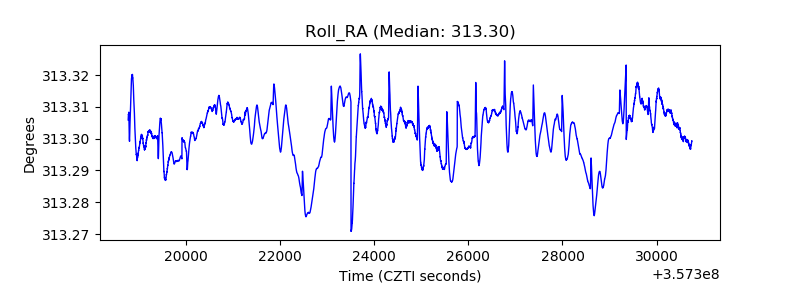 |
| Veto Counter | 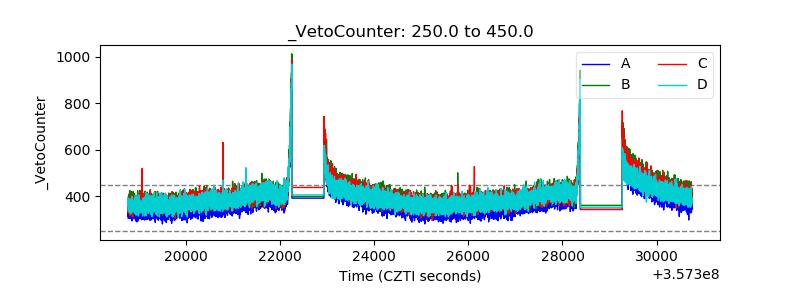 |