| Param | Original file | Final file |
|---|---|---|
| Filename | modeM0/AS1A10_050T05_9000004342_30193cztM0_level2.evt | modeM0/AS1A10_050T05_9000004342_30193cztM0_level2_quad_clean.evt |
| Size (bytes) | 708,036,480 | 91,771,200 |
| Size | 675.2 MB | 87.5 MB |
| Events in quadrant A | 3,237,332 | 603,555 |
| Events in quadrant B | 5,063,468 | 605,020 |
| Events in quadrant C | 8,435,368 | 552,034 |
| Events in quadrant D | 4,278,522 | 574,817 |
| Mode M9 | |||
|---|---|---|---|
| Quadrant | BADHDUFLAG | Total packets | Discarded packets |
| A | 0 | 19 | 0 |
| B | 0 | 20 | 0 |
| C | 0 | 20 | 0 |
| D | 0 | 20 | 0 |
| Mode M0 | |||
|---|---|---|---|
| Quadrant | BADHDUFLAG | Total packets | Discarded packets |
| A | 0 | 13722 | 2 |
| B | 0 | 19402 | 2 |
| C | 0 | 29536 | 2 |
| D | 0 | 17100 | 2 |
| Mode SS | |||
|---|---|---|---|
| Quadrant | BADHDUFLAG | Total packets | Discarded packets |
| A | 0 | 132 | 0 |
| B | 0 | 132 | 0 |
| C | 0 | 132 | 0 |
| D | 0 | 132 | 0 |
| Quadrant | Total seconds | Saturated seconds | Saturation percentage |
|---|---|---|---|
| A | 6347 | 68 | 1.071372% |
| B | 6347 | 102 | 1.607058% |
| C | 6347 | 1108 | 17.457066% |
| D | 6347 | 115 | 1.811880% |
Noise dominated data is calculated using 1-second bins in cleaned event files. If a bin has >2000 counts, and if more than 50% of those come from <1% of pixels, then it is considered to be noise-dominated and hence unusable.
| Quadrant | # 1 sec bins | Bins with >0 counts | Bins with >2000 counts | High rate bins dominated by noise | Noise dominated (total time) | Noise dominated (detector-on time) | Marked lightcurve |
|---|---|---|---|---|---|---|---|
| A | 7507 | 6348 | 1 | 1 | 0.01% | 0.02% | 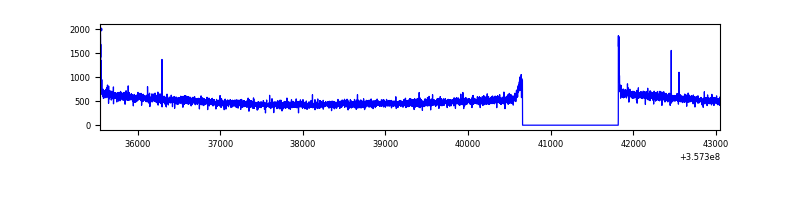 |
| B | 7507 | 6347 | 0 | 0 | 0.00% | 0.00% | 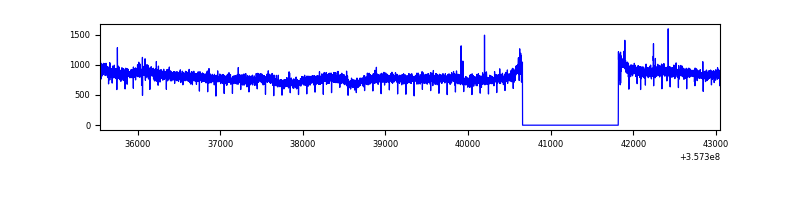 |
| C | 7507 | 6347 | 371 | 371 | 4.94% | 5.85% |  |
| D | 7507 | 6347 | 75 | 75 | 1.00% | 1.18% | 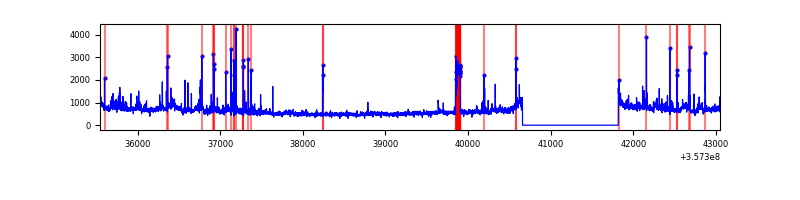 |
Top three noisy pixels from each quadrant. If the there are fewer than three noisy pixels in the level2.evt file, extra rows are filled as -1
| Pixel properties | Quadrant properties | ||||||
|---|---|---|---|---|---|---|---|
| Quadrant | DetID | PixID | Counts | Sigma | Mean | Median | Sigma |
| A | 8 | 192 | 27369 | 161.48 | 830 | 816 | 164.4 |
| A | 13 | 254 | 11899 | 67.4 | 830 | 816 | 164.4 |
| A | 3 | 137 | 8201 | 44.91 | 830 | 816 | 164.4 |
| B | 6 | 159 | 1811702 | 11473.76 | 825 | 805 | 157.8 |
| B | 12 | 111 | 18820 | 114.14 | 825 | 805 | 157.8 |
| B | 11 | 111 | 17285 | 104.42 | 825 | 805 | 157.8 |
| C | 3 | 233 | 5262256 | 29155.24 | 773 | 780 | 180.5 |
| C | 14 | 238 | 126032 | 694.05 | 773 | 780 | 180.5 |
| C | 2 | 114 | 14484 | 75.94 | 773 | 780 | 180.5 |
| D | 7 | 223 | 336427 | 1685.72 | 803 | 786 | 199.1 |
| D | 13 | 104 | 281858 | 1411.65 | 803 | 786 | 199.1 |
| D | 1 | 52 | 260153 | 1302.64 | 803 | 786 | 199.1 |
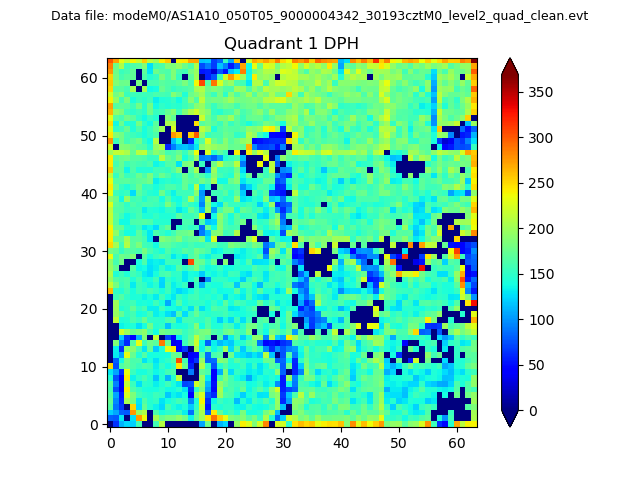
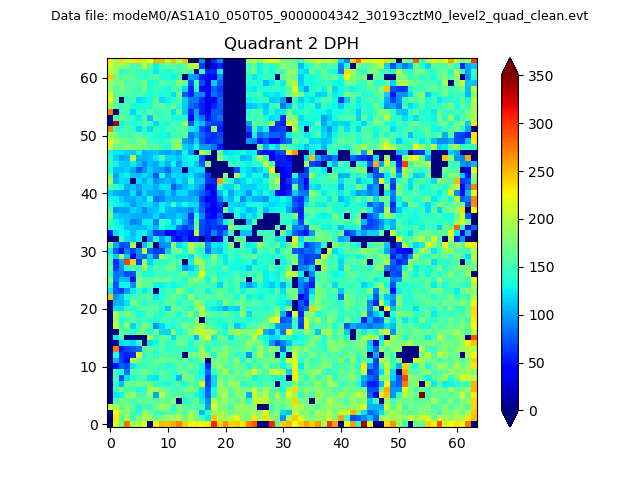
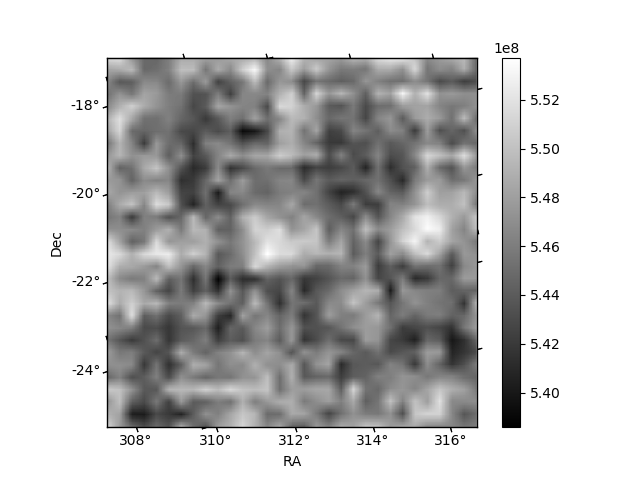
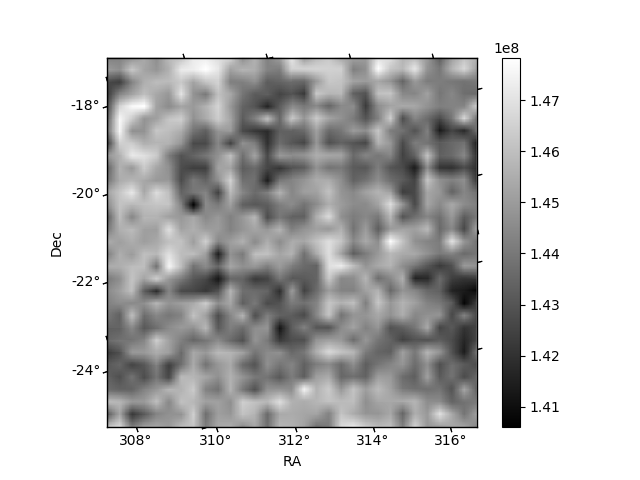
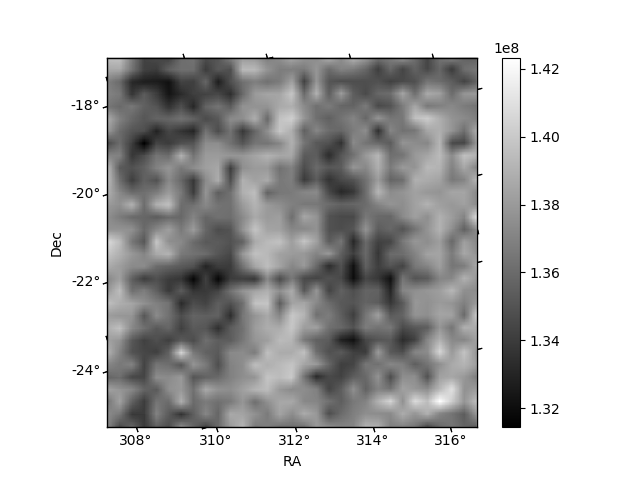
Histogram calculated using DETX and DETY for each event in the final _common_clean file
| Quadrant A | 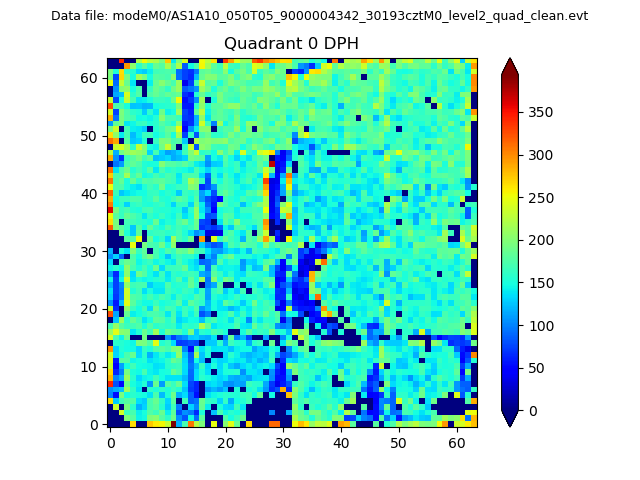 |
 |
Quadrant B |
|---|---|---|---|
| Quadrant D | 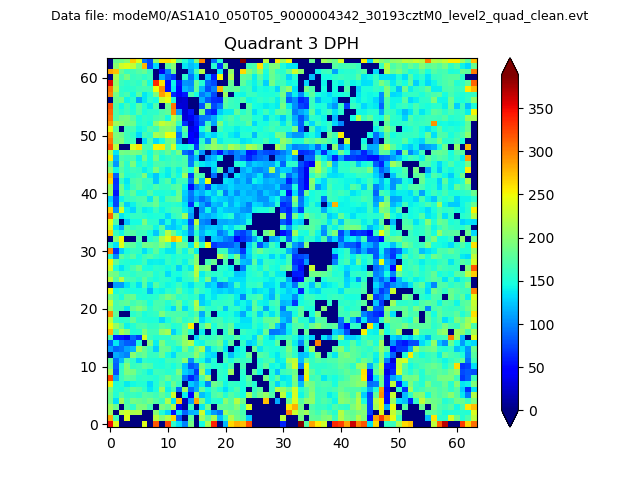 |
 |
Quadrant C |
| Plot type | Count rate plots | Images |
|---|---|---|
| Comparison with Poisson distribution Blue bars denote a histogram of data divided into 1 sec bins. Red curve is a Poisson curve with rate = median count rate of data. |
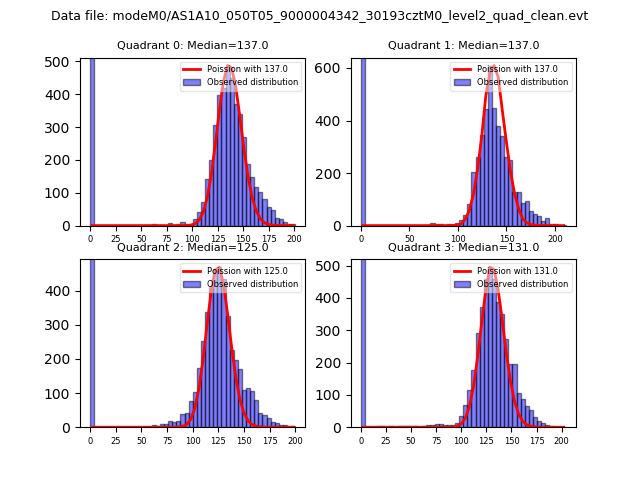 |
 |
| Quadrant-wise count rates Data is divided into 100 sec bins |
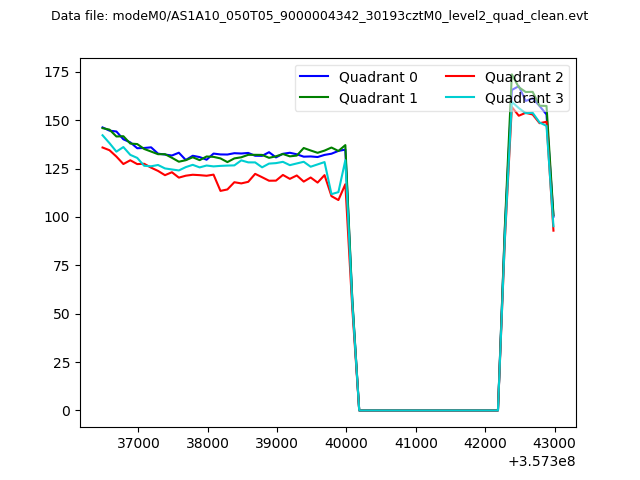 |
|
| Module-wise count rates for Quadrant A Data is divided into 100 sec bins |
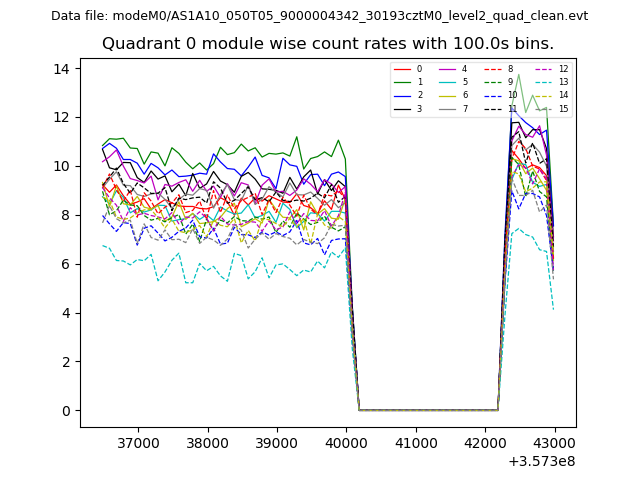 |
 |
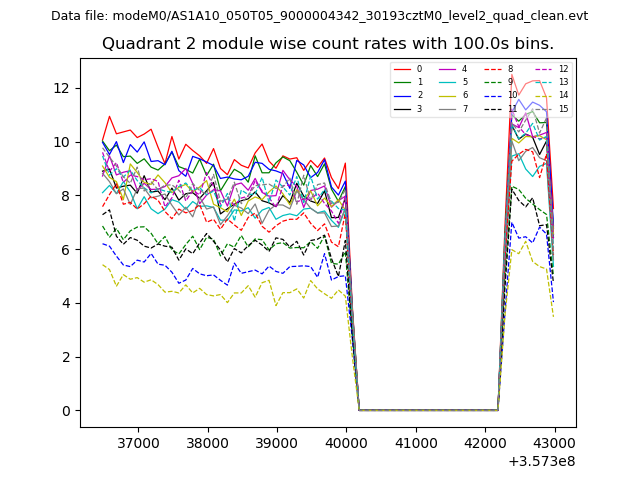
| Module-wise count rates for Quadrant B Data is divided into 100 sec bins |
 |
 |
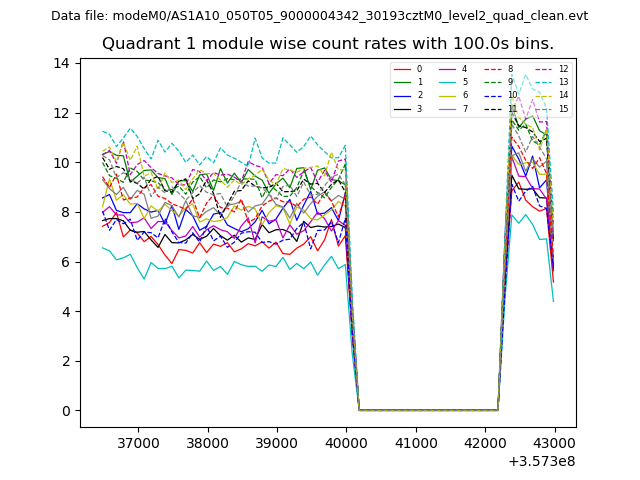
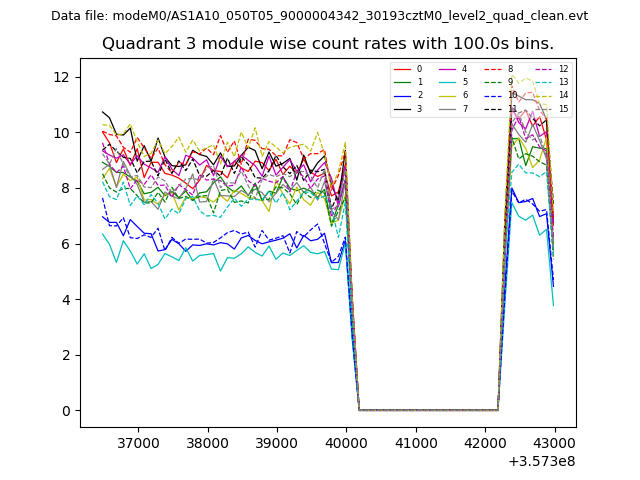
| Module-wise count rates for Quadrant C Data is divided into 100 sec bins |
 |
 |
| Module-wise count rates for Quadrant D Data is divided into 100 sec bins |
 |
 |
| Parameter | Plot |
|---|---|
| CZT HV Monitor | 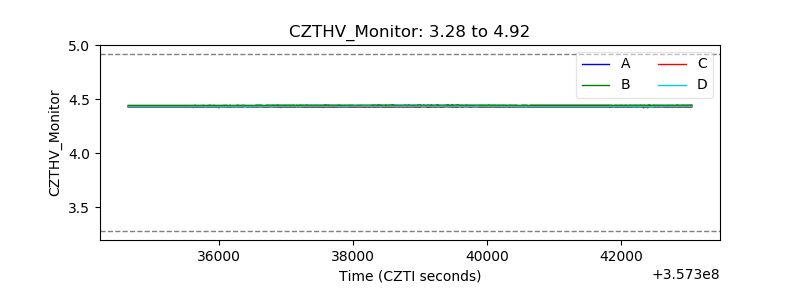 |
| D_VDD | 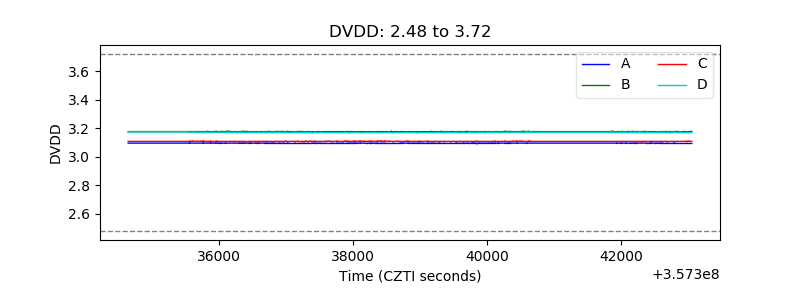 |
| Temperature 1 |  |
| Veto HV Monitor | 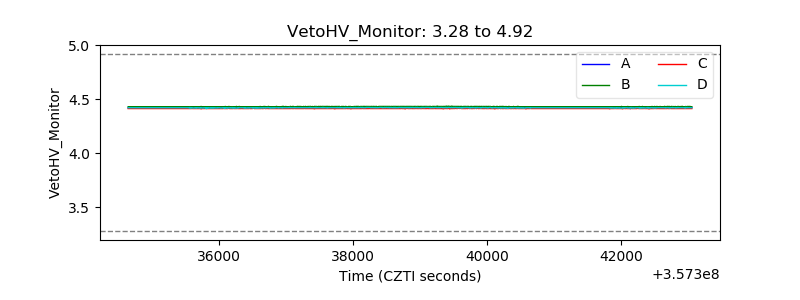 |
| Veto LLD | 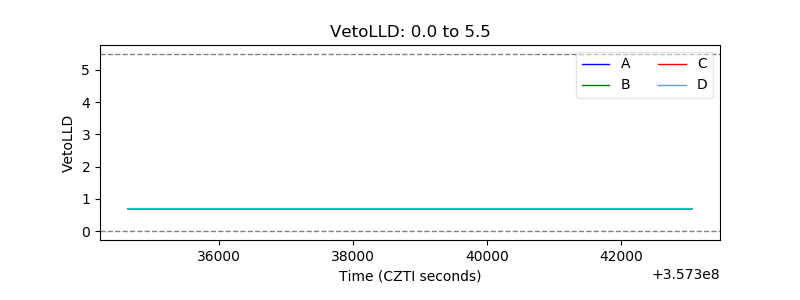 |
| Alpha Counter | 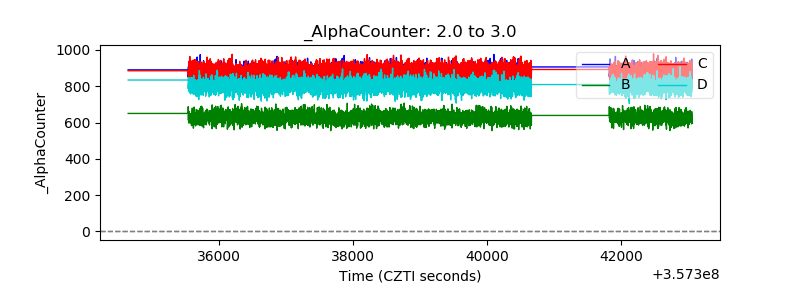 |
| _CPM_Rate | 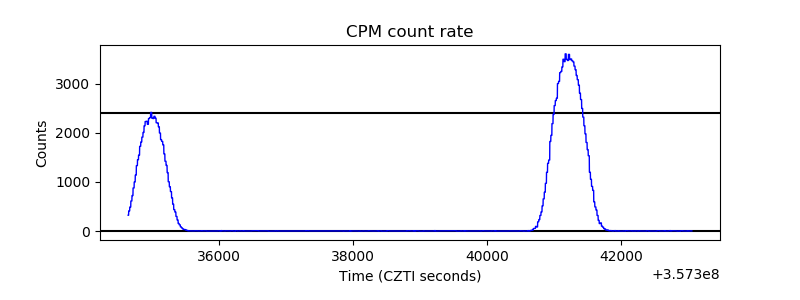 |
| CZT Counter | 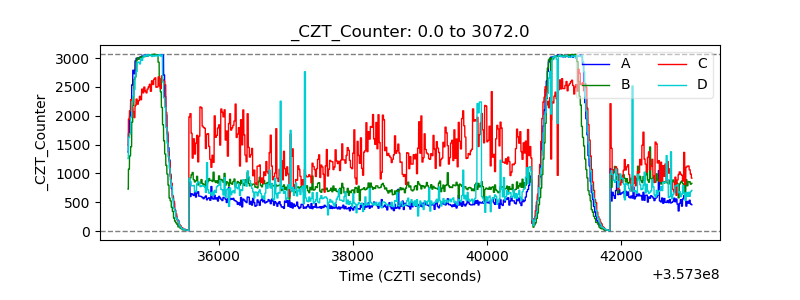 |
| +2.5 Volts monitor |  |
| +5 Volts monitor |  |
| _ROLL_ROT | 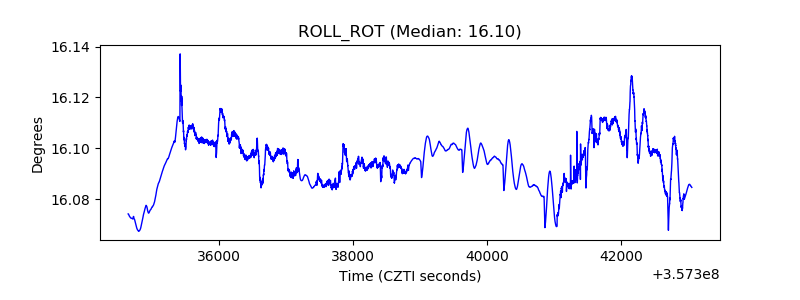 |
| _Roll_DEC | 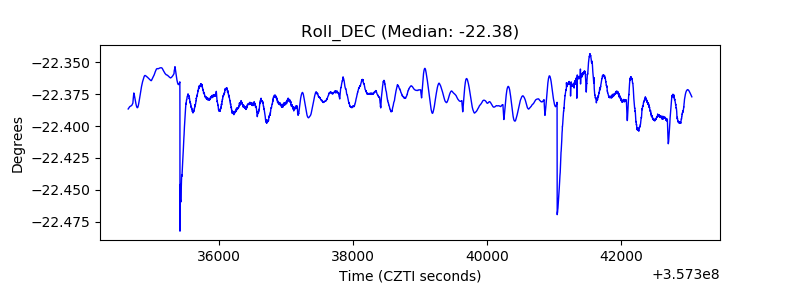 |
| _Roll_RA | 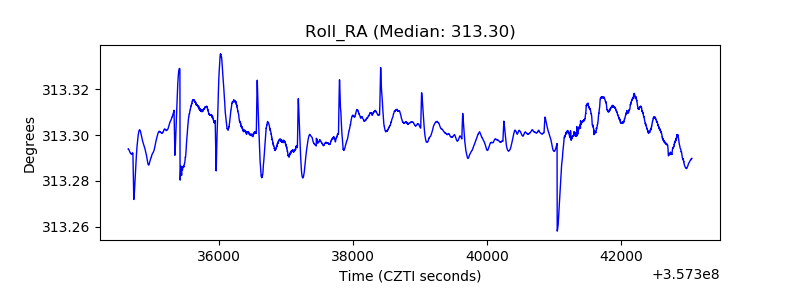 |
| Veto Counter | 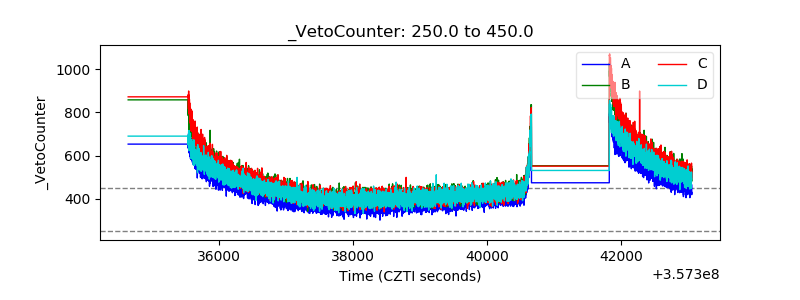 |