| Param | Original file | Final file |
|---|---|---|
| Filename | modeM0/AS1A10_071T09_9000004344cztM0_level2.fits | modeM0/AS1A10_071T09_9000004344cztM0_level2_quad_clean.evt |
| Size (bytes) | 548,928,000 | 413,121,600 |
| Size | 523.5 MB | 394.0 MB |
| Events in quadrant A | 3,454,674 | 2,362,404 |
| Events in quadrant B | 3,281,800 | 2,350,339 |
| Events in quadrant C | 3,188,980 | 2,006,398 |
| Events in quadrant D | 2,931,356 | 2,024,993 |
| Mode SS | |||
|---|---|---|---|
| Quadrant | BADHDUFLAG | Total packets | Discarded packets |
| A | 0 | 1114 | 0 |
| B | 0 | 1114 | 0 |
| C | 0 | 1114 | 0 |
| D | 0 | 1114 | 0 |
| Mode M0 | |||
|---|---|---|---|
| Quadrant | BADHDUFLAG | Total packets | Discarded packets |
| A | 0 | 116277 | 0 |
| B | 0 | 166206 | 0 |
| C | 0 | 203734 | 0 |
| D | 0 | 135351 | 0 |
| Mode M9 | |||
|---|---|---|---|
| Quadrant | BADHDUFLAG | Total packets | Discarded packets |
| A | 0 | 78 | 0 |
| B | 0 | 78 | 0 |
| C | 0 | 78 | 0 |
| D | 0 | 78 | 0 |
| Quadrant | Total seconds | Saturated seconds | Saturation percentage |
|---|---|---|---|
| A | 54874 | 1096 | 1.997303% |
| B | 54874 | 1572 | 2.864745% |
| C | 54874 | 5584 | 10.176040% |
| D | 54874 | 1402 | 2.554944% |
Noise dominated data is calculated using 1-second bins in cleaned event files. If a bin has >2000 counts, and if more than 50% of those come from <1% of pixels, then it is considered to be noise-dominated and hence unusable.
| Quadrant | # 1 sec bins | Bins with >0 counts | Bins with >2000 counts | High rate bins dominated by noise | Noise dominated (total time) | Noise dominated (detector-on time) | Marked lightcurve |
|---|---|---|---|---|---|---|---|
| A | 62669 | 54873 | 0 | 0 | 0.00% | 0.00% |  |
| B | 62669 | 54869 | 0 | 0 | 0.00% | 0.00% |  |
| C | 62669 | 54867 | 0 | 0 | 0.00% | 0.00% |  |
| D | 62669 | 54871 | 0 | 0 | 0.00% | 0.00% |  |
Top three noisy pixels from each quadrant. If the there are fewer than three noisy pixels in the level2.evt file, extra rows are filled as -1
| Pixel properties | Quadrant properties | ||||||
|---|---|---|---|---|---|---|---|
| Quadrant | DetID | PixID | Counts | Sigma | Mean | Median | Sigma |
| A | 0 | 29 | 2966 | 9.6 | 900 | 845 | 220.9 |
| A | 7 | 110 | 2711 | 8.45 | 900 | 845 | 220.9 |
| A | 15 | 236 | 2534 | 7.64 | 900 | 845 | 220.9 |
| B | 2 | 9 | 2591 | 10.3 | 865 | 826 | 171.4 |
| B | 3 | 80 | 2182 | 7.91 | 865 | 826 | 171.4 |
| B | 5 | 232 | 2173 | 7.86 | 865 | 826 | 171.4 |
| C | 3 | 187 | 2155 | 6.4 | 844 | 791 | 213.0 |
| C | 7 | 111 | 2145 | 6.36 | 844 | 791 | 213.0 |
| C | 3 | 126 | 2137 | 6.32 | 844 | 791 | 213.0 |
| D | 15 | 46 | 2159 | 6.26 | 836 | 760 | 223.4 |
| D | 3 | 14 | 2132 | 6.14 | 836 | 760 | 223.4 |
| D | 10 | 189 | 2014 | 5.61 | 836 | 760 | 223.4 |
Histogram calculated using DETX and DETY for each event in the final _common_clean file
| Quadrant A | 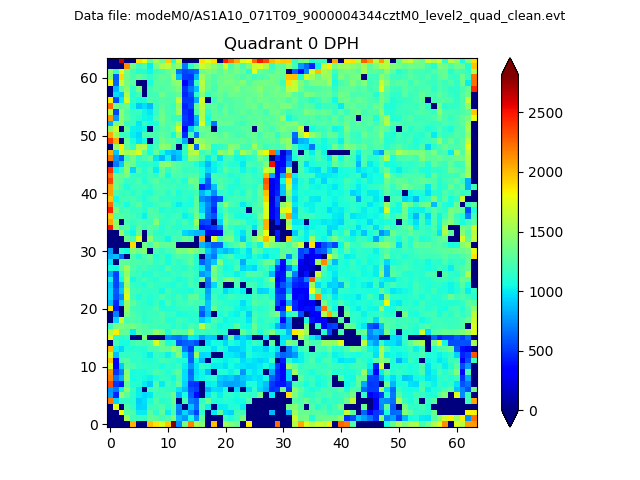 |
 |
Quadrant B |
|---|---|---|---|
| Quadrant D |  |
 |
Quadrant C |
| Plot type | Count rate plots | Images |
|---|---|---|
| Comparison with Poisson distribution Blue bars denote a histogram of data divided into 1 sec bins. Red curve is a Poisson curve with rate = median count rate of data. |
 |
 |
| Quadrant-wise count rates Data is divided into 100 sec bins |
 |
|
| Module-wise count rates for Quadrant A Data is divided into 100 sec bins |
 |
 |
| Module-wise count rates for Quadrant B Data is divided into 100 sec bins |
 |
 |
| Module-wise count rates for Quadrant C Data is divided into 100 sec bins |
 |
 |
| Module-wise count rates for Quadrant D Data is divided into 100 sec bins |
 |
 |
| Parameter | Plot |
|---|---|
| CZT HV Monitor |  |
| D_VDD |  |
| Temperature 1 |  |
| Veto HV Monitor |  |
| Veto LLD |  |
| Alpha Counter |  |
| _CPM_Rate |  |
| CZT Counter |  |
| +2.5 Volts monitor |  |
| +5 Volts monitor |  |
| _ROLL_ROT |  |
| _Roll_DEC |  |
| _Roll_RA |  |
| Veto Counter |  |