| Param | Original file | Final file |
|---|---|---|
| Filename | modeM0/AS1A10_071T09_9000004344_30193cztM0_level2.evt | modeM0/AS1A10_071T09_9000004344_30193cztM0_level2_quad_clean.evt |
| Size (bytes) | 348,626,880 | 48,847,680 |
| Size | 332.5 MB | 46.6 MB |
| Events in quadrant A | 2,008,059 | 314,373 |
| Events in quadrant B | 2,924,772 | 324,327 |
| Events in quadrant C | 3,047,714 | 297,331 |
| Events in quadrant D | 2,338,439 | 293,484 |
| Mode SS | |||
|---|---|---|---|
| Quadrant | BADHDUFLAG | Total packets | Discarded packets |
| A | 0 | 72 | 0 |
| B | 0 | 72 | 0 |
| C | 0 | 72 | 0 |
| D | 0 | 72 | 0 |
| Mode M0 | |||
|---|---|---|---|
| Quadrant | BADHDUFLAG | Total packets | Discarded packets |
| A | 0 | 8038 | 1 |
| B | 0 | 10773 | 1 |
| C | 0 | 11622 | 1 |
| D | 0 | 9293 | 1 |
| Mode M9 | |||
|---|---|---|---|
| Quadrant | BADHDUFLAG | Total packets | Discarded packets |
| A | 0 | 13 | 0 |
| B | 0 | 13 | 0 |
| C | 0 | 13 | 0 |
| D | 0 | 13 | 0 |
| Quadrant | Total seconds | Saturated seconds | Saturation percentage |
|---|---|---|---|
| A | 3522 | 71 | 2.015900% |
| B | 3521 | 81 | 2.300483% |
| C | 3521 | 141 | 4.004544% |
| D | 3521 | 63 | 1.789264% |
Noise dominated data is calculated using 1-second bins in cleaned event files. If a bin has >2000 counts, and if more than 50% of those come from <1% of pixels, then it is considered to be noise-dominated and hence unusable.
| Quadrant | # 1 sec bins | Bins with >0 counts | Bins with >2000 counts | High rate bins dominated by noise | Noise dominated (total time) | Noise dominated (detector-on time) | Marked lightcurve |
|---|---|---|---|---|---|---|---|
| A | 4772 | 3523 | 11 | 11 | 0.23% | 0.31% | 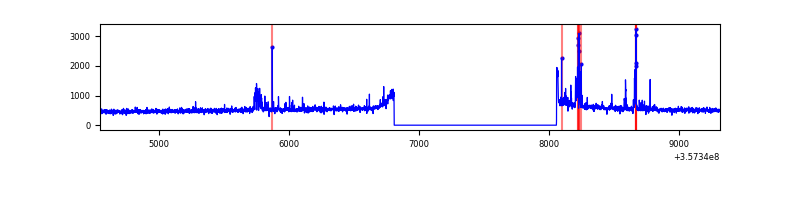 |
| B | 4771 | 3522 | 0 | 0 | 0.00% | 0.00% | 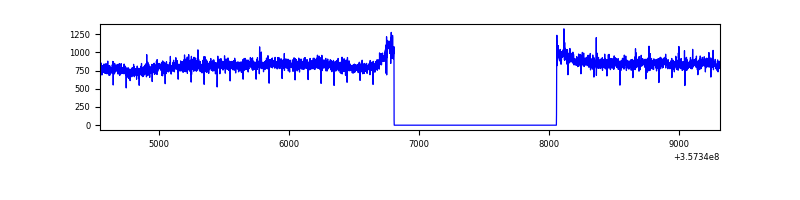 |
| C | 4771 | 3521 | 9 | 9 | 0.19% | 0.26% | 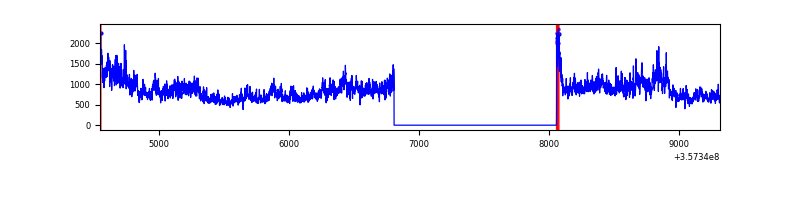 |
| D | 4771 | 3522 | 24 | 24 | 0.50% | 0.68% | 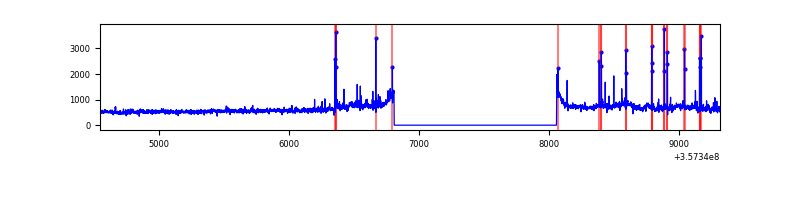 |
Top three noisy pixels from each quadrant. If the there are fewer than three noisy pixels in the level2.evt file, extra rows are filled as -1
| Pixel properties | Quadrant properties | ||||||
|---|---|---|---|---|---|---|---|
| Quadrant | DetID | PixID | Counts | Sigma | Mean | Median | Sigma |
| A | 0 | 13 | 129325 | 1311.26 | 483 | 474 | 98.3 |
| A | 8 | 192 | 15201 | 149.87 | 483 | 474 | 98.3 |
| A | 13 | 254 | 6203 | 58.3 | 483 | 474 | 98.3 |
| B | 6 | 159 | 1036519 | 11066.83 | 481 | 469 | 93.6 |
| B | 12 | 111 | 11113 | 113.69 | 481 | 469 | 93.6 |
| B | 11 | 111 | 10189 | 103.82 | 481 | 469 | 93.6 |
| C | 3 | 233 | 1167113 | 10876.82 | 459 | 463 | 107.3 |
| C | 14 | 238 | 76420 | 708.16 | 459 | 463 | 107.3 |
| C | 2 | 114 | 8159 | 71.75 | 459 | 463 | 107.3 |
| D | 7 | 223 | 206502 | 1882.61 | 461 | 451 | 109.4 |
| D | 8 | 195 | 125645 | 1143.85 | 461 | 451 | 109.4 |
| D | 13 | 104 | 106854 | 972.16 | 461 | 451 | 109.4 |
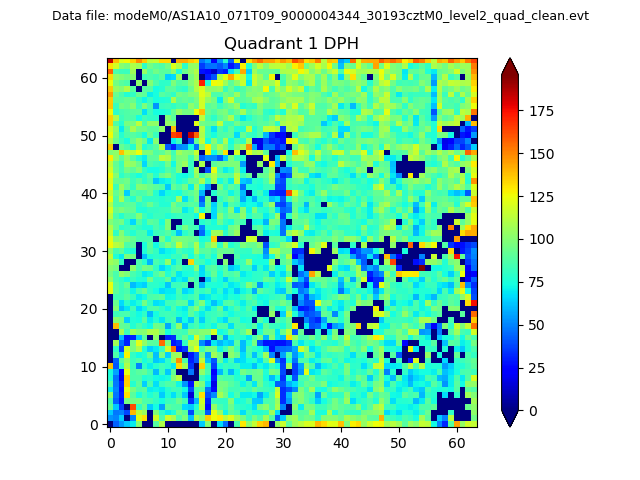
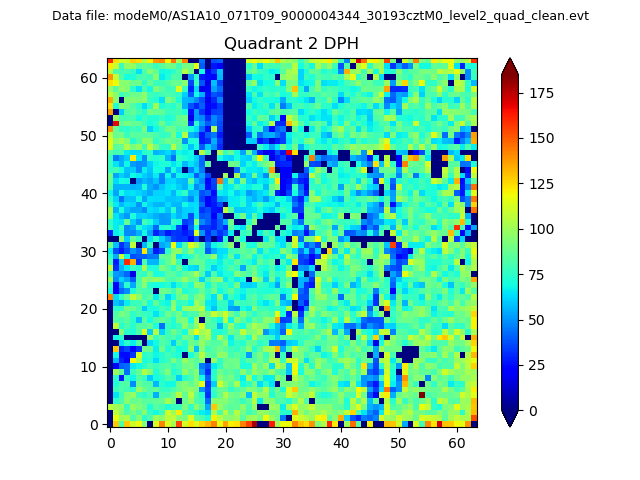
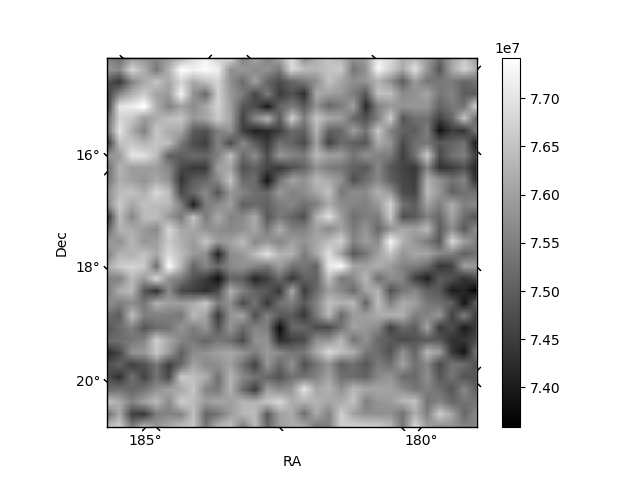
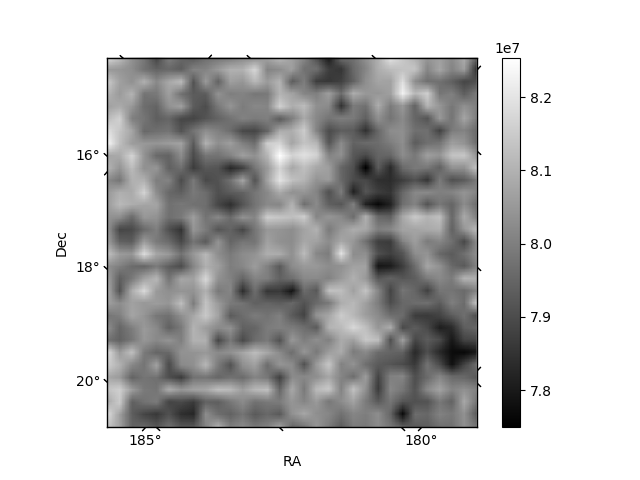
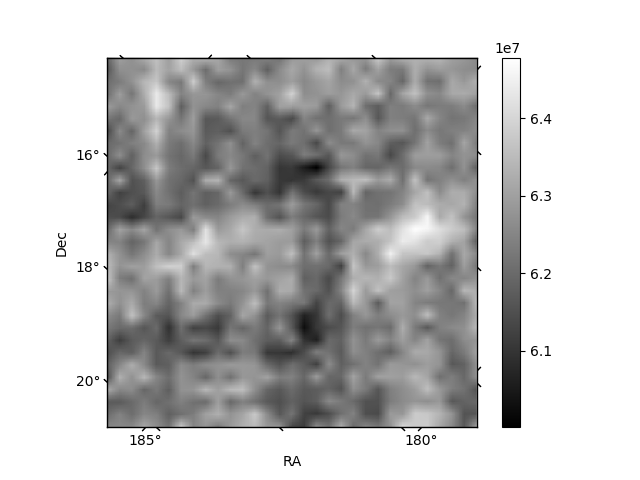
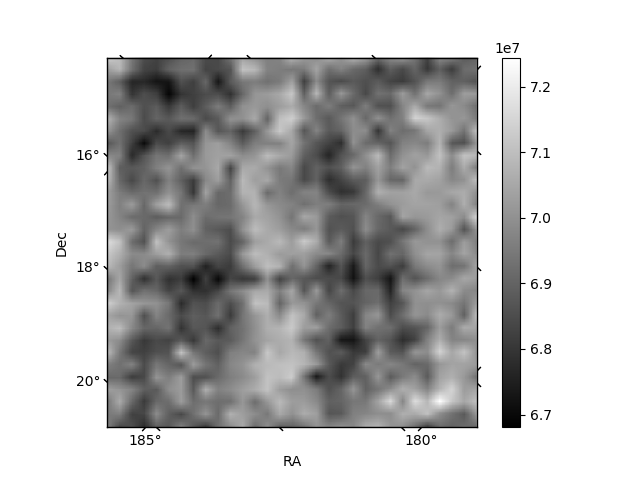
Histogram calculated using DETX and DETY for each event in the final _common_clean file
| Quadrant A |  |
 |
Quadrant B |
|---|---|---|---|
| Quadrant D |  |
 |
Quadrant C |
| Plot type | Count rate plots | Images |
|---|---|---|
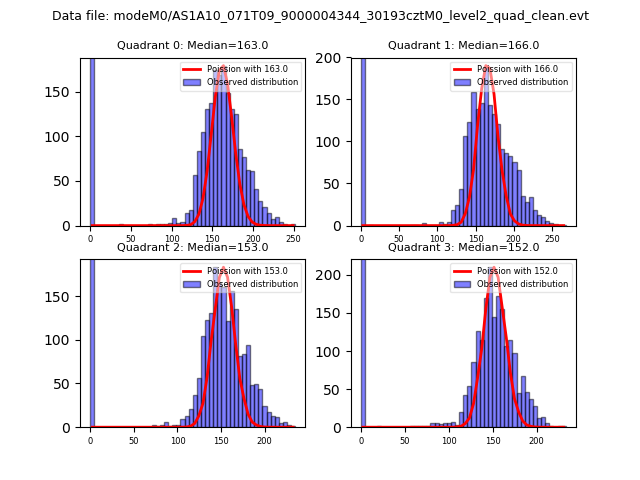
| Comparison with Poisson distribution Blue bars denote a histogram of data divided into 1 sec bins. Red curve is a Poisson curve with rate = median count rate of data. |
 |
 |
| Quadrant-wise count rates Data is divided into 100 sec bins |
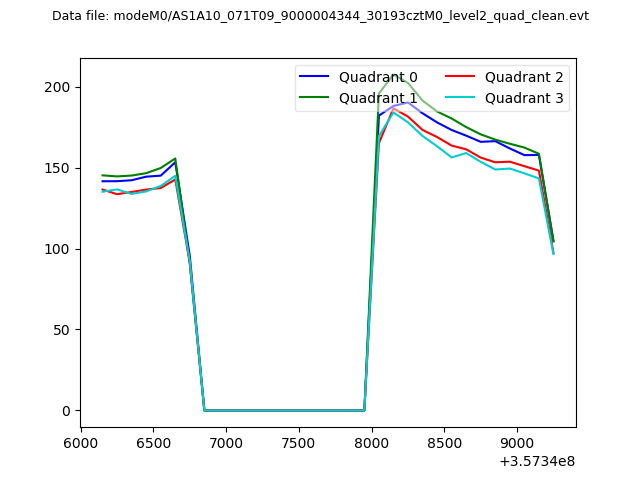 |
|
| Module-wise count rates for Quadrant A Data is divided into 100 sec bins |
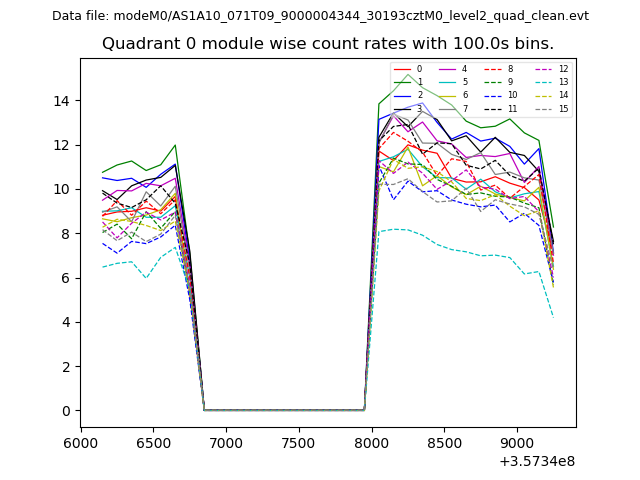 |
 |
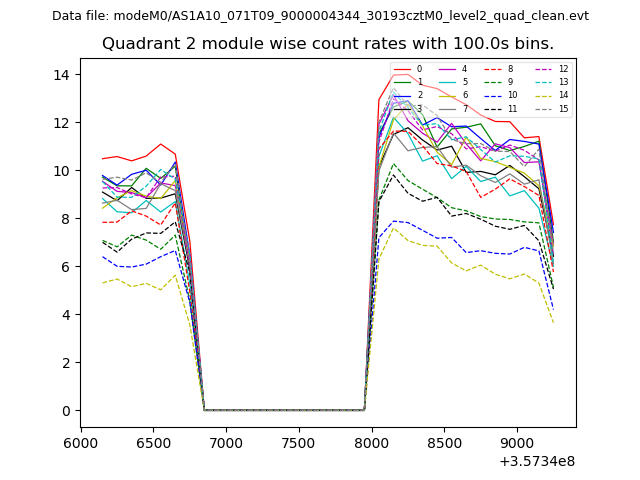
| Module-wise count rates for Quadrant B Data is divided into 100 sec bins |
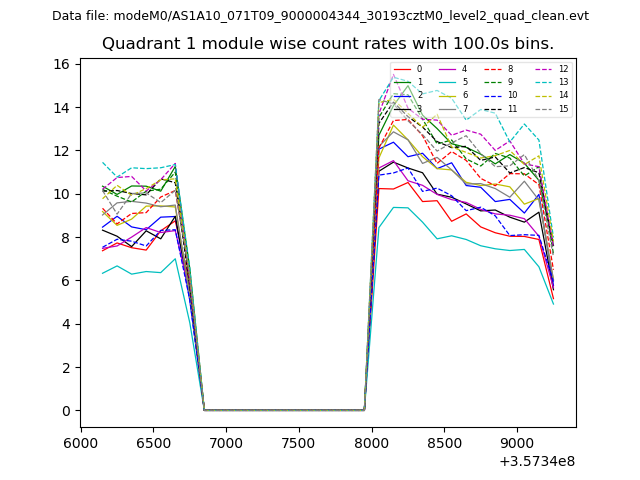 |
 |
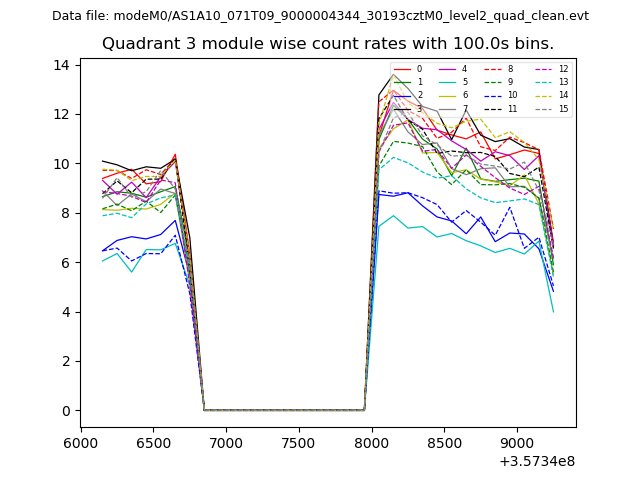
| Module-wise count rates for Quadrant C Data is divided into 100 sec bins |
 |
 |
| Module-wise count rates for Quadrant D Data is divided into 100 sec bins |
 |
 |
| Parameter | Plot |
|---|---|
| CZT HV Monitor | 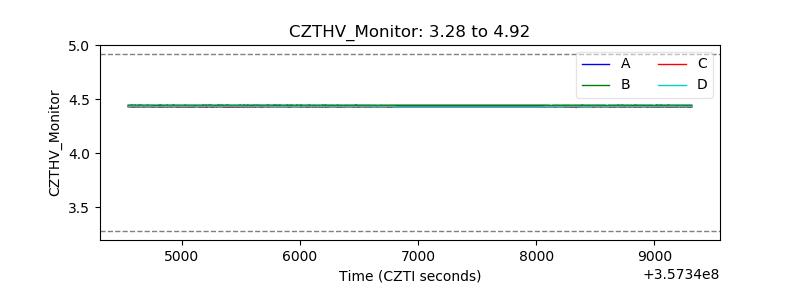 |
| D_VDD | 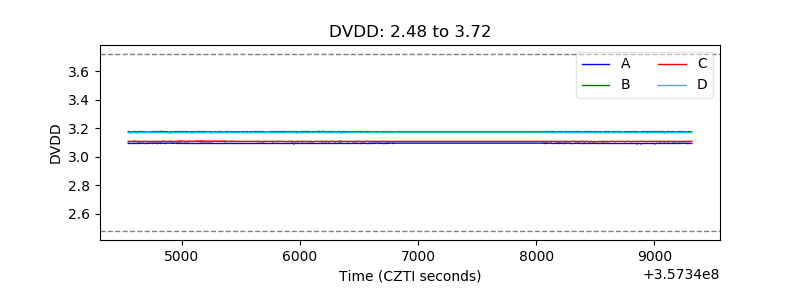 |
| Temperature 1 | 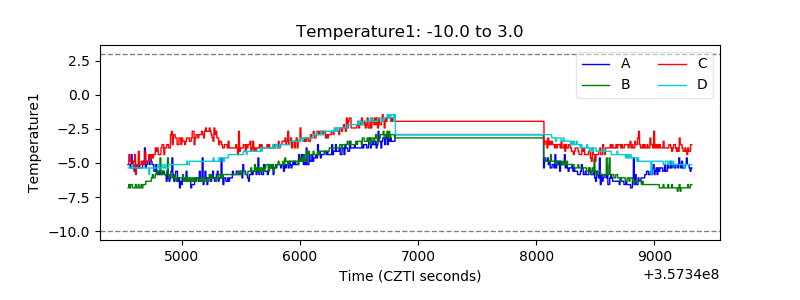 |
| Veto HV Monitor | 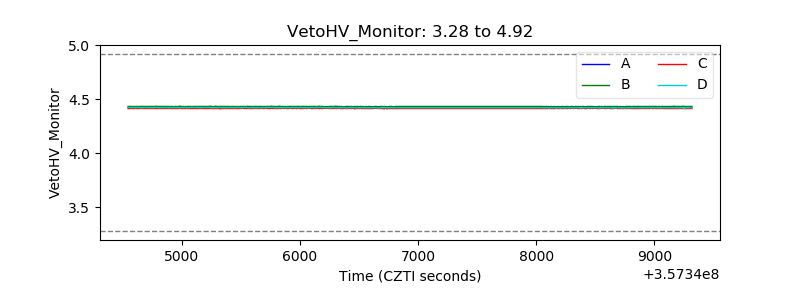 |
| Veto LLD | 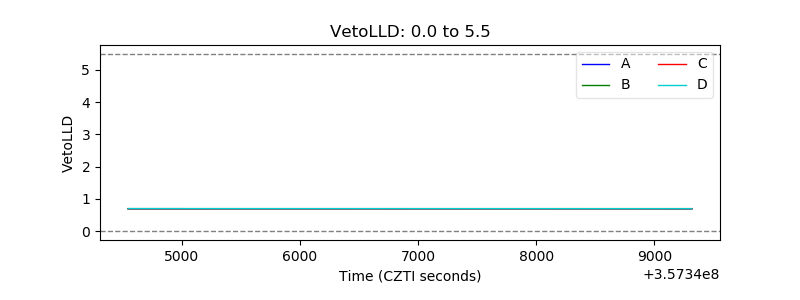 |
| Alpha Counter | 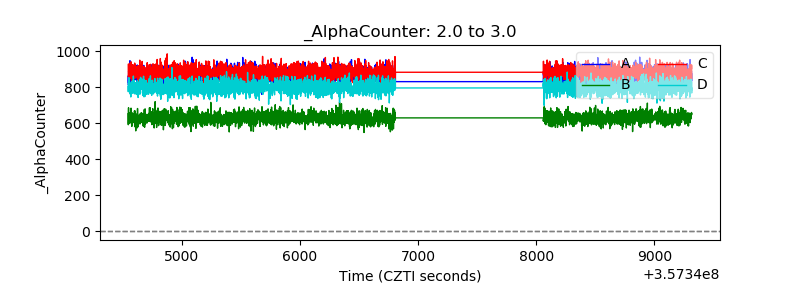 |
| _CPM_Rate | 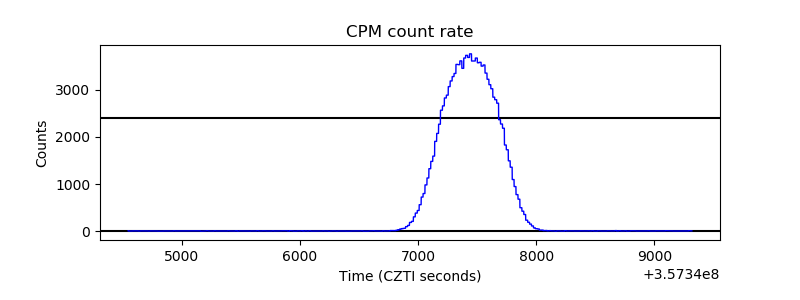 |
| CZT Counter | 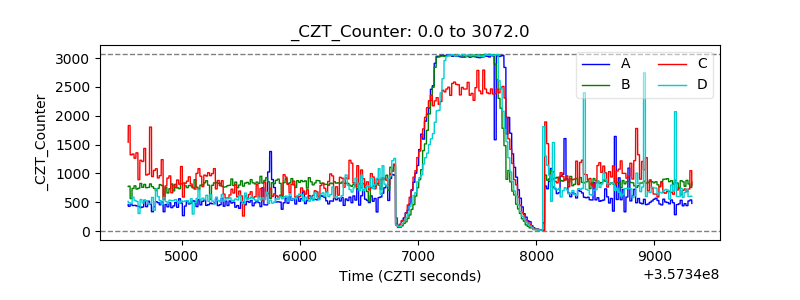 |
| +2.5 Volts monitor |  |
| +5 Volts monitor |  |
| _ROLL_ROT | 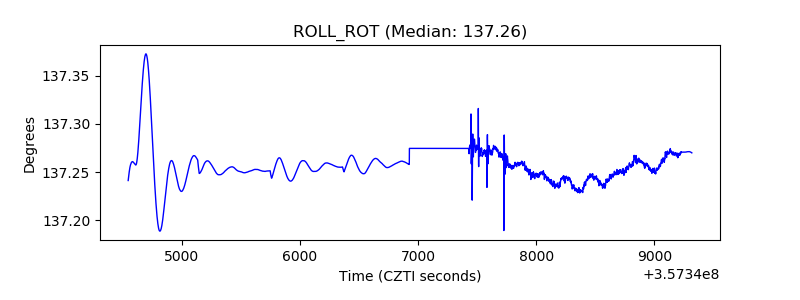 |
| _Roll_DEC | 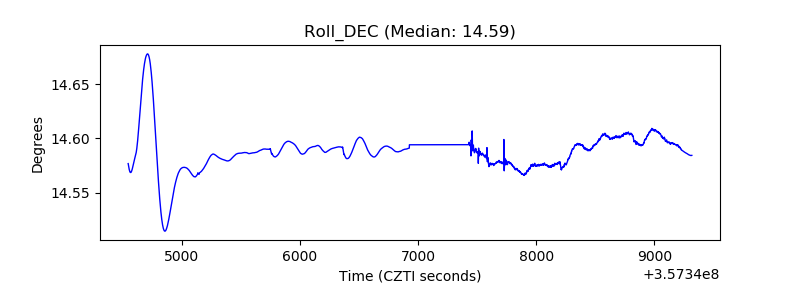 |
| _Roll_RA | 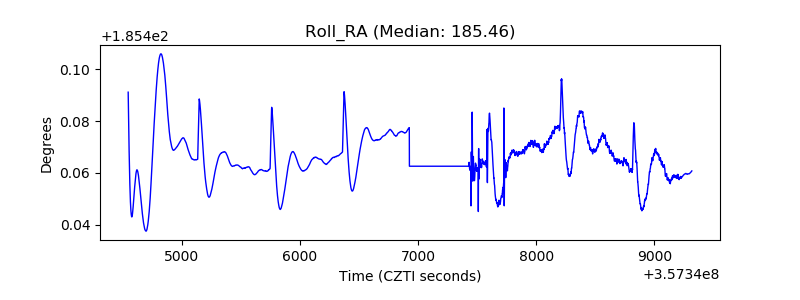 |
| Veto Counter | 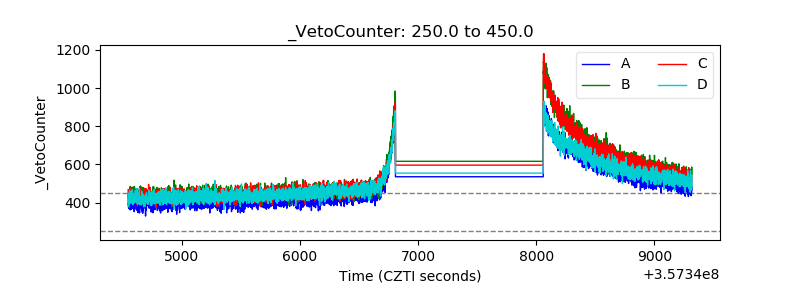 |