| Param | Original file | Final file |
|---|---|---|
| Filename | modeM0/AS1A10_071T09_9000004344_30195cztM0_level2.evt | modeM0/AS1A10_071T09_9000004344_30195cztM0_level2_quad_clean.evt |
| Size (bytes) | 621,861,120 | 89,487,360 |
| Size | 593.1 MB | 85.3 MB |
| Events in quadrant A | 3,328,877 | 587,901 |
| Events in quadrant B | 5,061,083 | 604,214 |
| Events in quadrant C | 5,987,444 | 542,101 |
| Events in quadrant D | 4,035,657 | 541,235 |
| Mode SS | |||
|---|---|---|---|
| Quadrant | BADHDUFLAG | Total packets | Discarded packets |
| A | 0 | 128 | 0 |
| B | 0 | 128 | 0 |
| C | 0 | 128 | 0 |
| D | 0 | 128 | 0 |
| Mode M0 | |||
|---|---|---|---|
| Quadrant | BADHDUFLAG | Total packets | Discarded packets |
| A | 0 | 13477 | 2 |
| B | 0 | 19029 | 2 |
| C | 0 | 22245 | 2 |
| D | 0 | 15886 | 2 |
| Mode M9 | |||
|---|---|---|---|
| Quadrant | BADHDUFLAG | Total packets | Discarded packets |
| A | 0 | 15 | 0 |
| B | 0 | 16 | 0 |
| C | 0 | 16 | 0 |
| D | 0 | 16 | 0 |
| Quadrant | Total seconds | Saturated seconds | Saturation percentage |
|---|---|---|---|
| A | 6219 | 44 | 0.707509% |
| B | 6218 | 89 | 1.431328% |
| C | 6218 | 306 | 4.921197% |
| D | 6218 | 135 | 2.171116% |
Noise dominated data is calculated using 1-second bins in cleaned event files. If a bin has >2000 counts, and if more than 50% of those come from <1% of pixels, then it is considered to be noise-dominated and hence unusable.
| Quadrant | # 1 sec bins | Bins with >0 counts | Bins with >2000 counts | High rate bins dominated by noise | Noise dominated (total time) | Noise dominated (detector-on time) | Marked lightcurve |
|---|---|---|---|---|---|---|---|
| A | 7569 | 6220 | 0 | 0 | 0.00% | 0.00% | 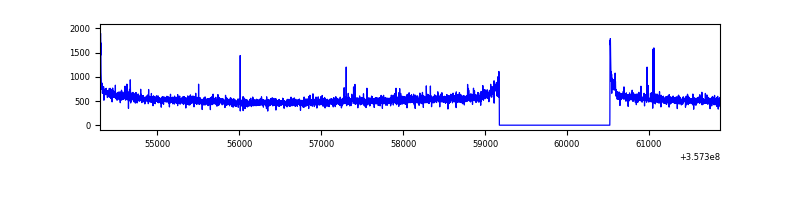 |
| B | 7568 | 6219 | 0 | 0 | 0.00% | 0.00% | 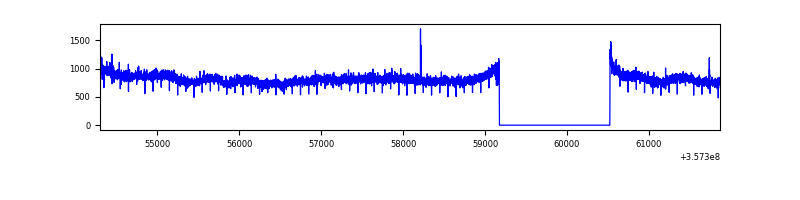 |
| C | 7568 | 6219 | 25 | 25 | 0.33% | 0.40% | 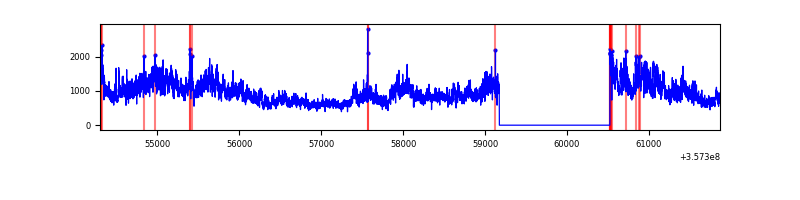 |
| D | 7568 | 6219 | 103 | 103 | 1.36% | 1.66% | 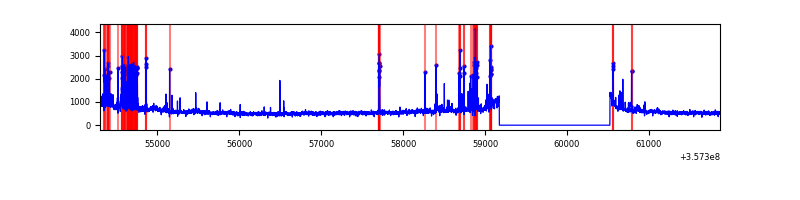 |
Top three noisy pixels from each quadrant. If the there are fewer than three noisy pixels in the level2.evt file, extra rows are filled as -1
| Pixel properties | Quadrant properties | ||||||
|---|---|---|---|---|---|---|---|
| Quadrant | DetID | PixID | Counts | Sigma | Mean | Median | Sigma |
| A | 8 | 192 | 23908 | 137.48 | 849 | 838 | 167.8 |
| A | 0 | 13 | 17292 | 98.06 | 849 | 838 | 167.8 |
| A | 13 | 254 | 11431 | 63.13 | 849 | 838 | 167.8 |
| B | 6 | 159 | 1736566 | 10976.01 | 849 | 830 | 158.1 |
| B | 12 | 111 | 18966 | 114.68 | 849 | 830 | 158.1 |
| B | 11 | 111 | 17364 | 104.55 | 849 | 830 | 158.1 |
| C | 3 | 233 | 2688480 | 14581.02 | 800 | 810 | 184.3 |
| C | 14 | 238 | 135691 | 731.75 | 800 | 810 | 184.3 |
| C | 15 | 208 | 21810 | 113.93 | 800 | 810 | 184.3 |
| D | 13 | 104 | 343297 | 1778.69 | 799 | 781 | 192.6 |
| D | 7 | 223 | 286515 | 1483.82 | 799 | 781 | 192.6 |
| D | 8 | 195 | 200484 | 1037.06 | 799 | 781 | 192.6 |
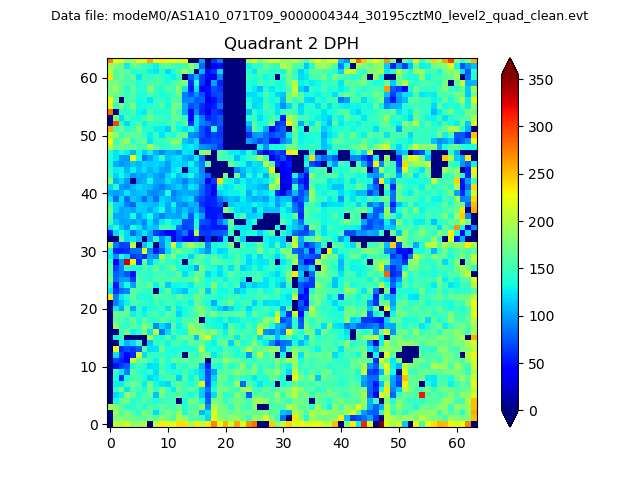
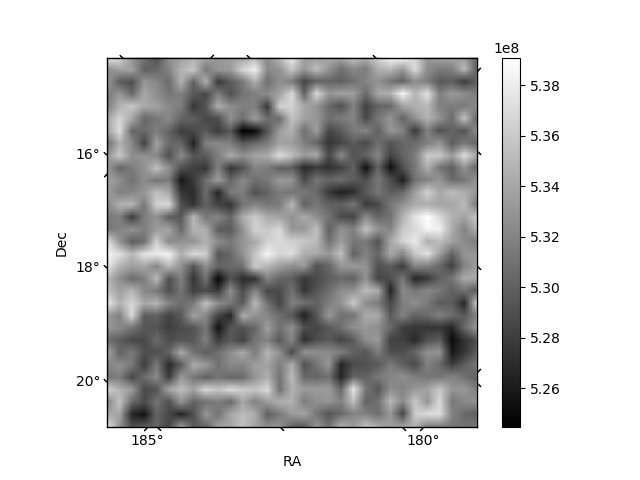
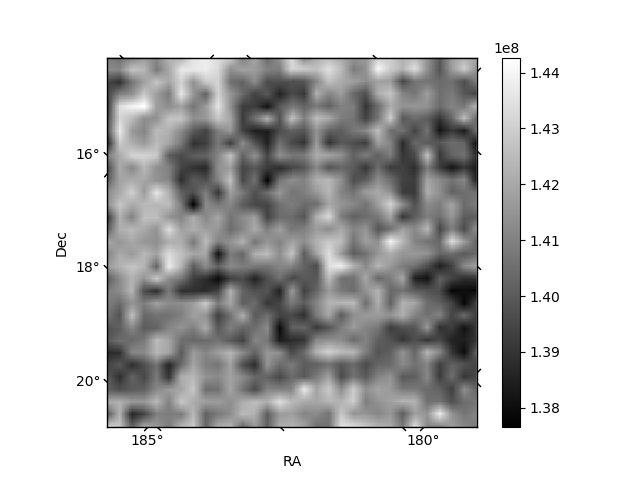
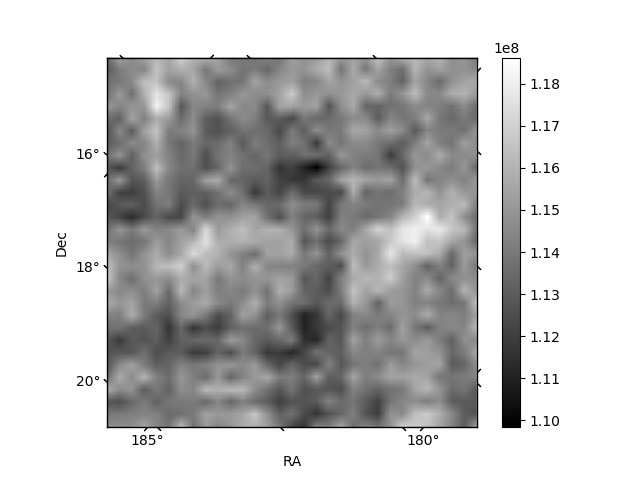
Histogram calculated using DETX and DETY for each event in the final _common_clean file
| Quadrant A | 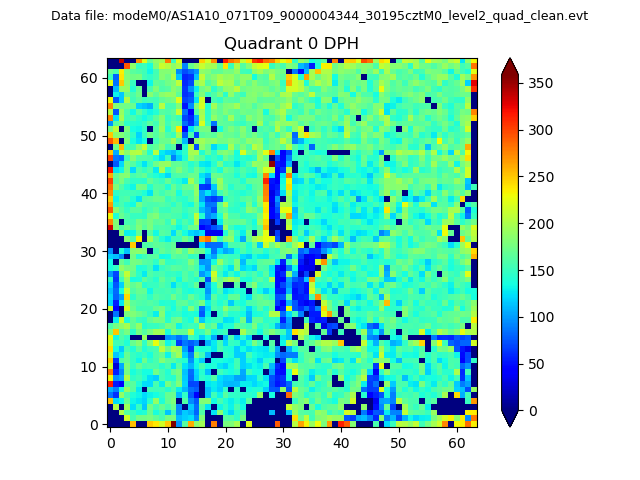 |
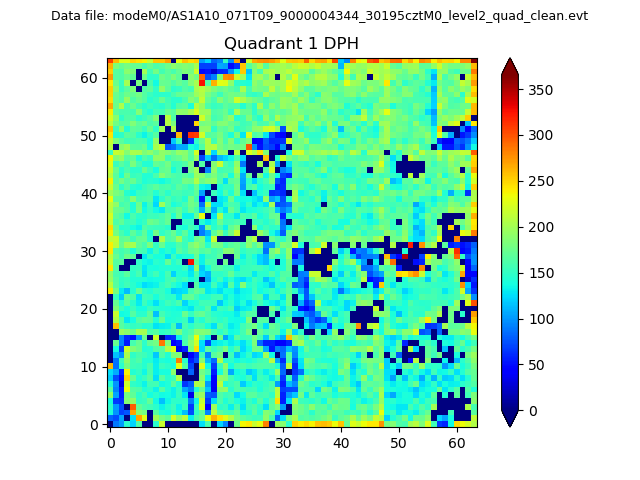 |
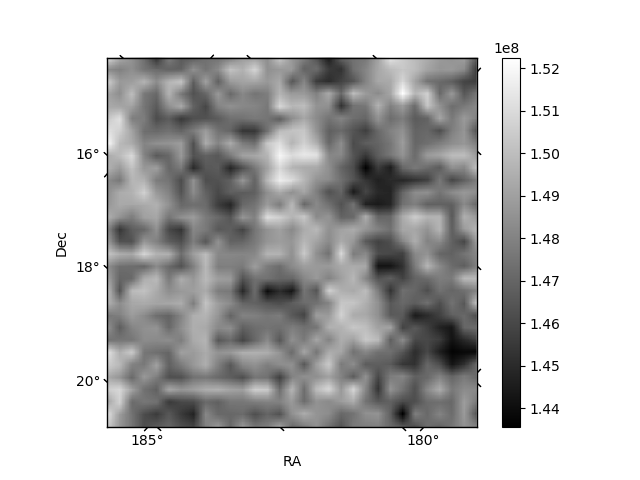
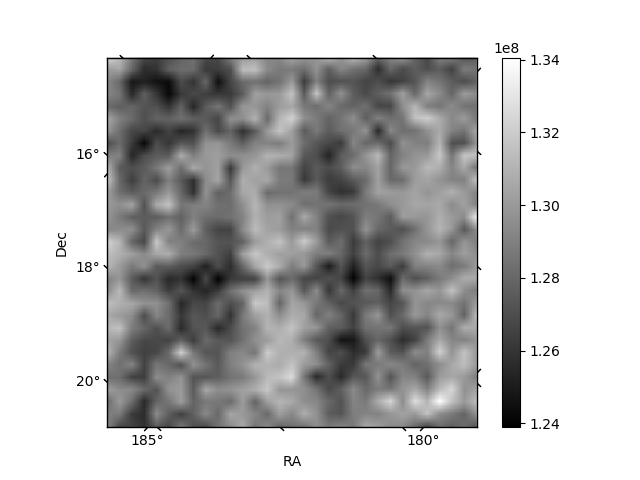
Quadrant B |
|---|---|---|---|
| Quadrant D | 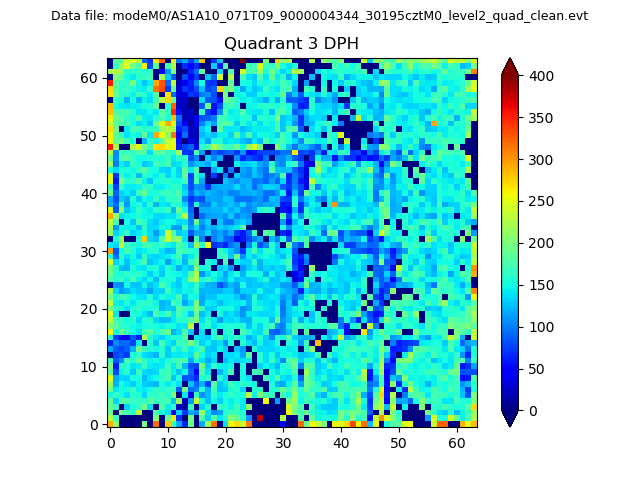 |
 |
Quadrant C |
| Plot type | Count rate plots | Images |
|---|---|---|
| Comparison with Poisson distribution Blue bars denote a histogram of data divided into 1 sec bins. Red curve is a Poisson curve with rate = median count rate of data. |
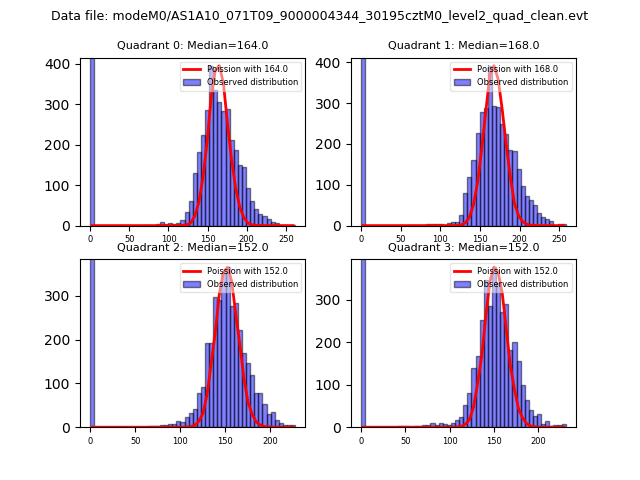 |
 |
| Quadrant-wise count rates Data is divided into 100 sec bins |
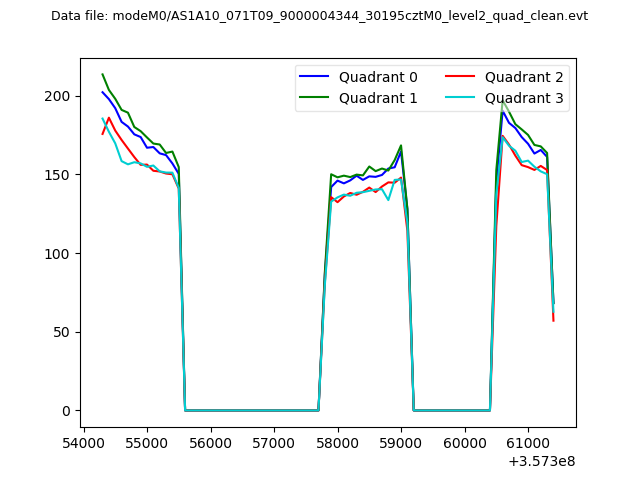 |
|
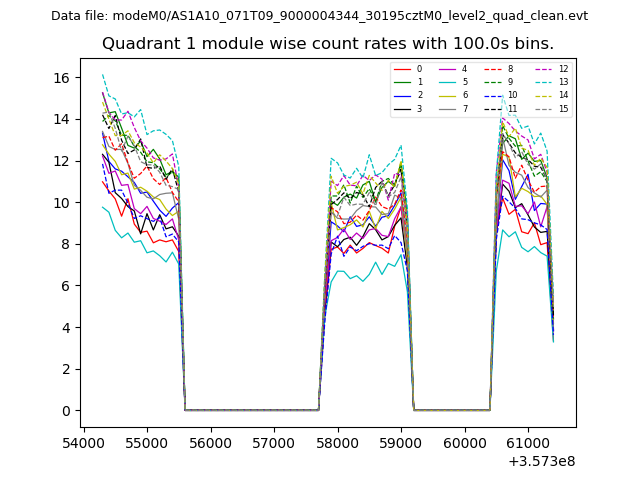
| Module-wise count rates for Quadrant A Data is divided into 100 sec bins |
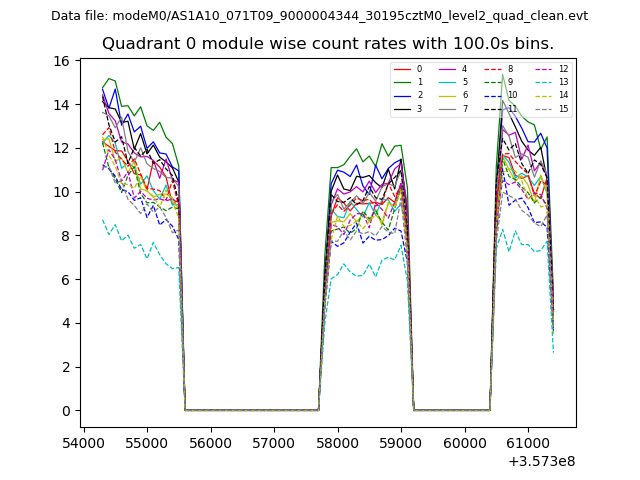 |
 |
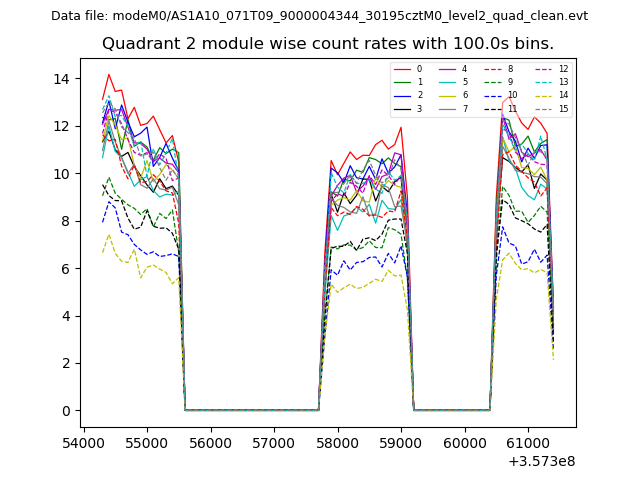
| Module-wise count rates for Quadrant B Data is divided into 100 sec bins |
 |
 |
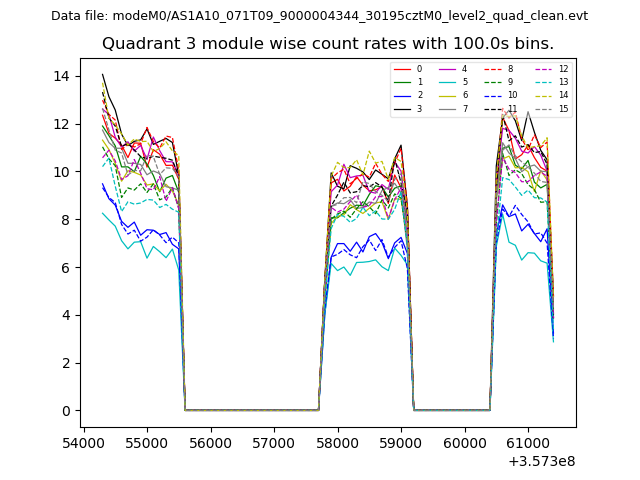
| Module-wise count rates for Quadrant C Data is divided into 100 sec bins |
 |
 |
| Module-wise count rates for Quadrant D Data is divided into 100 sec bins |
 |
 |
| Parameter | Plot |
|---|---|
| CZT HV Monitor | 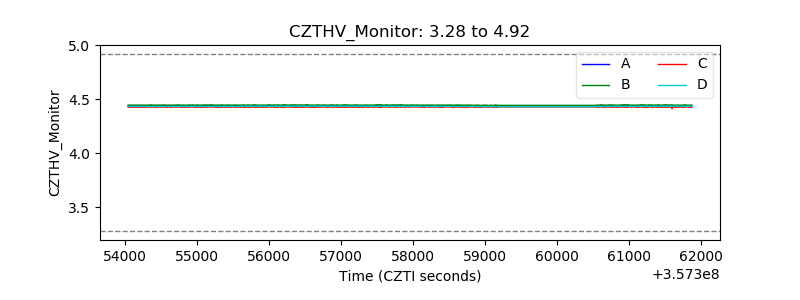 |
| D_VDD | 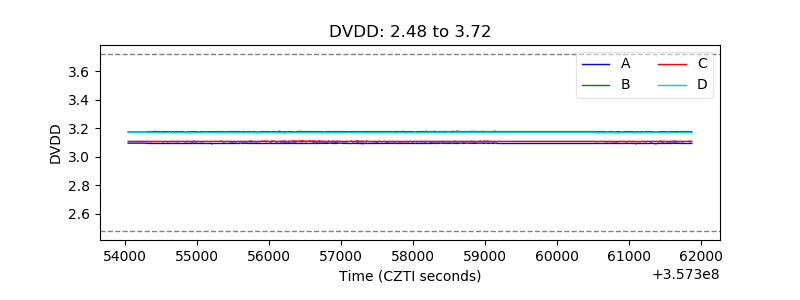 |
| Temperature 1 | 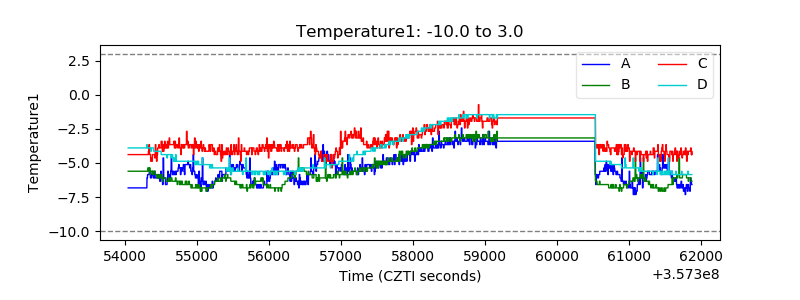 |
| Veto HV Monitor | 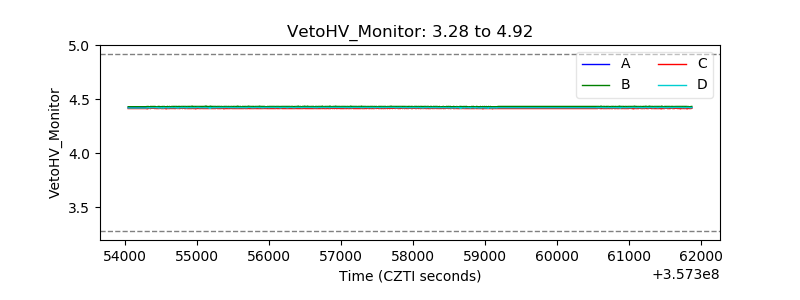 |
| Veto LLD | 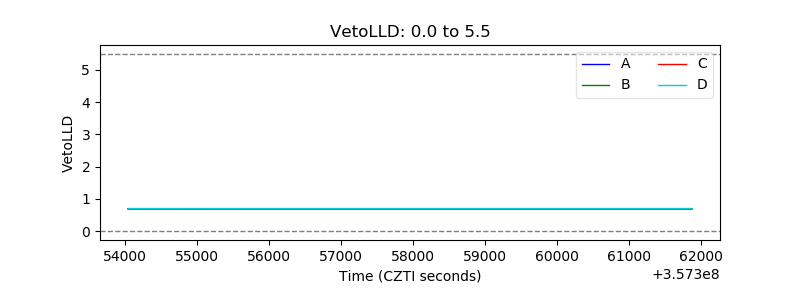 |
| Alpha Counter | 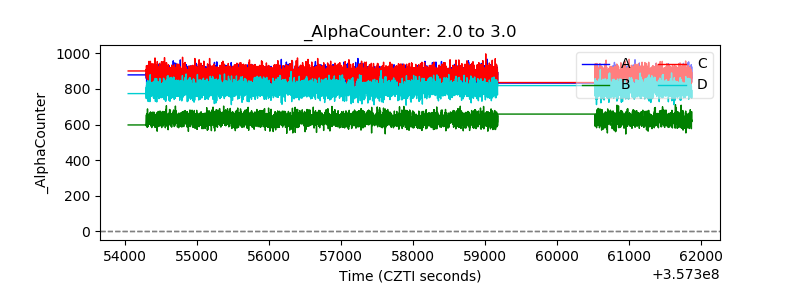 |
| _CPM_Rate | 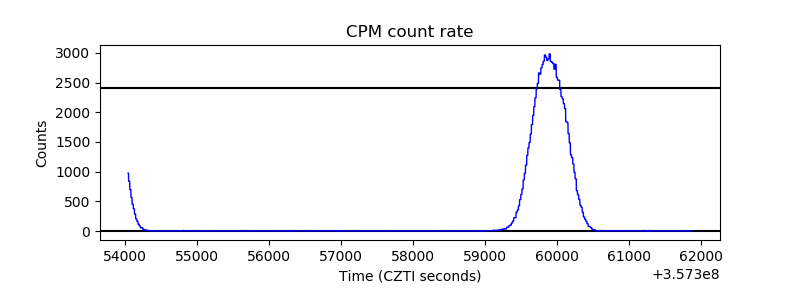 |
| CZT Counter | 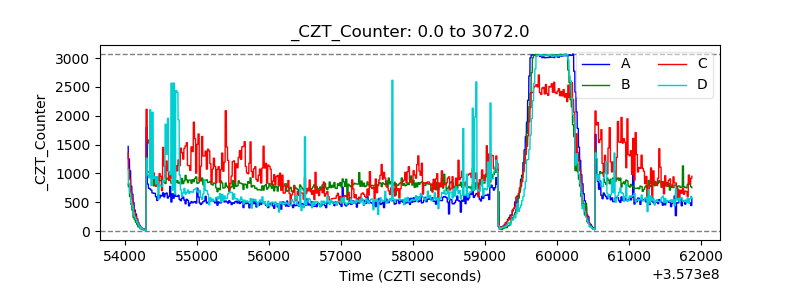 |
| +2.5 Volts monitor |  |
| +5 Volts monitor |  |
| _ROLL_ROT | 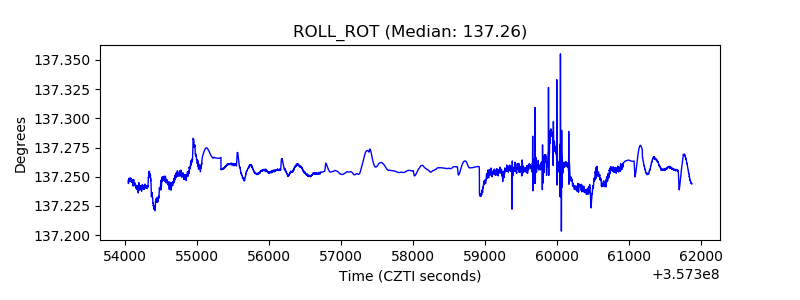 |
| _Roll_DEC | 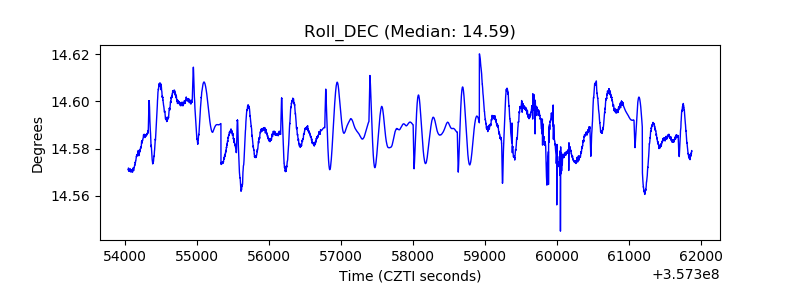 |
| _Roll_RA | 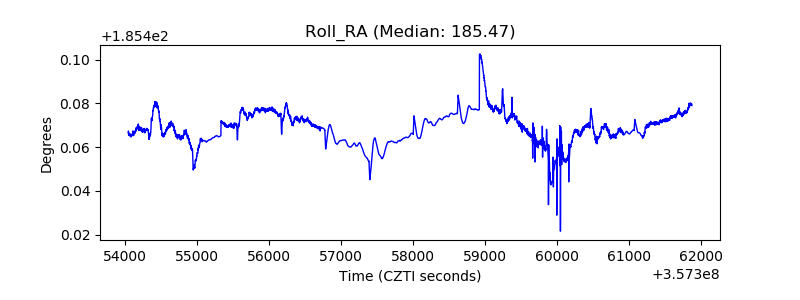 |
| Veto Counter | 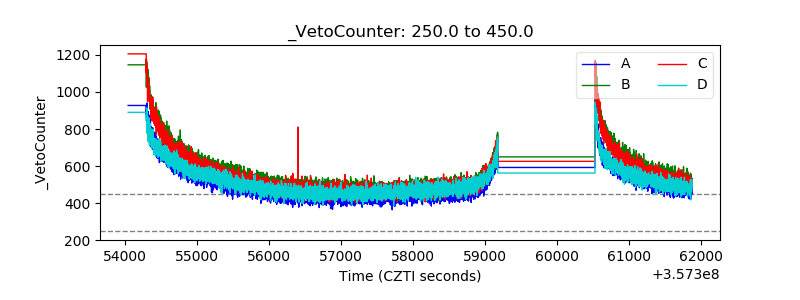 |