| Param | Original file | Final file |
|---|---|---|
| Filename | modeM0/AS1A10_071T09_9000004344_30199cztM0_level2.evt | modeM0/AS1A10_071T09_9000004344_30199cztM0_level2_quad_clean.evt |
| Size (bytes) | 879,543,360 | 89,311,680 |
| Size | 838.8 MB | 85.2 MB |
| Events in quadrant A | 4,313,748 | 550,403 |
| Events in quadrant B | 6,526,251 | 550,203 |
| Events in quadrant C | 9,951,358 | 501,113 |
| Events in quadrant D | 5,276,147 | 515,618 |
| Mode SS | |||
|---|---|---|---|
| Quadrant | BADHDUFLAG | Total packets | Discarded packets |
| A | 0 | 172 | 0 |
| B | 0 | 172 | 0 |
| C | 0 | 172 | 0 |
| D | 0 | 172 | 0 |
| Mode M0 | |||
|---|---|---|---|
| Quadrant | BADHDUFLAG | Total packets | Discarded packets |
| A | 0 | 18124 | 2 |
| B | 0 | 25805 | 2 |
| C | 0 | 35570 | 2 |
| D | 0 | 20812 | 2 |
| Mode M9 | |||
|---|---|---|---|
| Quadrant | BADHDUFLAG | Total packets | Discarded packets |
| A | 0 | 6 | 0 |
| B | 0 | 6 | 0 |
| C | 0 | 6 | 0 |
| D | 0 | 6 | 0 |
| Quadrant | Total seconds | Saturated seconds | Saturation percentage |
|---|---|---|---|
| A | 8445 | 350 | 4.144464% |
| B | 8445 | 501 | 5.932504% |
| C | 8445 | 1379 | 16.329189% |
| D | 8445 | 370 | 4.381291% |
Noise dominated data is calculated using 1-second bins in cleaned event files. If a bin has >2000 counts, and if more than 50% of those come from <1% of pixels, then it is considered to be noise-dominated and hence unusable.
| Quadrant | # 1 sec bins | Bins with >0 counts | Bins with >2000 counts | High rate bins dominated by noise | Noise dominated (total time) | Noise dominated (detector-on time) | Marked lightcurve |
|---|---|---|---|---|---|---|---|
| A | 9040 | 8447 | 9 | 9 | 0.10% | 0.11% | 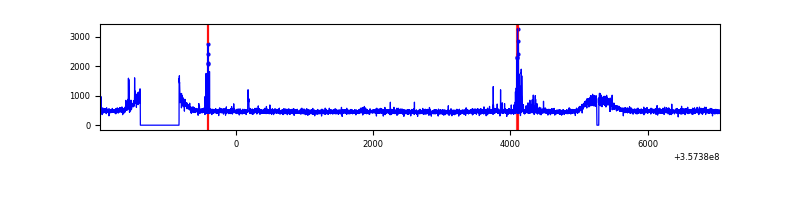 |
| B | 9040 | 8447 | 0 | 0 | 0.00% | 0.00% | 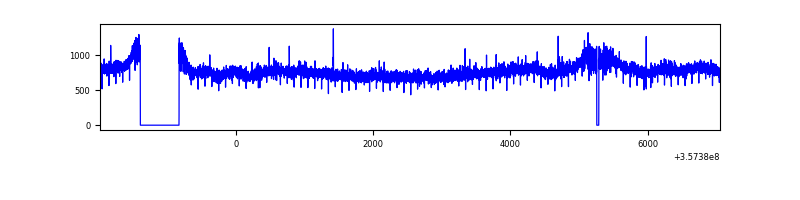 |
| C | 9040 | 8446 | 489 | 489 | 5.41% | 5.79% | 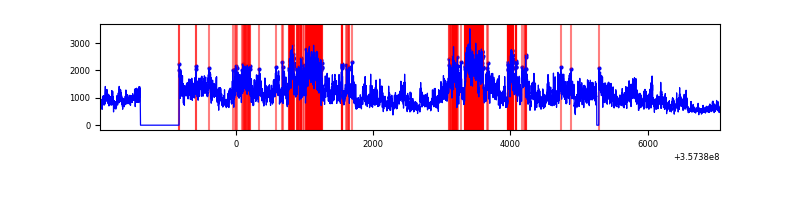 |
| D | 9040 | 8447 | 173 | 173 | 1.91% | 2.05% | 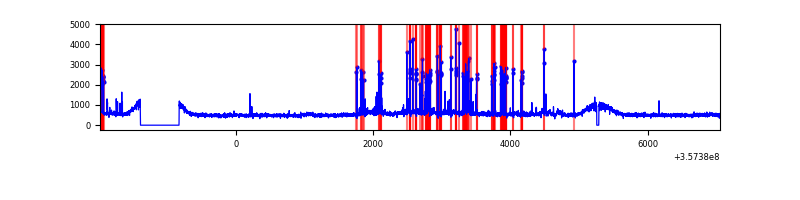 |
Top three noisy pixels from each quadrant. If the there are fewer than three noisy pixels in the level2.evt file, extra rows are filled as -1
| Pixel properties | Quadrant properties | ||||||
|---|---|---|---|---|---|---|---|
| Quadrant | DetID | PixID | Counts | Sigma | Mean | Median | Sigma |
| A | 0 | 13 | 112804 | 506.0 | 1084 | 1060 | 220.8 |
| A | 13 | 254 | 14121 | 59.14 | 1084 | 1060 | 220.8 |
| A | 3 | 137 | 11714 | 48.24 | 1084 | 1060 | 220.8 |
| B | 6 | 159 | 2335178 | 11018.3 | 1066 | 1032 | 211.8 |
| B | 12 | 111 | 27009 | 122.62 | 1066 | 1032 | 211.8 |
| B | 11 | 111 | 24885 | 112.6 | 1066 | 1032 | 211.8 |
| C | 3 | 233 | 5877332 | 24825.12 | 999 | 1002 | 236.7 |
| C | 14 | 238 | 157345 | 660.49 | 999 | 1002 | 236.7 |
| C | 2 | 114 | 19890 | 79.79 | 999 | 1002 | 236.7 |
| D | 13 | 104 | 471561 | 1873.13 | 1040 | 1013 | 251.2 |
| D | 7 | 223 | 368747 | 1463.86 | 1040 | 1013 | 251.2 |
| D | 8 | 195 | 300352 | 1191.59 | 1040 | 1013 | 251.2 |
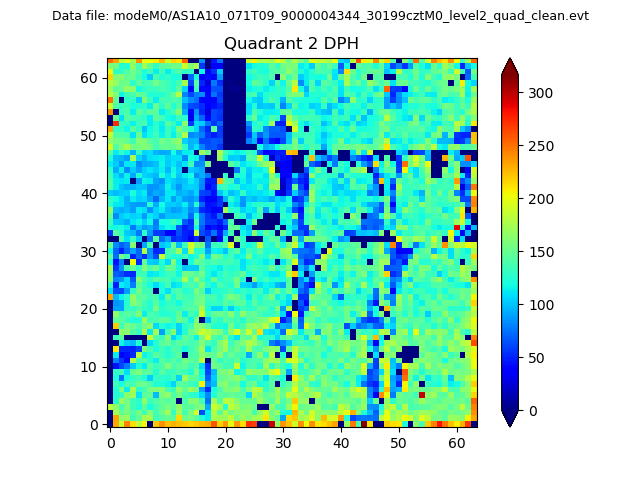
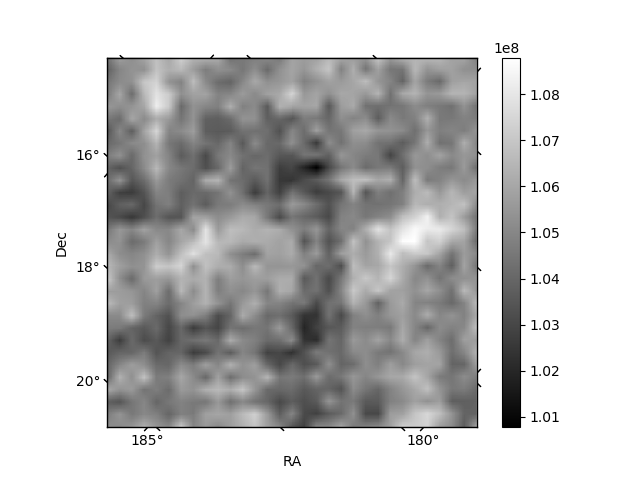
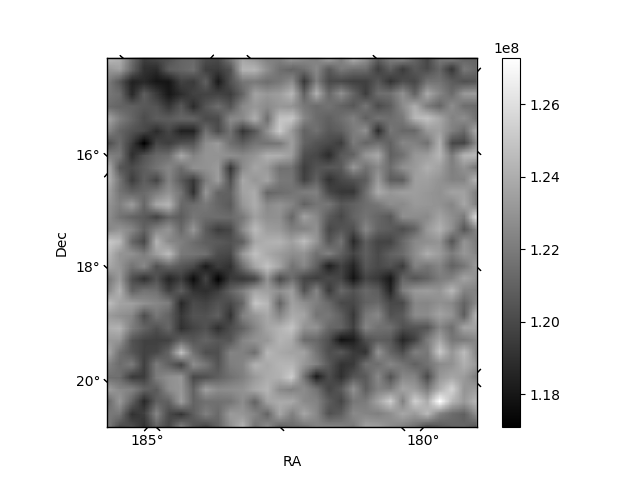
Histogram calculated using DETX and DETY for each event in the final _common_clean file
| Quadrant A | 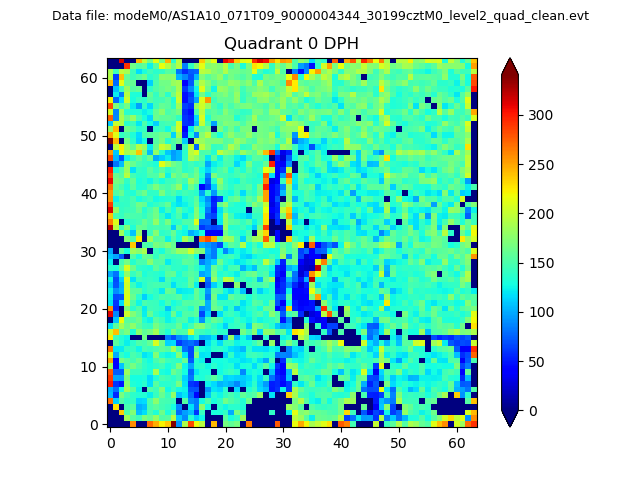 |
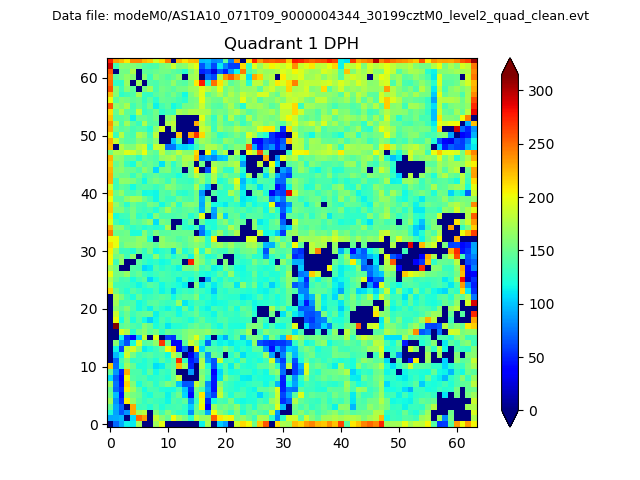 |
Quadrant B |
|---|---|---|---|
| Quadrant D | 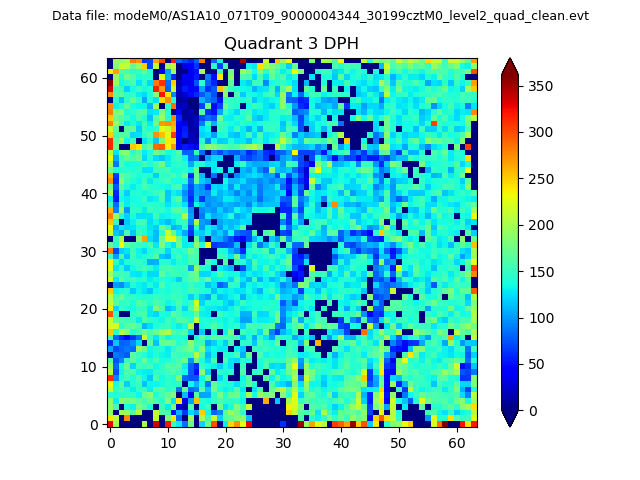 |
 |
Quadrant C |
| Plot type | Count rate plots | Images |
|---|---|---|
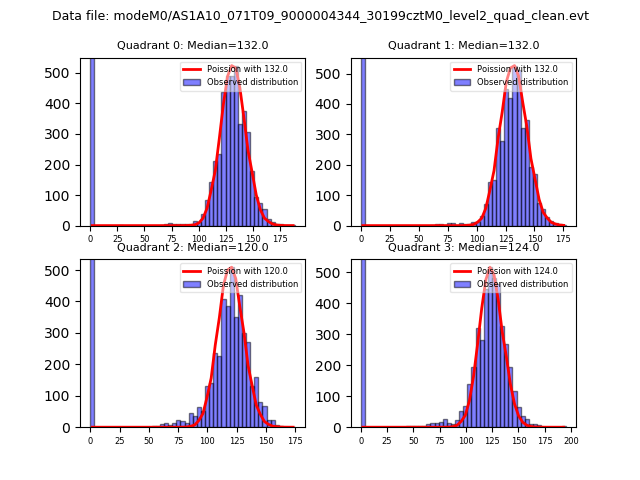
| Comparison with Poisson distribution Blue bars denote a histogram of data divided into 1 sec bins. Red curve is a Poisson curve with rate = median count rate of data. |
 |
 |
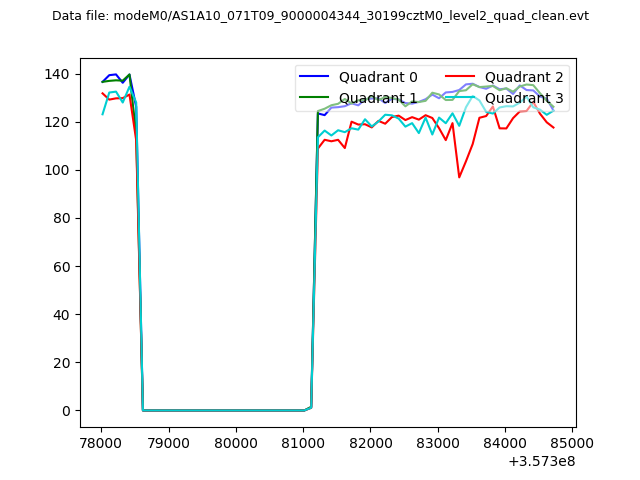
| Quadrant-wise count rates Data is divided into 100 sec bins |
 |
|
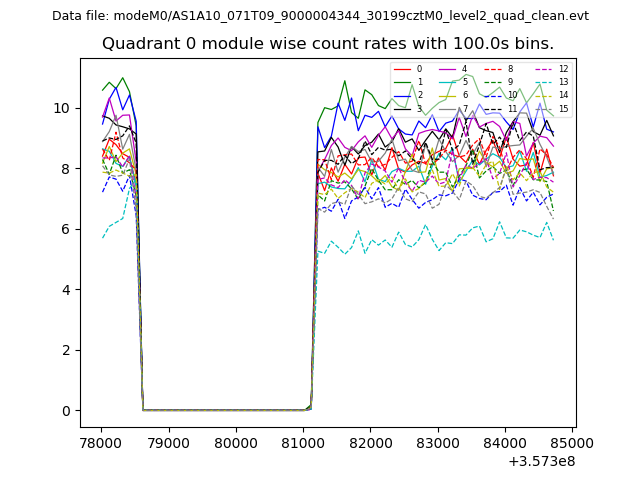
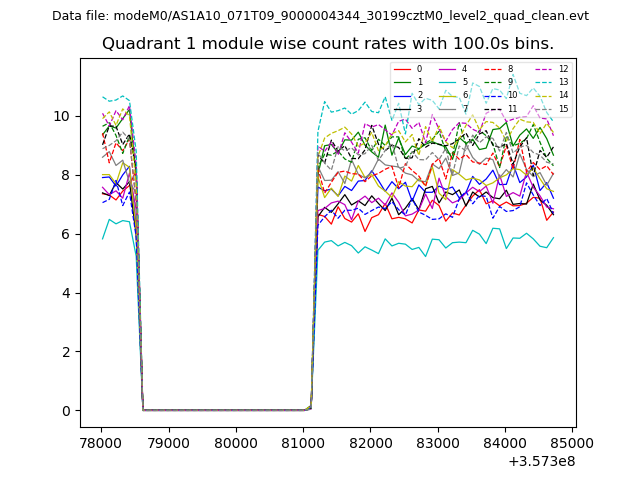
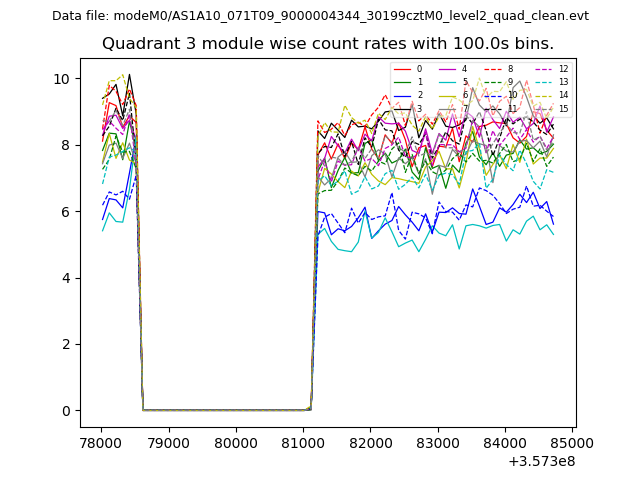
| Module-wise count rates for Quadrant A Data is divided into 100 sec bins |
 |
 |
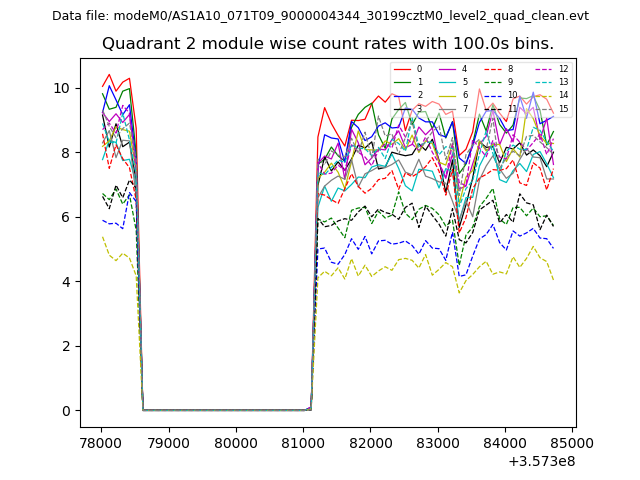
| Module-wise count rates for Quadrant B Data is divided into 100 sec bins |
 |
 |
| Module-wise count rates for Quadrant C Data is divided into 100 sec bins |
 |
 |
| Module-wise count rates for Quadrant D Data is divided into 100 sec bins |
 |
 |
| Parameter | Plot |
|---|---|
| CZT HV Monitor | 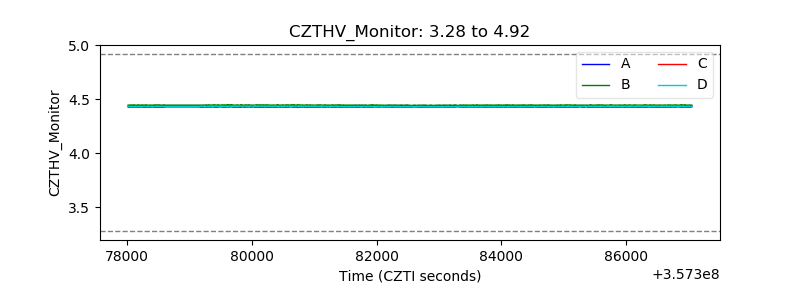 |
| D_VDD | 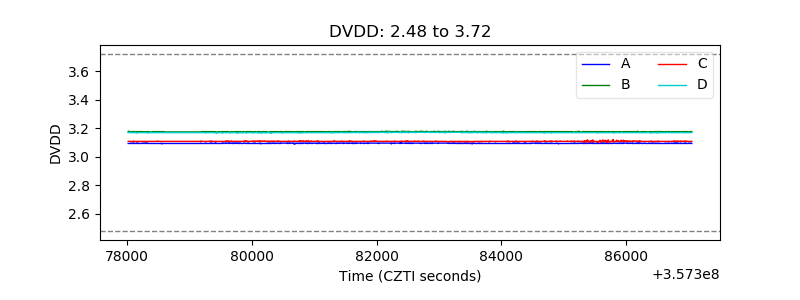 |
| Temperature 1 | 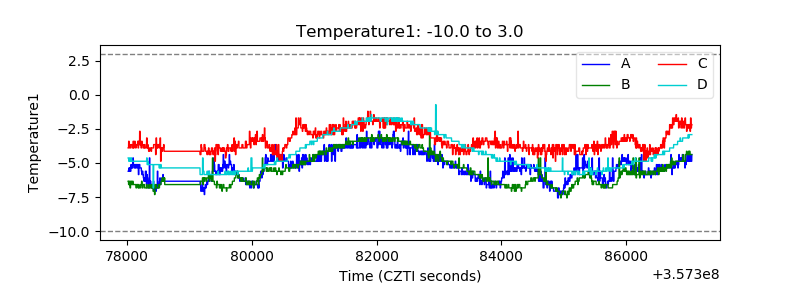 |
| Veto HV Monitor | 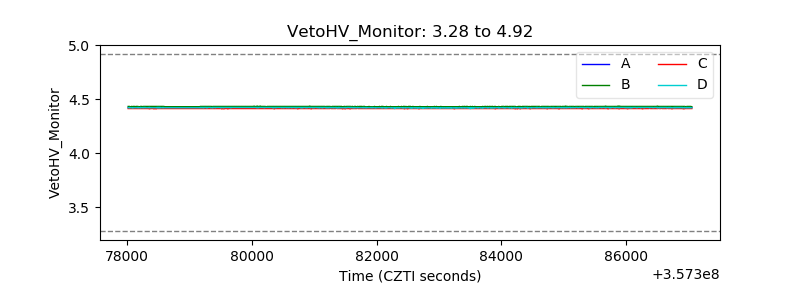 |
| Veto LLD | 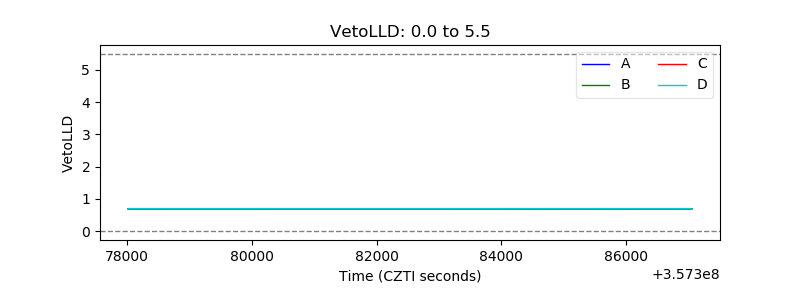 |
| Alpha Counter | 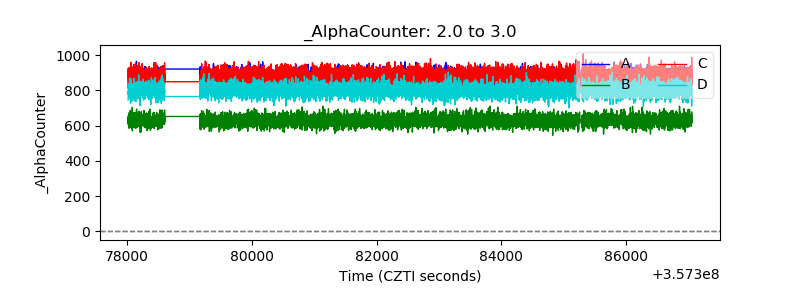 |
| _CPM_Rate | 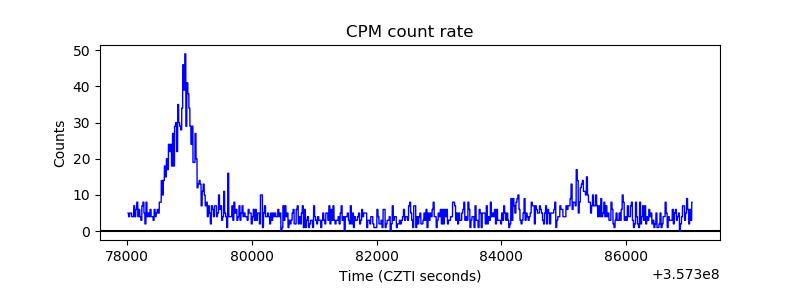 |
| CZT Counter | 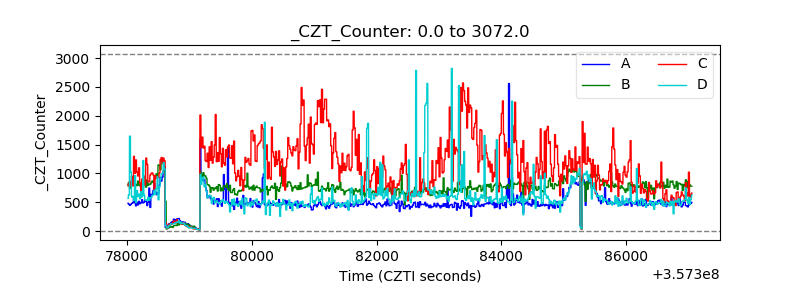 |
| +2.5 Volts monitor |  |
| +5 Volts monitor | 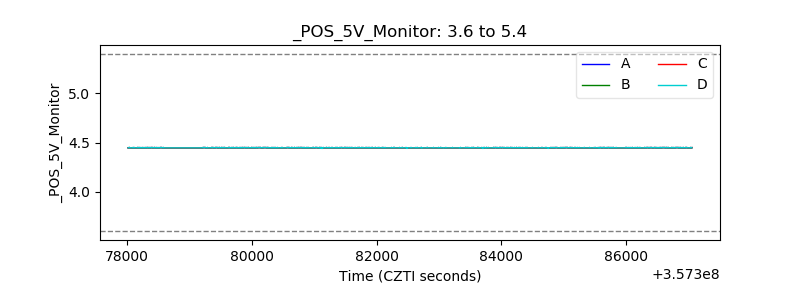 |
| _ROLL_ROT | 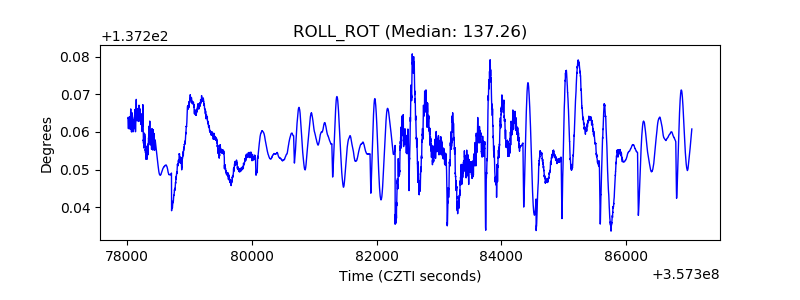 |
| _Roll_DEC | 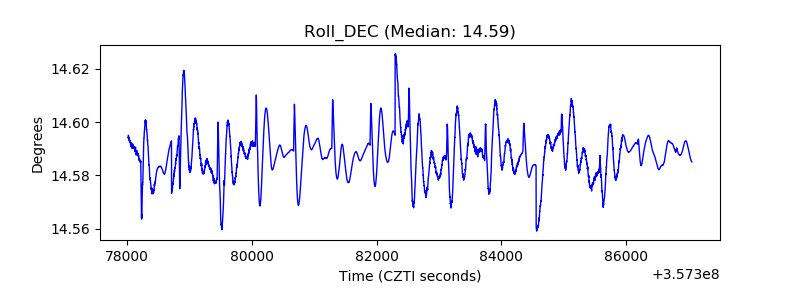 |
| _Roll_RA | 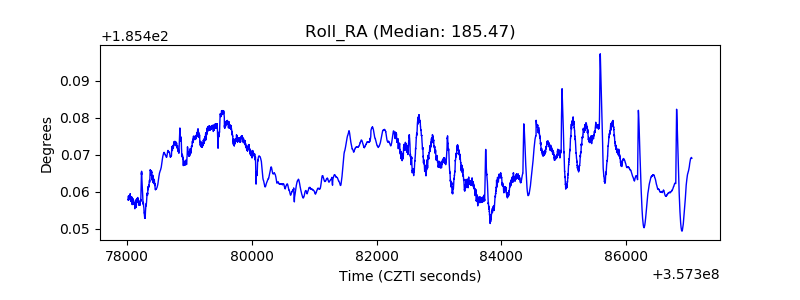 |
| Veto Counter | 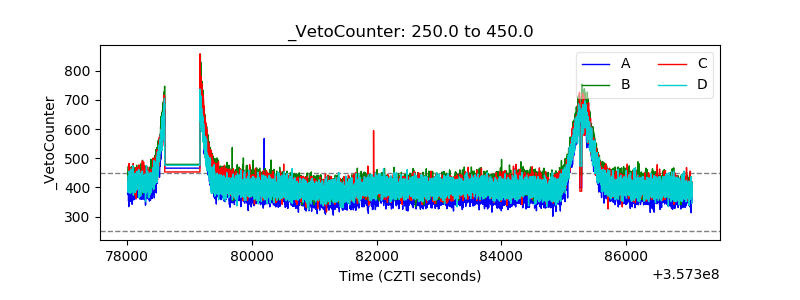 |