| Param | Original file | Final file |
|---|---|---|
| Filename | modeM0/AS1A10_071T09_9000004344_30200cztM0_level2.evt | modeM0/AS1A10_071T09_9000004344_30200cztM0_level2_quad_clean.evt |
| Size (bytes) | 793,177,920 | 84,130,560 |
| Size | 756.4 MB | 80.2 MB |
| Events in quadrant A | 3,942,755 | 515,672 |
| Events in quadrant B | 6,152,725 | 516,295 |
| Events in quadrant C | 8,571,484 | 472,784 |
| Events in quadrant D | 4,812,498 | 484,776 |
| Mode SS | |||
|---|---|---|---|
| Quadrant | BADHDUFLAG | Total packets | Discarded packets |
| A | 0 | 160 | 0 |
| B | 0 | 160 | 0 |
| C | 0 | 160 | 0 |
| D | 0 | 160 | 0 |
| Mode M0 | |||
|---|---|---|---|
| Quadrant | BADHDUFLAG | Total packets | Discarded packets |
| A | 0 | 16803 | 2 |
| B | 0 | 24408 | 2 |
| C | 0 | 31188 | 2 |
| D | 0 | 18905 | 3 |
| Quadrant | Total seconds | Saturated seconds | Saturation percentage |
|---|---|---|---|
| A | 8028 | 382 | 4.758346% |
| B | 8029 | 542 | 6.750529% |
| C | 8029 | 1251 | 15.581019% |
| D | 8028 | 345 | 4.297459% |
Noise dominated data is calculated using 1-second bins in cleaned event files. If a bin has >2000 counts, and if more than 50% of those come from <1% of pixels, then it is considered to be noise-dominated and hence unusable.
| Quadrant | # 1 sec bins | Bins with >0 counts | Bins with >2000 counts | High rate bins dominated by noise | Noise dominated (total time) | Noise dominated (detector-on time) | Marked lightcurve |
|---|---|---|---|---|---|---|---|
| A | 8043 | 8029 | 0 | 0 | 0.00% | 0.00% | 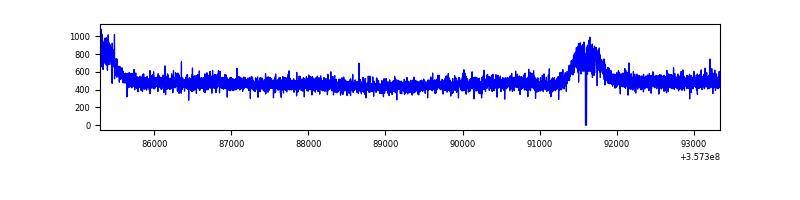 |
| B | 8044 | 8030 | 0 | 0 | 0.00% | 0.00% | 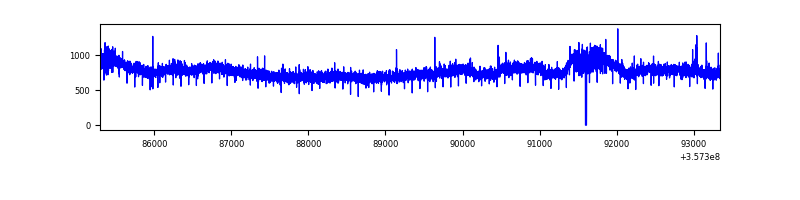 |
| C | 8044 | 8030 | 343 | 343 | 4.26% | 4.27% | 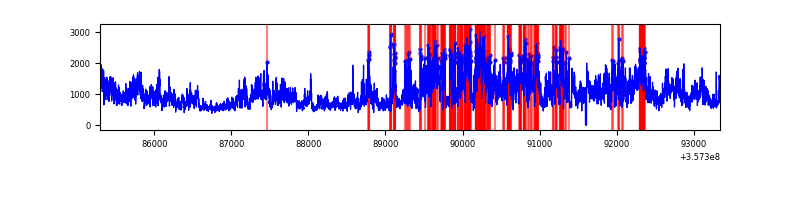 |
| D | 8043 | 8029 | 75 | 75 | 0.93% | 0.93% | 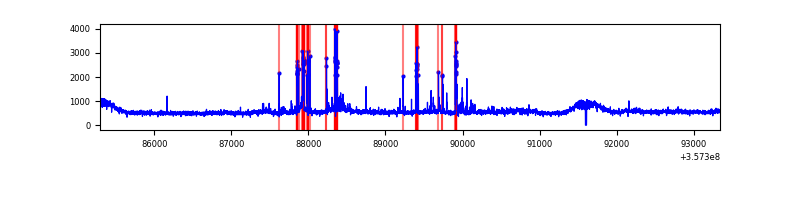 |
Top three noisy pixels from each quadrant. If the there are fewer than three noisy pixels in the level2.evt file, extra rows are filled as -1
| Pixel properties | Quadrant properties | ||||||
|---|---|---|---|---|---|---|---|
| Quadrant | DetID | PixID | Counts | Sigma | Mean | Median | Sigma |
| A | 13 | 254 | 13463 | 59.65 | 1020 | 993 | 209.0 |
| A | 3 | 137 | 11177 | 48.72 | 1020 | 993 | 209.0 |
| A | 0 | 226 | 8512 | 35.97 | 1020 | 993 | 209.0 |
| B | 6 | 159 | 2220714 | 11254.67 | 999 | 971 | 197.2 |
| B | 12 | 111 | 25185 | 122.77 | 999 | 971 | 197.2 |
| B | 11 | 111 | 23610 | 114.79 | 999 | 971 | 197.2 |
| C | 3 | 233 | 4695109 | 21082.44 | 945 | 946 | 222.7 |
| C | 14 | 238 | 148588 | 663.09 | 945 | 946 | 222.7 |
| C | 2 | 114 | 18926 | 80.75 | 945 | 946 | 222.7 |
| D | 7 | 223 | 414877 | 1729.75 | 984 | 958 | 239.3 |
| D | 8 | 195 | 305818 | 1274.0 | 984 | 958 | 239.3 |
| D | 13 | 104 | 205043 | 852.86 | 984 | 958 | 239.3 |
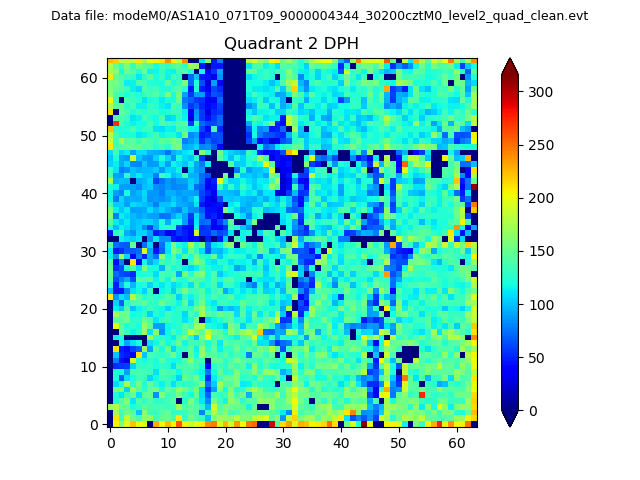
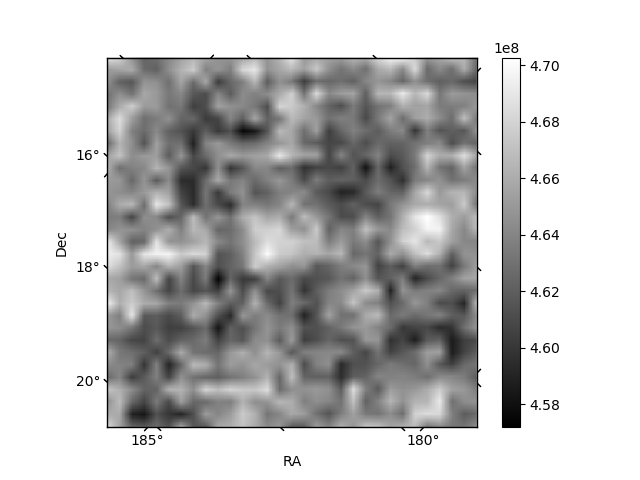
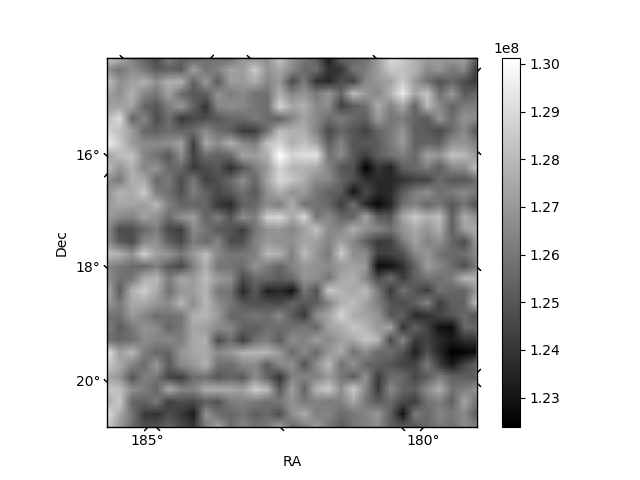
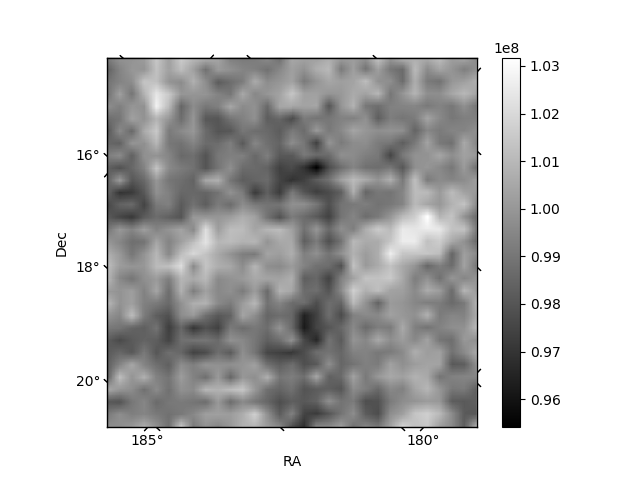
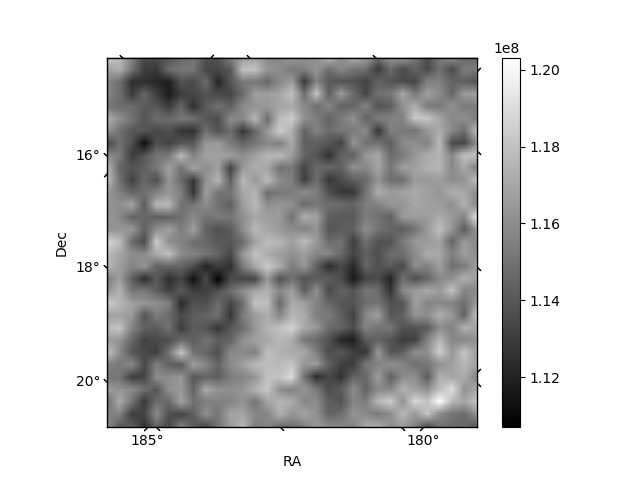
Histogram calculated using DETX and DETY for each event in the final _common_clean file
| Quadrant A | 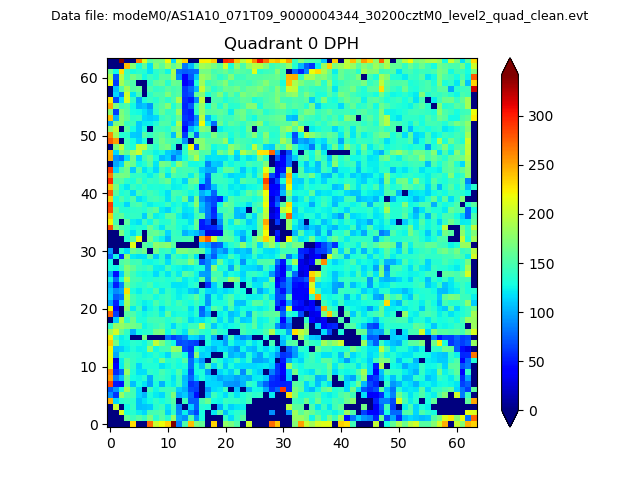 |
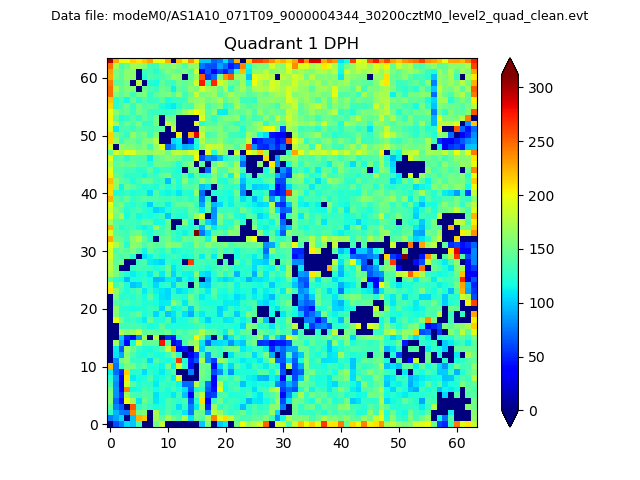 |
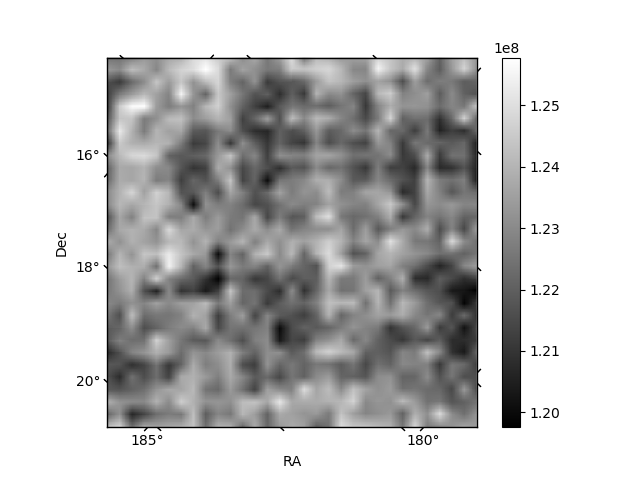
Quadrant B |
|---|---|---|---|
| Quadrant D | 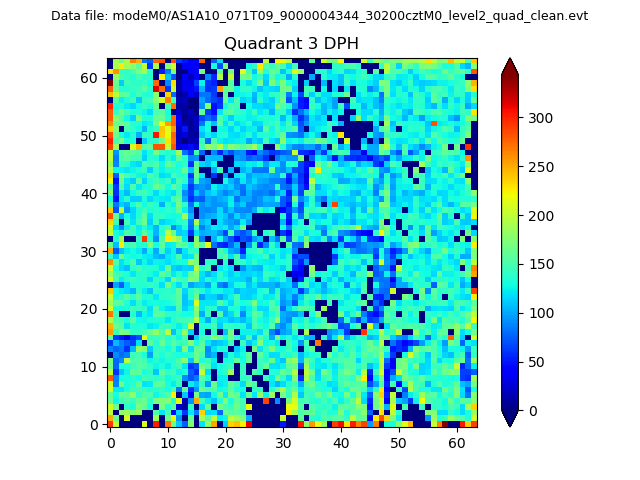 |
 |
Quadrant C |
| Plot type | Count rate plots | Images |
|---|---|---|
| Comparison with Poisson distribution Blue bars denote a histogram of data divided into 1 sec bins. Red curve is a Poisson curve with rate = median count rate of data. |
 |
 |
| Quadrant-wise count rates Data is divided into 100 sec bins |
 |
|
| Module-wise count rates for Quadrant A Data is divided into 100 sec bins |
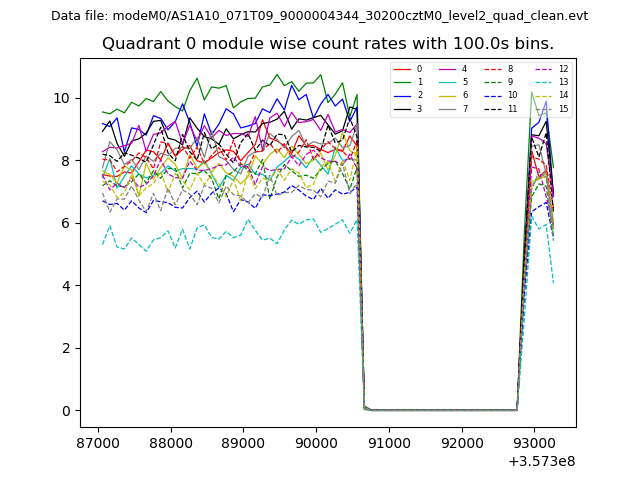 |
 |
| Module-wise count rates for Quadrant B Data is divided into 100 sec bins |
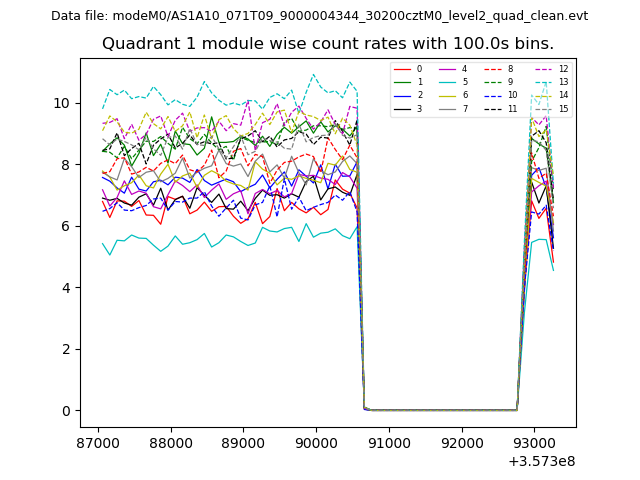 |
 |
| Module-wise count rates for Quadrant C Data is divided into 100 sec bins |
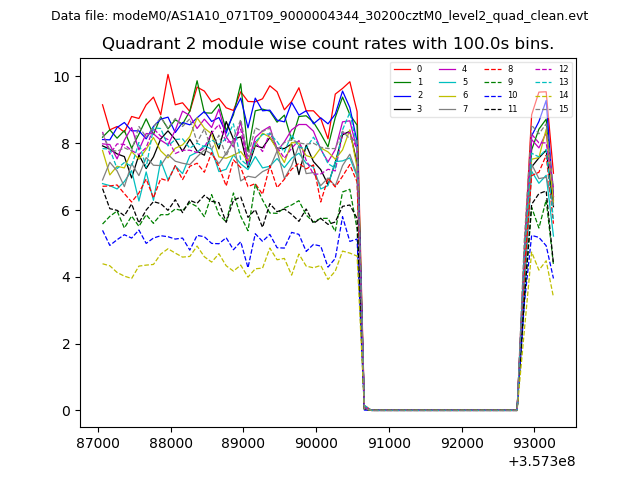 |
 |
| Module-wise count rates for Quadrant D Data is divided into 100 sec bins |
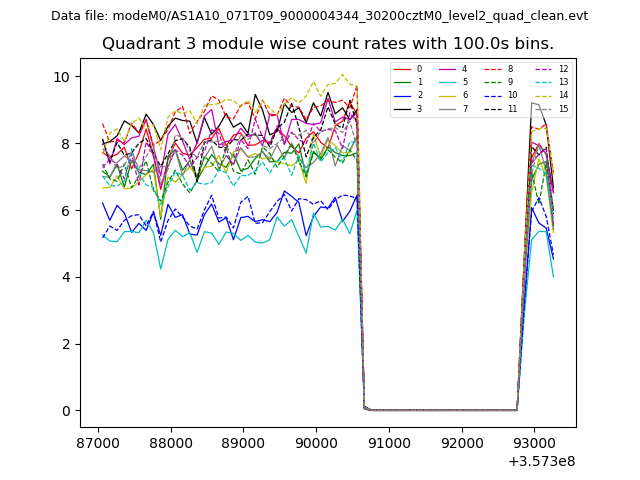 |
 |
| Parameter | Plot |
|---|---|
| CZT HV Monitor |  |
| D_VDD | 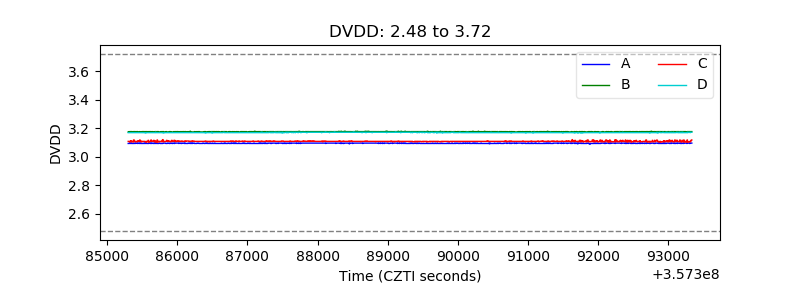 |
| Temperature 1 | 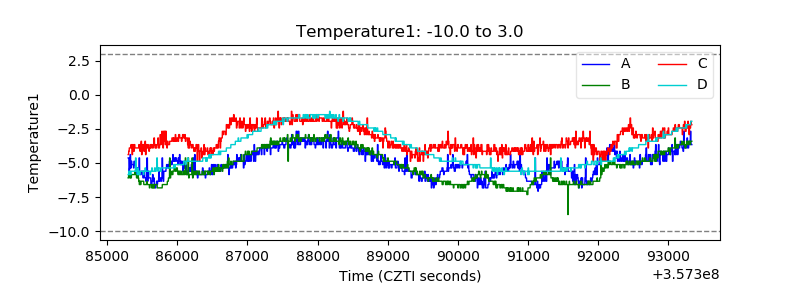 |
| Veto HV Monitor |  |
| Veto LLD | 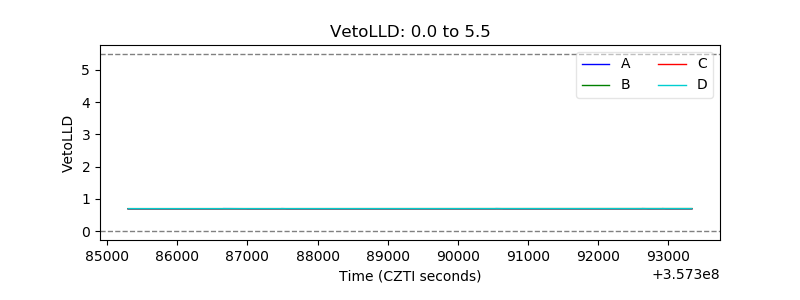 |
| Alpha Counter | 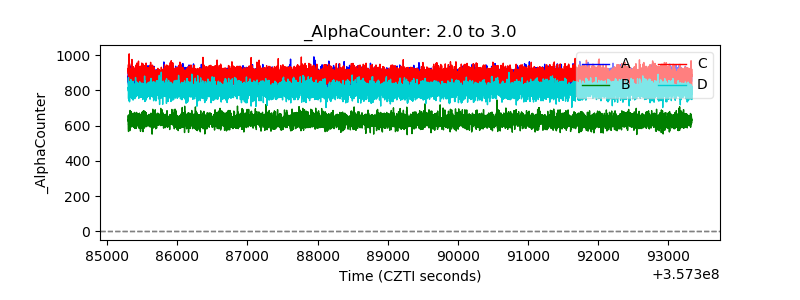 |
| _CPM_Rate | 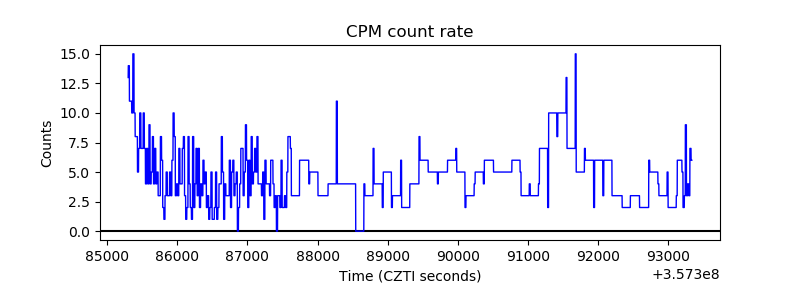 |
| CZT Counter | 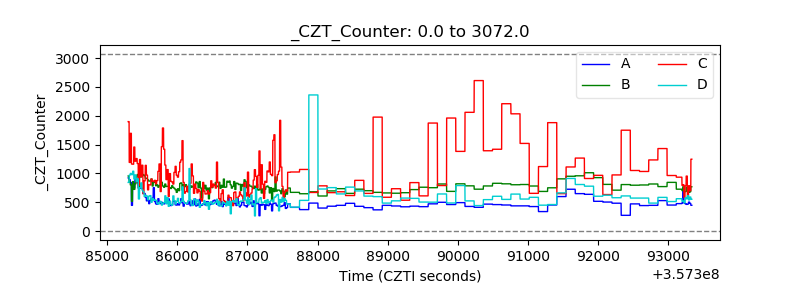 |
| +2.5 Volts monitor |  |
| +5 Volts monitor |  |
| _ROLL_ROT | 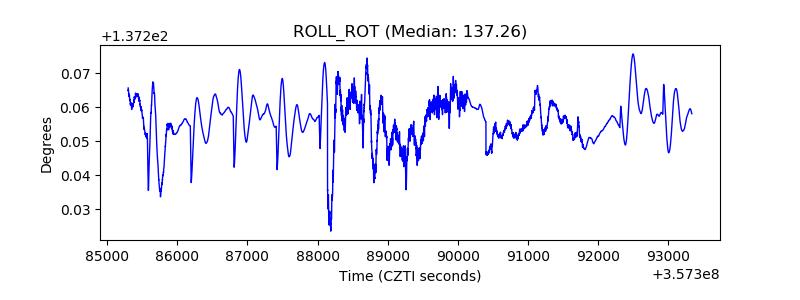 |
| _Roll_DEC | 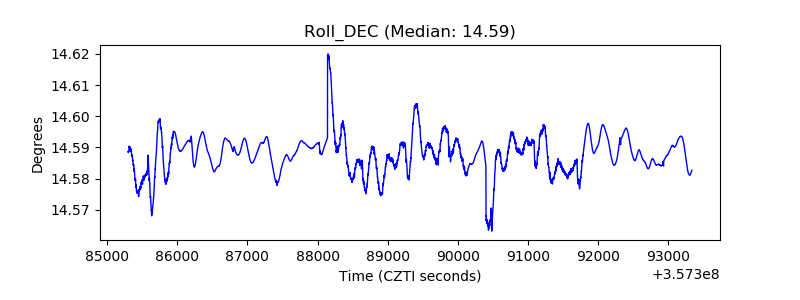 |
| _Roll_RA | 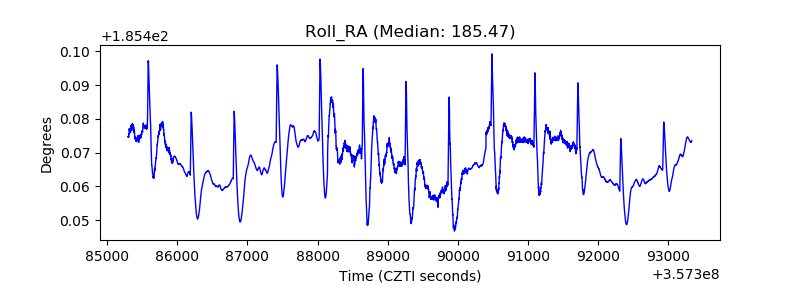 |
| Veto Counter | 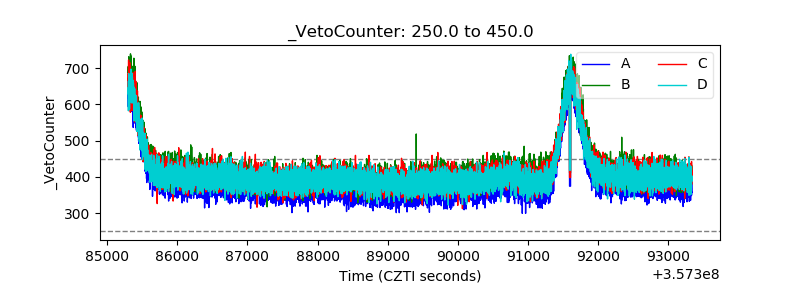 |