| Param | Original file | Final file |
|---|---|---|
| Filename | modeM0/AS1A10_071T09_9000004344_30201cztM0_level2.evt | modeM0/AS1A10_071T09_9000004344_30201cztM0_level2_quad_clean.evt |
| Size (bytes) | 607,135,680 | 69,341,760 |
| Size | 579.0 MB | 66.1 MB |
| Events in quadrant A | 2,585,611 | 454,680 |
| Events in quadrant B | 4,025,890 | 452,859 |
| Events in quadrant C | 8,055,283 | 385,993 |
| Events in quadrant D | 3,355,916 | 428,493 |
| Mode SS | |||
|---|---|---|---|
| Quadrant | BADHDUFLAG | Total packets | Discarded packets |
| A | 0 | 108 | 0 |
| B | 0 | 108 | 0 |
| C | 0 | 108 | 0 |
| D | 0 | 108 | 0 |
| Mode M0 | |||
|---|---|---|---|
| Quadrant | BADHDUFLAG | Total packets | Discarded packets |
| A | 0 | 11247 | 1 |
| B | 0 | 16345 | 1 |
| C | 0 | 27727 | 1 |
| D | 0 | 13276 | 1 |
| Quadrant | Total seconds | Saturated seconds | Saturation percentage |
|---|---|---|---|
| A | 5385 | 253 | 4.698236% |
| B | 5385 | 356 | 6.610956% |
| C | 5385 | 1682 | 31.234912% |
| D | 5386 | 228 | 4.233197% |
Noise dominated data is calculated using 1-second bins in cleaned event files. If a bin has >2000 counts, and if more than 50% of those come from <1% of pixels, then it is considered to be noise-dominated and hence unusable.
| Quadrant | # 1 sec bins | Bins with >0 counts | Bins with >2000 counts | High rate bins dominated by noise | Noise dominated (total time) | Noise dominated (detector-on time) | Marked lightcurve |
|---|---|---|---|---|---|---|---|
| A | 5400 | 5386 | 0 | 0 | 0.00% | 0.00% | 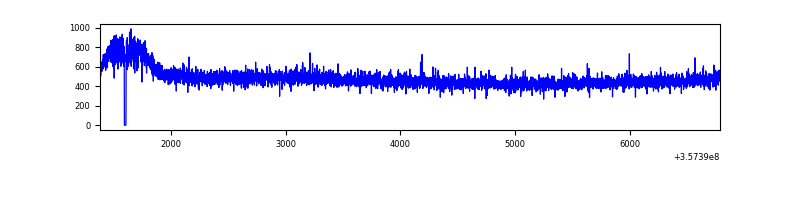 |
| B | 5400 | 5386 | 0 | 0 | 0.00% | 0.00% | 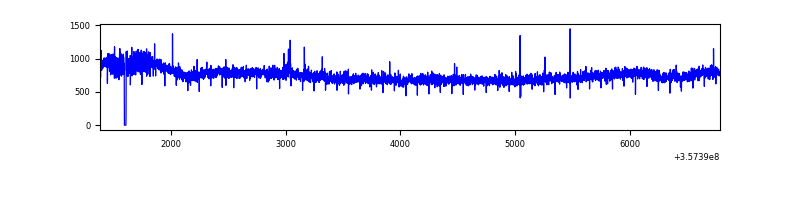 |
| C | 5400 | 5386 | 1024 | 1024 | 18.96% | 19.01% | 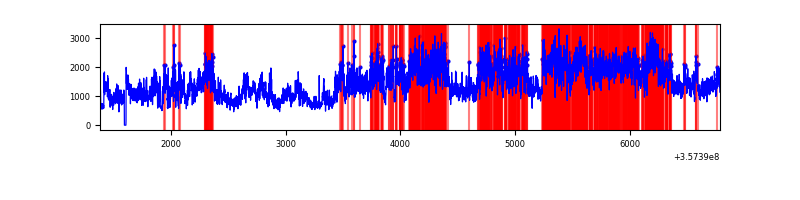 |
| D | 5401 | 5387 | 40 | 40 | 0.74% | 0.74% | 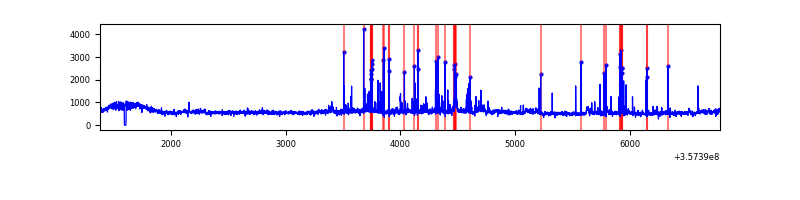 |
Top three noisy pixels from each quadrant. If the there are fewer than three noisy pixels in the level2.evt file, extra rows are filled as -1
| Pixel properties | Quadrant properties | ||||||
|---|---|---|---|---|---|---|---|
| Quadrant | DetID | PixID | Counts | Sigma | Mean | Median | Sigma |
| A | 13 | 254 | 9483 | 63.98 | 669 | 654 | 138.0 |
| A | 3 | 137 | 7198 | 47.42 | 669 | 654 | 138.0 |
| A | 0 | 226 | 5463 | 34.85 | 669 | 654 | 138.0 |
| B | 6 | 159 | 1460339 | 11344.26 | 652 | 634 | 128.7 |
| B | 12 | 111 | 16190 | 120.9 | 652 | 634 | 128.7 |
| B | 11 | 111 | 15015 | 111.76 | 652 | 634 | 128.7 |
| C | 3 | 233 | 5574955 | 39161.85 | 602 | 604 | 142.3 |
| C | 14 | 238 | 92688 | 646.92 | 602 | 604 | 142.3 |
| C | 15 | 208 | 19929 | 135.77 | 602 | 604 | 142.3 |
| D | 7 | 223 | 323690 | 1997.88 | 649 | 631 | 161.7 |
| D | 8 | 195 | 249624 | 1539.84 | 649 | 631 | 161.7 |
| D | 13 | 104 | 112688 | 692.99 | 649 | 631 | 161.7 |
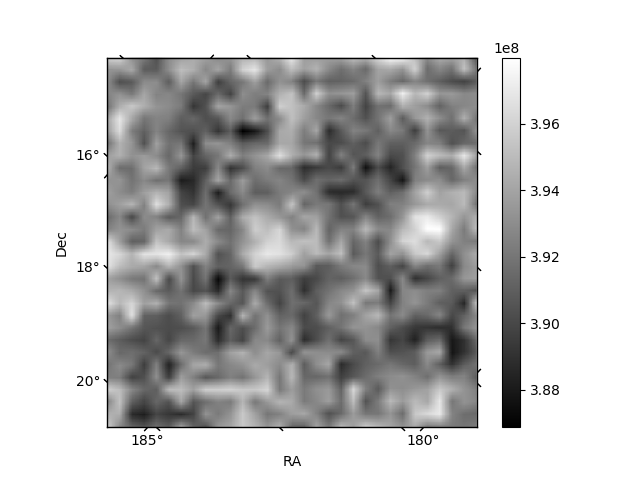
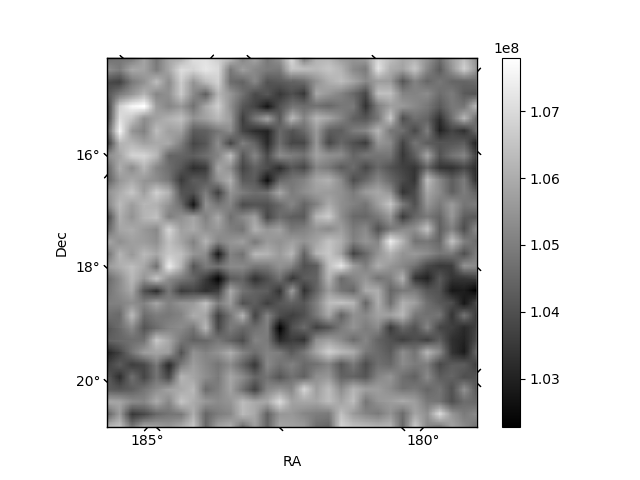
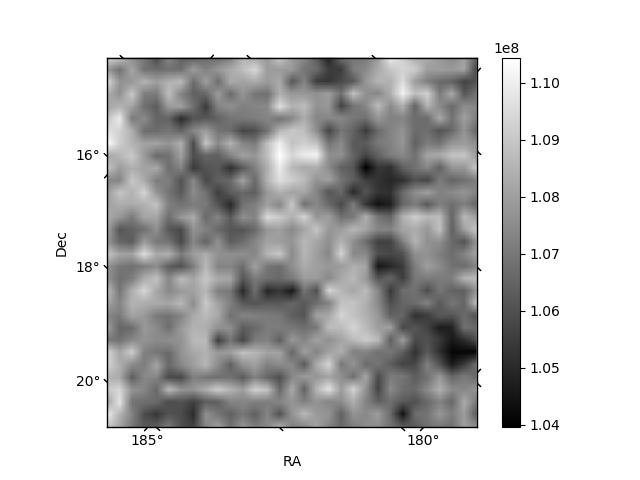
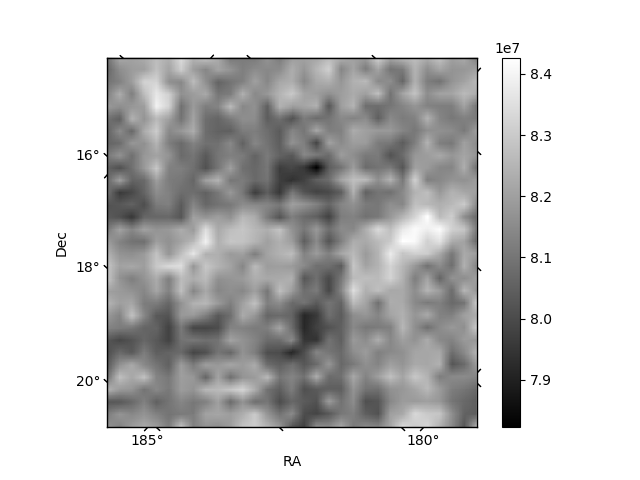
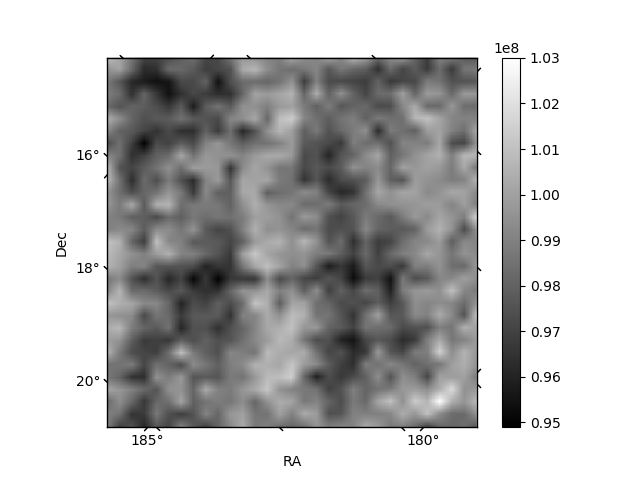
Histogram calculated using DETX and DETY for each event in the final _common_clean file
| Quadrant A | 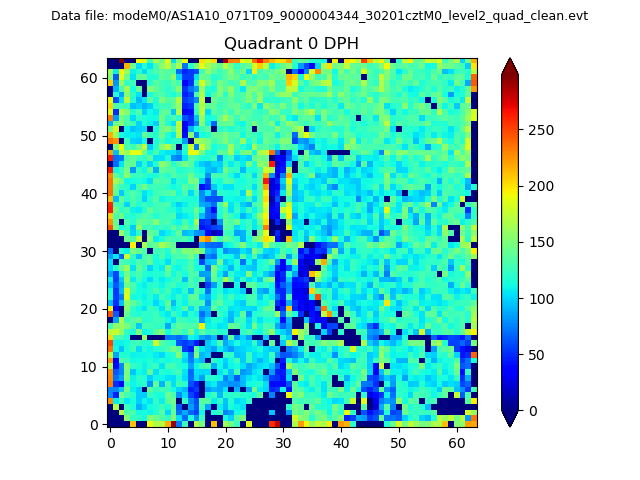 |
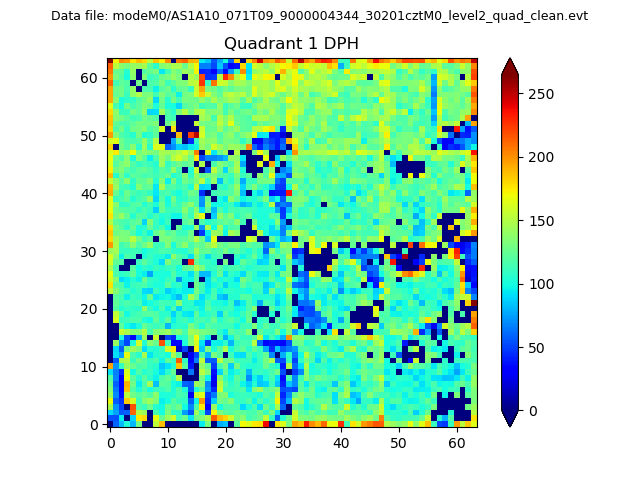 |
Quadrant B |
|---|---|---|---|
| Quadrant D | 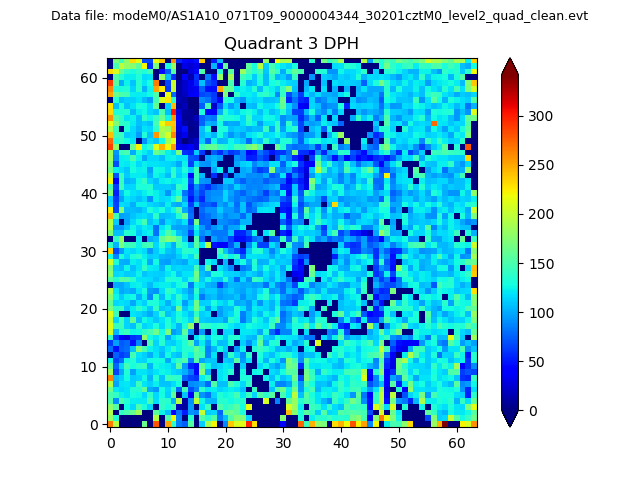 |
 |
Quadrant C |
| Plot type | Count rate plots | Images |
|---|---|---|
| Comparison with Poisson distribution Blue bars denote a histogram of data divided into 1 sec bins. Red curve is a Poisson curve with rate = median count rate of data. |
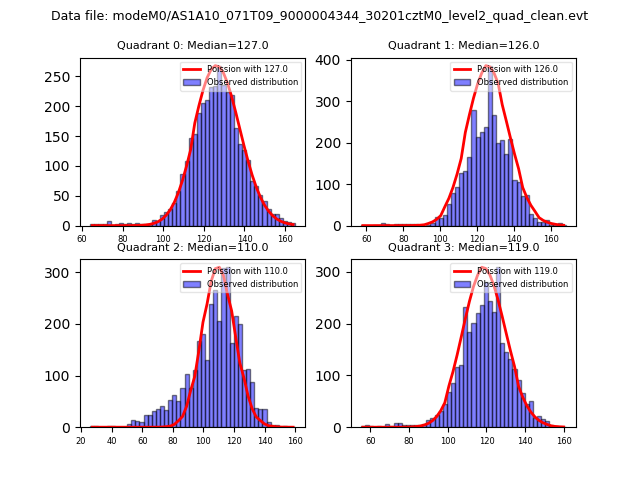 |
 |
| Quadrant-wise count rates Data is divided into 100 sec bins |
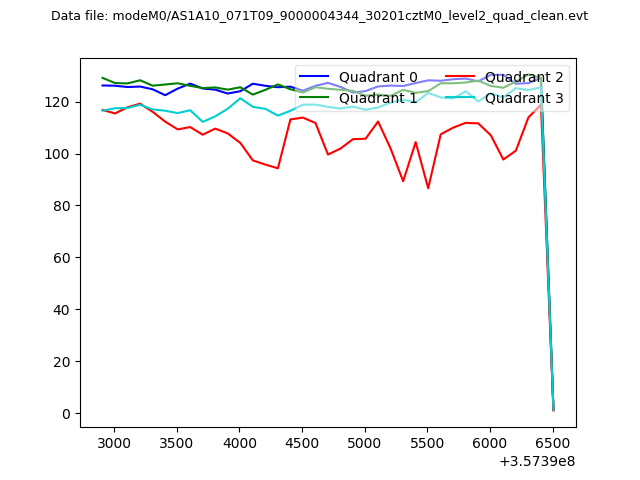 |
|
| Module-wise count rates for Quadrant A Data is divided into 100 sec bins |
 |
 |
| Module-wise count rates for Quadrant B Data is divided into 100 sec bins |
 |
 |
| Module-wise count rates for Quadrant C Data is divided into 100 sec bins |
 |
 |
| Module-wise count rates for Quadrant D Data is divided into 100 sec bins |
 |
 |
| Parameter | Plot |
|---|---|
| CZT HV Monitor | 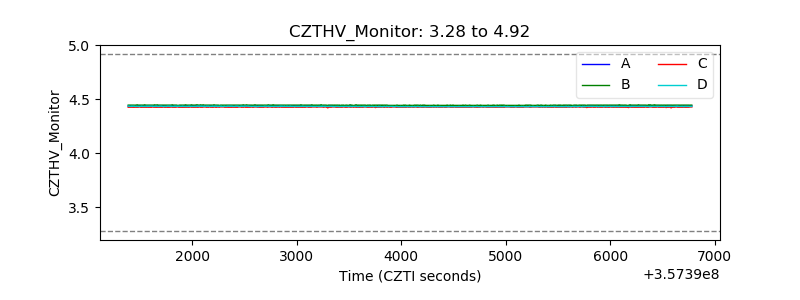 |
| D_VDD | 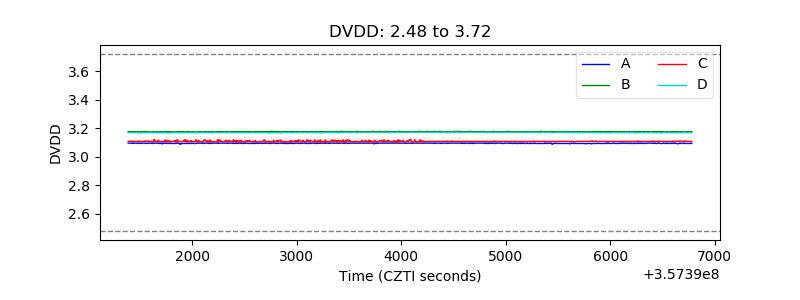 |
| Temperature 1 | 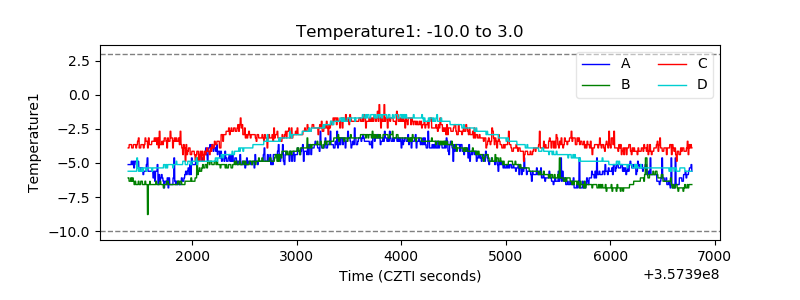 |
| Veto HV Monitor | 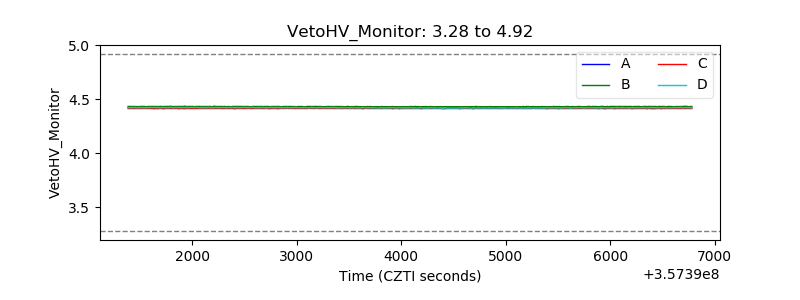 |
| Veto LLD | 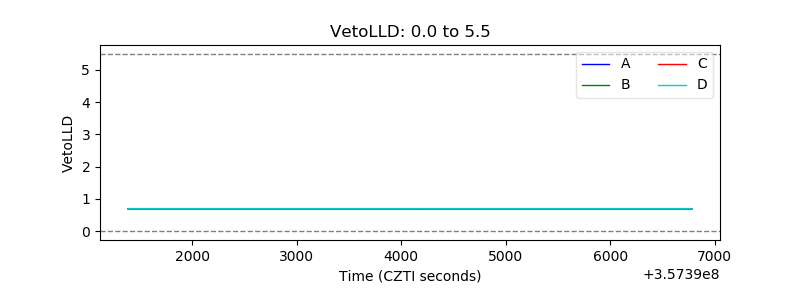 |
| Alpha Counter | 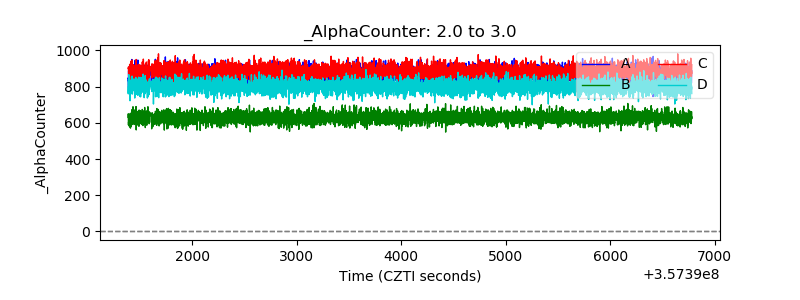 |
| _CPM_Rate | 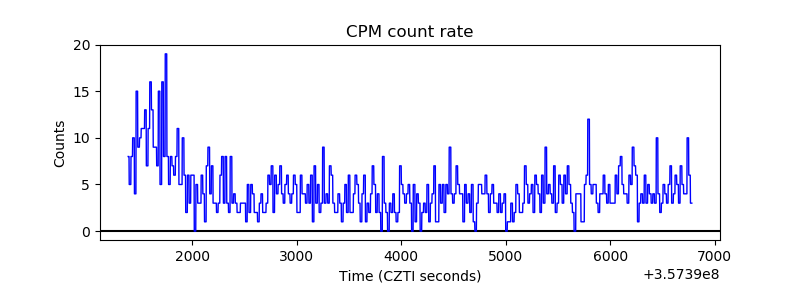 |
| CZT Counter | 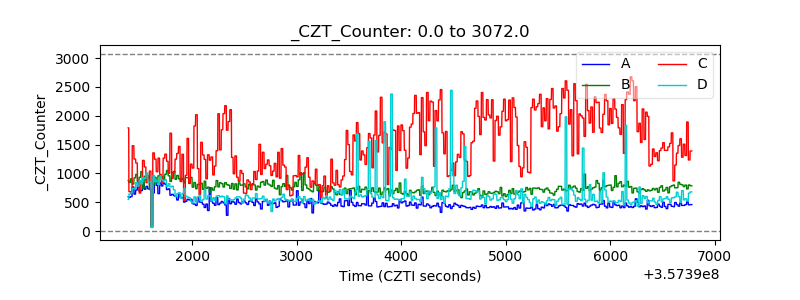 |
| +2.5 Volts monitor | 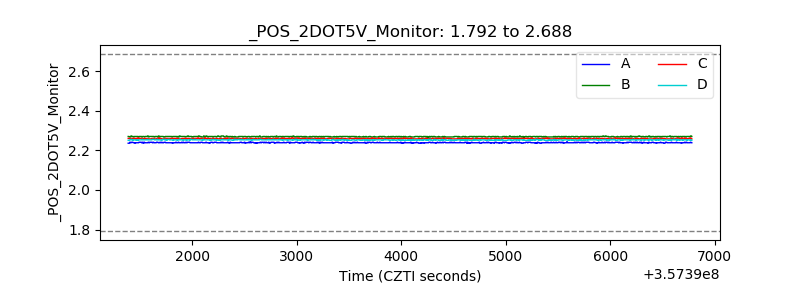 |
| +5 Volts monitor |  |
| _ROLL_ROT | 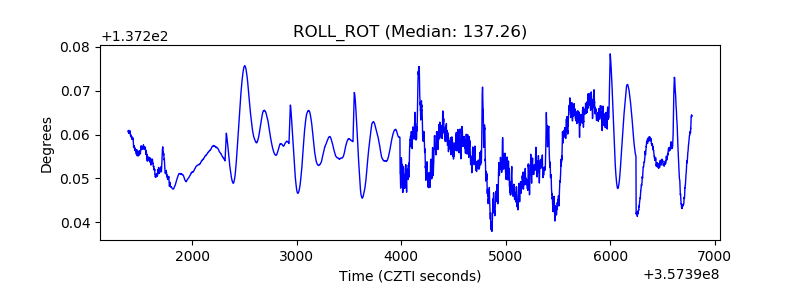 |
| _Roll_DEC |  |
| _Roll_RA | 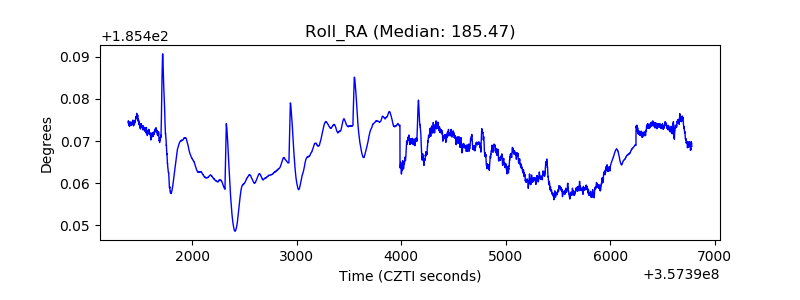 |
| Veto Counter | 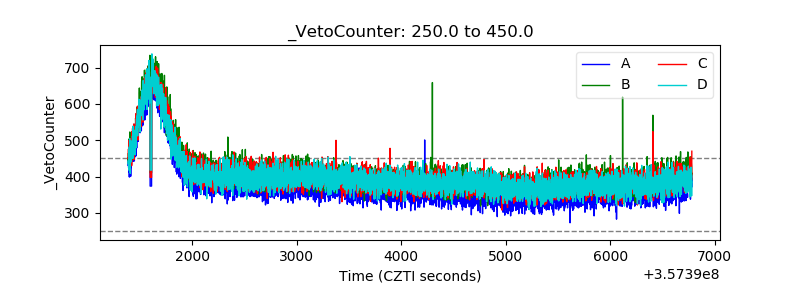 |