| Param | Original file | Final file |
|---|---|---|
| Filename | modeM0/AS1A10_071T09_9000004344_30203cztM0_level2.evt | modeM0/AS1A10_071T09_9000004344_30203cztM0_level2_quad_clean.evt |
| Size (bytes) | 1,015,430,400 | 132,301,440 |
| Size | 968.4 MB | 126.2 MB |
| Events in quadrant A | 4,918,391 | 852,485 |
| Events in quadrant B | 7,696,006 | 851,498 |
| Events in quadrant C | 11,139,819 | 778,169 |
| Events in quadrant D | 6,301,284 | 807,773 |
| Mode SS | |||
|---|---|---|---|
| Quadrant | BADHDUFLAG | Total packets | Discarded packets |
| A | 0 | 208 | 0 |
| B | 0 | 208 | 0 |
| C | 0 | 208 | 0 |
| D | 0 | 208 | 0 |
| Mode M0 | |||
|---|---|---|---|
| Quadrant | BADHDUFLAG | Total packets | Discarded packets |
| A | 0 | 21307 | 2 |
| B | 0 | 31142 | 2 |
| C | 0 | 40566 | 2 |
| D | 0 | 25010 | 2 |
| Mode M9 | |||
|---|---|---|---|
| Quadrant | BADHDUFLAG | Total packets | Discarded packets |
| A | 0 | 10 | 0 |
| B | 0 | 10 | 0 |
| C | 0 | 10 | 0 |
| D | 0 | 10 | 0 |
| Quadrant | Total seconds | Saturated seconds | Saturation percentage |
|---|---|---|---|
| A | 10356 | 191 | 1.844341% |
| B | 10356 | 279 | 2.694090% |
| C | 10356 | 1271 | 12.273078% |
| D | 10357 | 225 | 2.172444% |
Noise dominated data is calculated using 1-second bins in cleaned event files. If a bin has >2000 counts, and if more than 50% of those come from <1% of pixels, then it is considered to be noise-dominated and hence unusable.
| Quadrant | # 1 sec bins | Bins with >0 counts | Bins with >2000 counts | High rate bins dominated by noise | Noise dominated (total time) | Noise dominated (detector-on time) | Marked lightcurve |
|---|---|---|---|---|---|---|---|
| A | 11256 | 10357 | 0 | 0 | 0.00% | 0.00% | 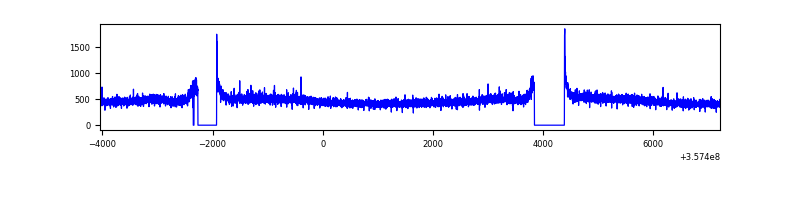 |
| B | 11256 | 10357 | 1 | 1 | 0.01% | 0.01% | 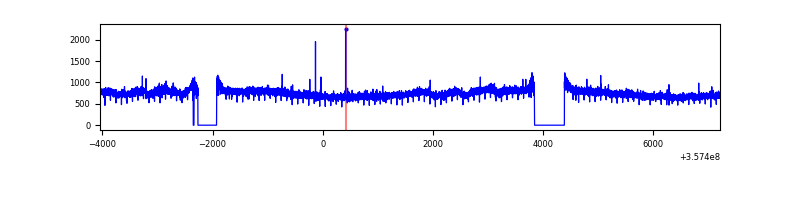 |
| C | 11256 | 10356 | 480 | 480 | 4.26% | 4.63% | 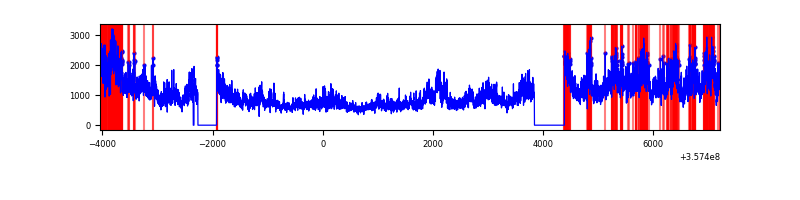 |
| D | 11257 | 10358 | 92 | 92 | 0.82% | 0.89% | 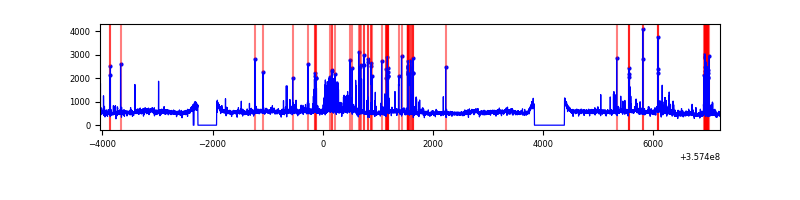 |
Top three noisy pixels from each quadrant. If the there are fewer than three noisy pixels in the level2.evt file, extra rows are filled as -1
| Pixel properties | Quadrant properties | ||||||
|---|---|---|---|---|---|---|---|
| Quadrant | DetID | PixID | Counts | Sigma | Mean | Median | Sigma |
| A | 8 | 192 | 25623 | 94.98 | 1267 | 1239 | 256.7 |
| A | 13 | 254 | 17207 | 62.2 | 1267 | 1239 | 256.7 |
| A | 3 | 137 | 13221 | 46.67 | 1267 | 1239 | 256.7 |
| B | 6 | 159 | 2789028 | 11436.29 | 1247 | 1211 | 243.8 |
| B | 12 | 111 | 30979 | 122.12 | 1247 | 1211 | 243.8 |
| B | 11 | 111 | 28697 | 112.75 | 1247 | 1211 | 243.8 |
| C | 3 | 233 | 6321734 | 22610.61 | 1183 | 1187 | 279.5 |
| C | 14 | 238 | 185404 | 659.0 | 1183 | 1187 | 279.5 |
| C | 2 | 114 | 23412 | 79.5 | 1183 | 1187 | 279.5 |
| D | 7 | 223 | 503848 | 1684.26 | 1224 | 1195 | 298.4 |
| D | 8 | 195 | 474277 | 1585.18 | 1224 | 1195 | 298.4 |
| D | 13 | 104 | 422104 | 1410.36 | 1224 | 1195 | 298.4 |
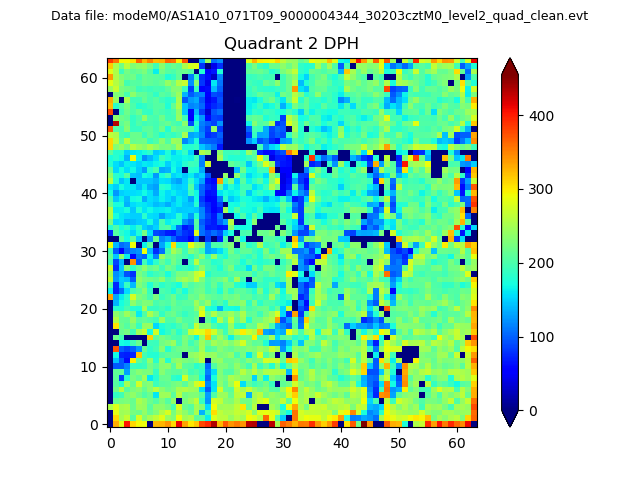
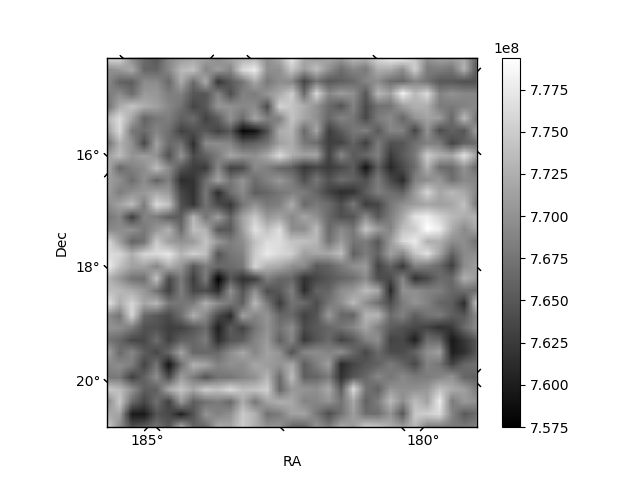
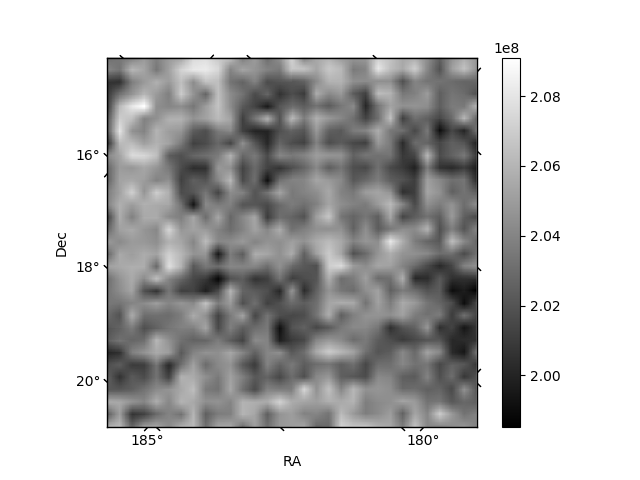
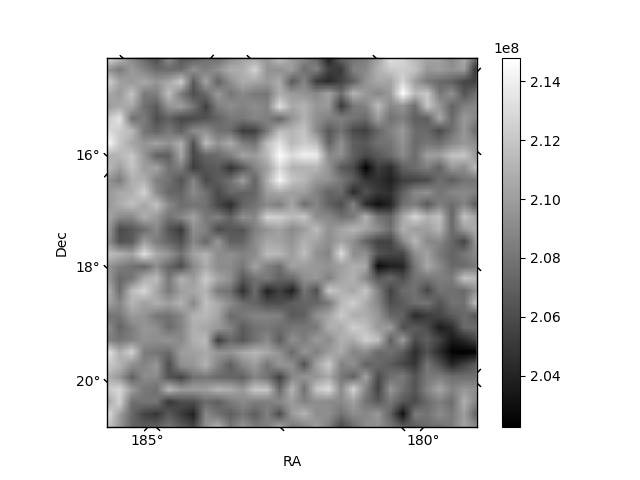
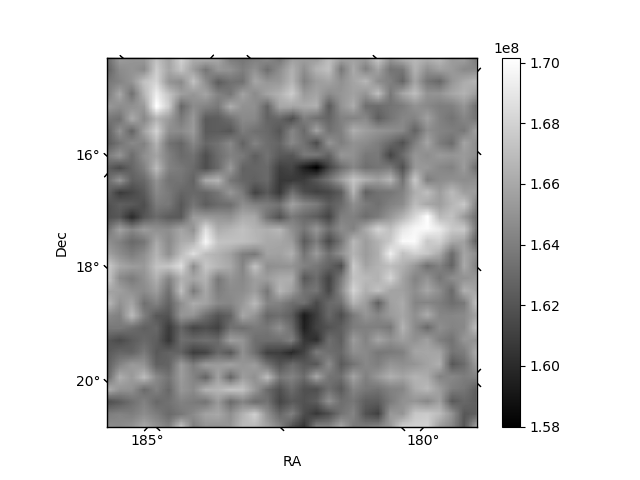
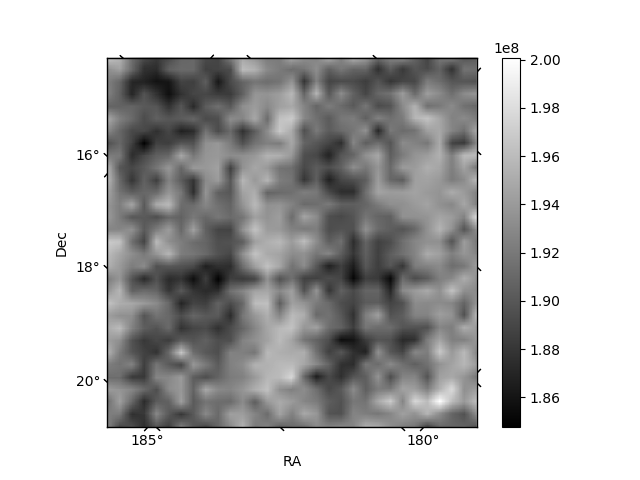
Histogram calculated using DETX and DETY for each event in the final _common_clean file
| Quadrant A | 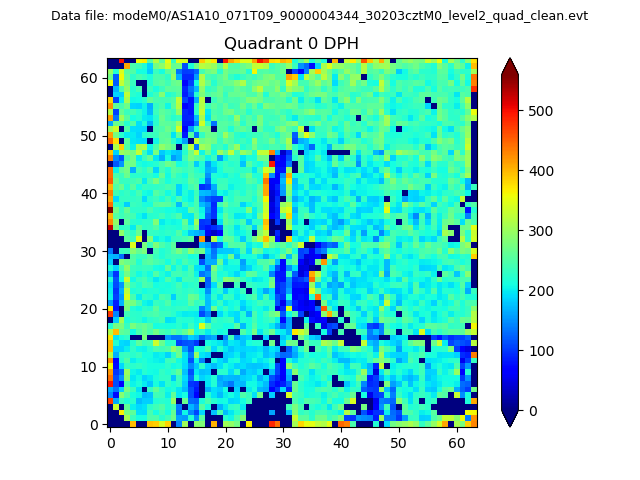 |
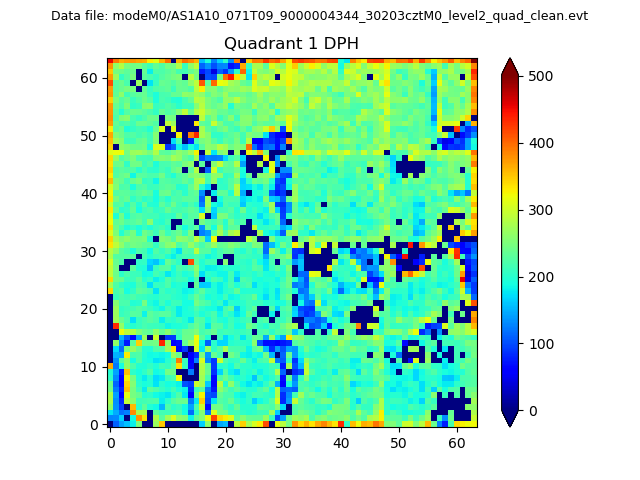 |
Quadrant B |
|---|---|---|---|
| Quadrant D | 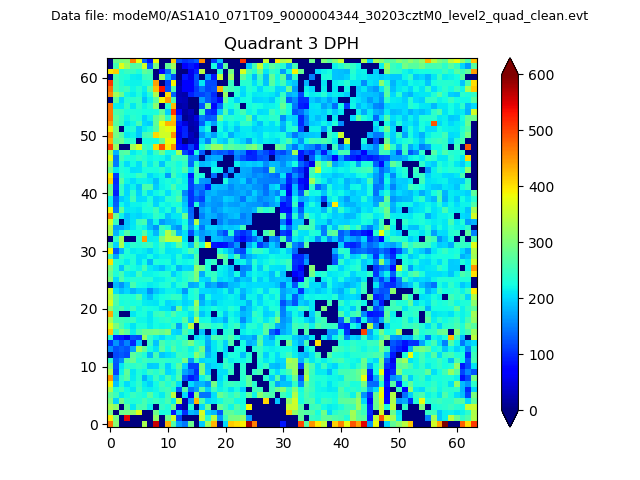 |
 |
Quadrant C |
| Plot type | Count rate plots | Images |
|---|---|---|
| Comparison with Poisson distribution Blue bars denote a histogram of data divided into 1 sec bins. Red curve is a Poisson curve with rate = median count rate of data. |
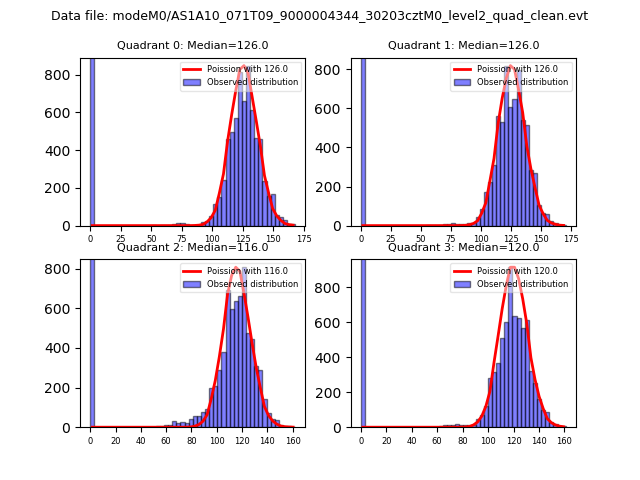 |
 |
| Quadrant-wise count rates Data is divided into 100 sec bins |
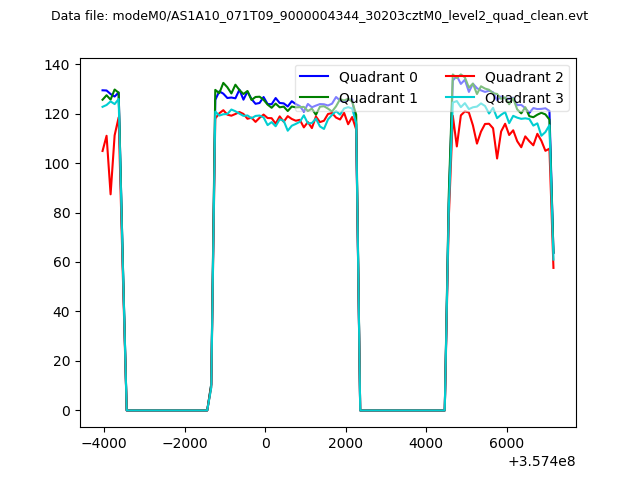 |
|
| Module-wise count rates for Quadrant A Data is divided into 100 sec bins |
 |
 |
| Module-wise count rates for Quadrant B Data is divided into 100 sec bins |
 |
 |
| Module-wise count rates for Quadrant C Data is divided into 100 sec bins |
 |
 |
| Module-wise count rates for Quadrant D Data is divided into 100 sec bins |
 |
 |
| Parameter | Plot |
|---|---|
| CZT HV Monitor | 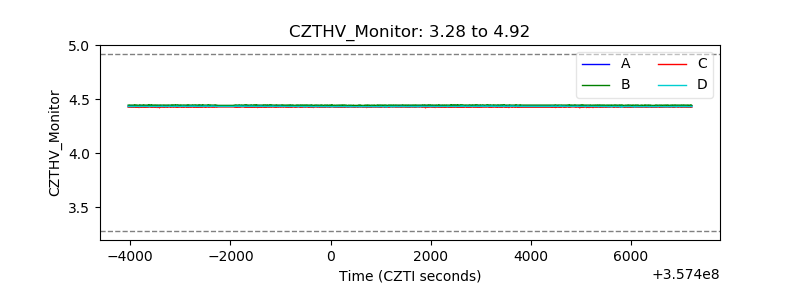 |
| D_VDD | 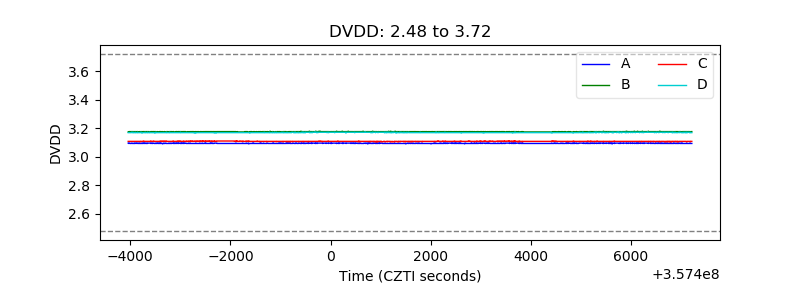 |
| Temperature 1 | 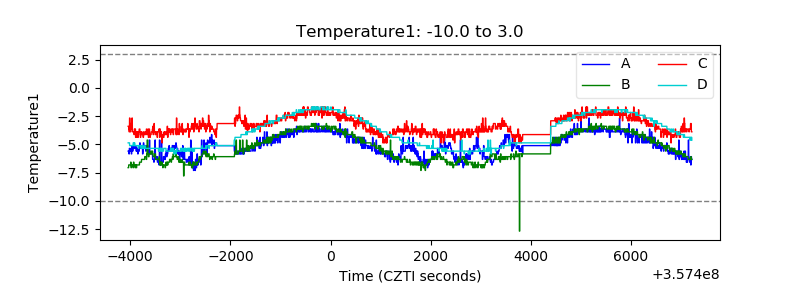 |
| Veto HV Monitor | 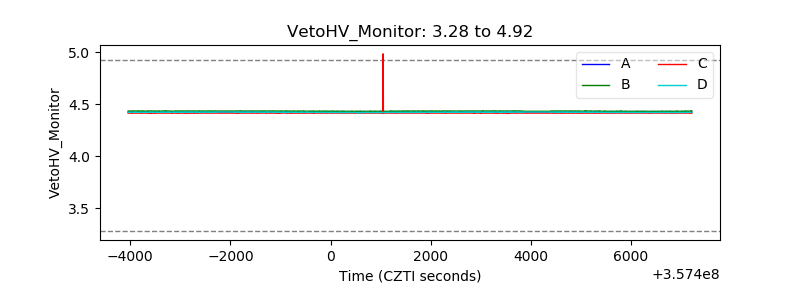 |
| Veto LLD | 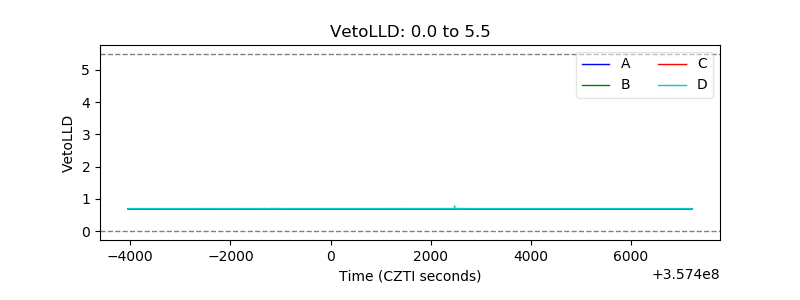 |
| Alpha Counter | 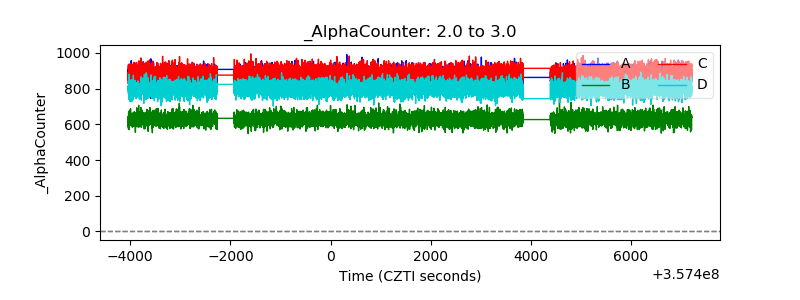 |
| _CPM_Rate | 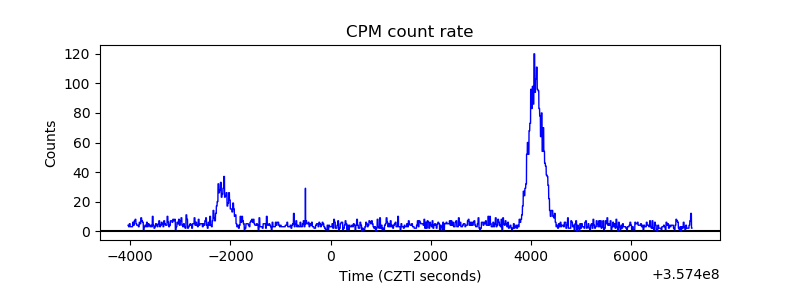 |
| CZT Counter | 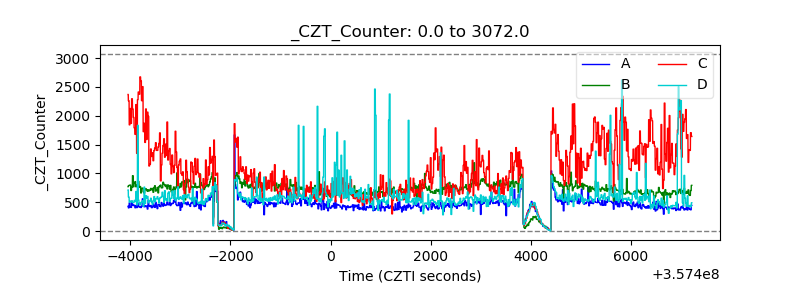 |
| +2.5 Volts monitor | 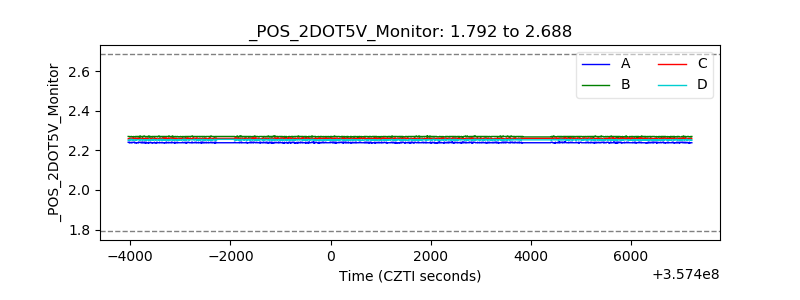 |
| +5 Volts monitor | 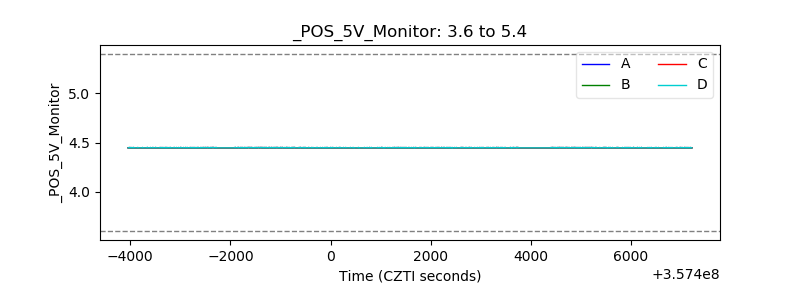 |
| _ROLL_ROT | 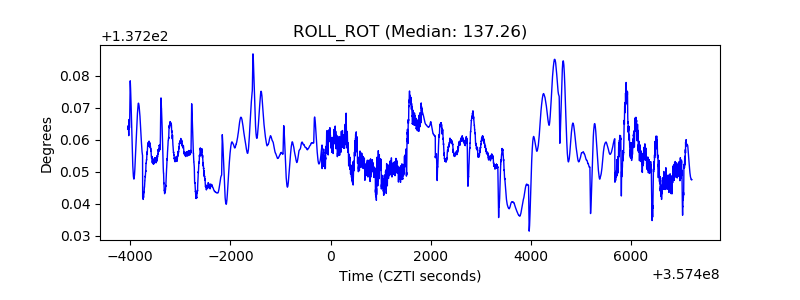 |
| _Roll_DEC |  |
| _Roll_RA | 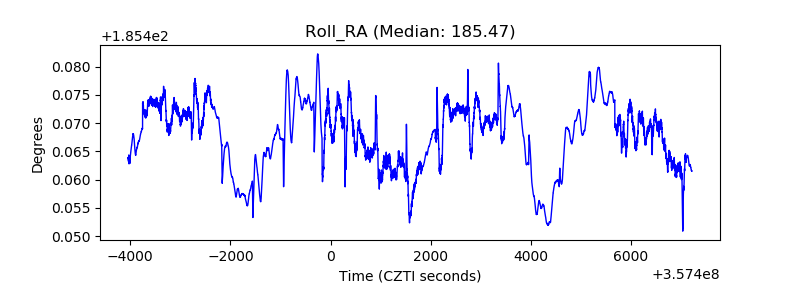 |
| Veto Counter |  |