| Param | Original file | Final file |
|---|---|---|
| Filename | modeM0/AS1A10_071T15_9000004346cztM0_level2.fits | modeM0/AS1A10_071T15_9000004346cztM0_level2_quad_clean.evt |
| Size (bytes) | 554,135,040 | 322,931,520 |
| Size | 528.5 MB | 308.0 MB |
| Events in quadrant A | 3,488,180 | 1,602,584 |
| Events in quadrant B | 3,301,068 | 1,594,585 |
| Events in quadrant C | 3,338,250 | 1,513,300 |
| Events in quadrant D | 2,916,146 | 1,328,623 |
| Mode SS | |||
|---|---|---|---|
| Quadrant | BADHDUFLAG | Total packets | Discarded packets |
| A | 0 | 1112 | 0 |
| B | 0 | 1112 | 0 |
| C | 0 | 1112 | 0 |
| D | 0 | 1112 | 0 |
| Mode M0 | |||
|---|---|---|---|
| Quadrant | BADHDUFLAG | Total packets | Discarded packets |
| A | 0 | 114086 | 0 |
| B | 0 | 165134 | 0 |
| C | 0 | 123200 | 0 |
| D | 0 | 140849 | 0 |
| Mode M9 | |||
|---|---|---|---|
| Quadrant | BADHDUFLAG | Total packets | Discarded packets |
| A | 0 | 104 | 0 |
| B | 0 | 104 | 0 |
| C | 0 | 104 | 0 |
| D | 0 | 104 | 0 |
| Quadrant | Total seconds | Saturated seconds | Saturation percentage |
|---|---|---|---|
| A | 54467 | 742 | 1.362293% |
| B | 54468 | 1284 | 2.357347% |
| C | 54468 | 1995 | 3.662701% |
| D | 54468 | 1839 | 3.376294% |
Noise dominated data is calculated using 1-second bins in cleaned event files. If a bin has >2000 counts, and if more than 50% of those come from <1% of pixels, then it is considered to be noise-dominated and hence unusable.
| Quadrant | # 1 sec bins | Bins with >0 counts | Bins with >2000 counts | High rate bins dominated by noise | Noise dominated (total time) | Noise dominated (detector-on time) | Marked lightcurve |
|---|---|---|---|---|---|---|---|
| A | 68811 | 54466 | 0 | 0 | 0.00% | 0.00% |  |
| B | 68811 | 54466 | 0 | 0 | 0.00% | 0.00% |  |
| C | 68811 | 54465 | 0 | 0 | 0.00% | 0.00% |  |
| D | 68811 | 54449 | 0 | 0 | 0.00% | 0.00% | 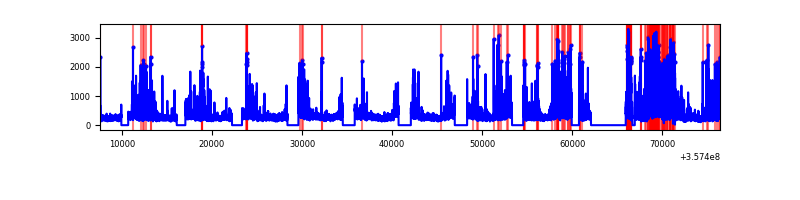 |
Top three noisy pixels from each quadrant. If the there are fewer than three noisy pixels in the level2.evt file, extra rows are filled as -1
| Pixel properties | Quadrant properties | ||||||
|---|---|---|---|---|---|---|---|
| Quadrant | DetID | PixID | Counts | Sigma | Mean | Median | Sigma |
| A | 0 | 29 | 3352 | 11.24 | 908 | 853 | 222.4 |
| A | 7 | 110 | 2715 | 8.37 | 908 | 853 | 222.4 |
| A | 9 | 19 | 2596 | 7.84 | 908 | 853 | 222.4 |
| B | 2 | 9 | 2643 | 10.28 | 872 | 832 | 176.1 |
| B | 5 | 128 | 2266 | 8.14 | 872 | 832 | 176.1 |
| B | 2 | 8 | 2262 | 8.12 | 872 | 832 | 176.1 |
| C | 12 | 241 | 2296 | 6.5 | 883 | 825 | 226.4 |
| C | 9 | 209 | 2289 | 6.47 | 883 | 825 | 226.4 |
| C | 3 | 126 | 2199 | 6.07 | 883 | 825 | 226.4 |
| D | 15 | 46 | 2290 | 6.93 | 832 | 759 | 220.9 |
| D | 3 | 14 | 2054 | 5.86 | 832 | 759 | 220.9 |
| D | 7 | 3 | 2010 | 5.66 | 832 | 759 | 220.9 |
Histogram calculated using DETX and DETY for each event in the final _common_clean file
| Quadrant A |  |
 |
Quadrant B |
|---|---|---|---|
| Quadrant D |  |
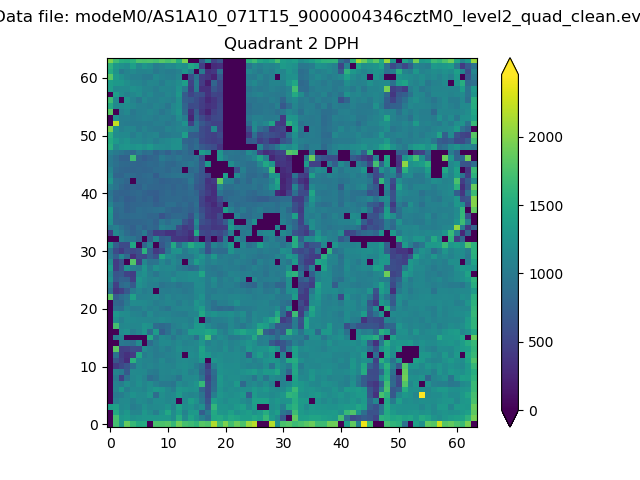 |
Quadrant C |
| Plot type | Count rate plots | Images |
|---|---|---|
| Comparison with Poisson distribution Blue bars denote a histogram of data divided into 1 sec bins. Red curve is a Poisson curve with rate = median count rate of data. |
 |
 |
| Quadrant-wise count rates Data is divided into 100 sec bins |
 |
|
| Module-wise count rates for Quadrant A Data is divided into 100 sec bins |
 |
 |
| Module-wise count rates for Quadrant B Data is divided into 100 sec bins |
 |
 |
| Module-wise count rates for Quadrant C Data is divided into 100 sec bins |
 |
 |
| Module-wise count rates for Quadrant D Data is divided into 100 sec bins |
 |
 |
| Parameter | Plot |
|---|---|
| CZT HV Monitor |  |
| D_VDD | 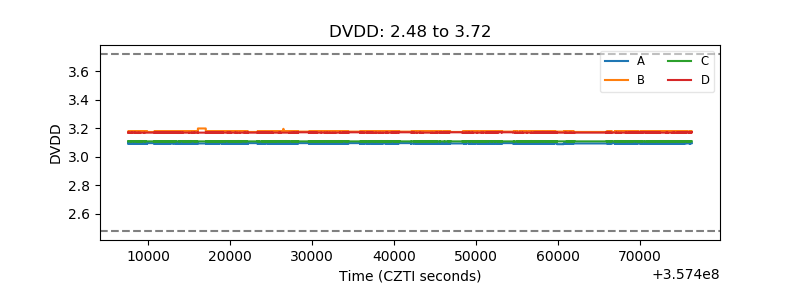 |
| Temperature 1 |  |
| Veto HV Monitor |  |
| Veto LLD |  |
| Alpha Counter |  |
| _CPM_Rate |  |
| CZT Counter | 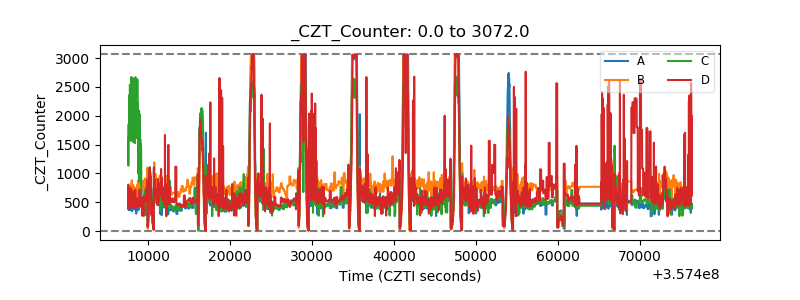 |
| +2.5 Volts monitor |  |
| +5 Volts monitor |  |
| _ROLL_ROT |  |
| _Roll_DEC | 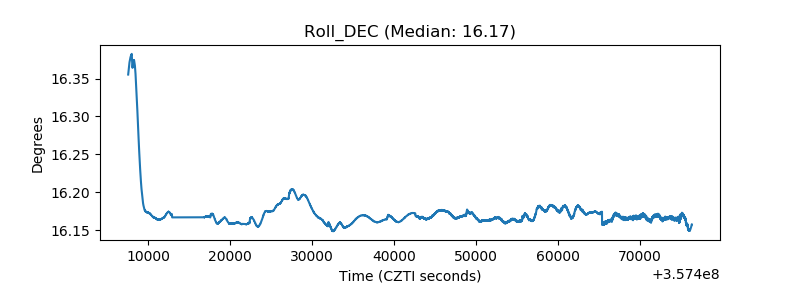 |
| _Roll_RA |  |
| Veto Counter |  |