| Param | Original file | Final file |
|---|---|---|
| Filename | modeM0/AS1A10_071T15_9000004346_30203cztM0_level2.evt | modeM0/AS1A10_071T15_9000004346_30203cztM0_level2_quad_clean.evt |
| Size (bytes) | 384,978,240 | 44,962,560 |
| Size | 367.1 MB | 42.9 MB |
| Events in quadrant A | 1,901,521 | 282,746 |
| Events in quadrant B | 2,914,486 | 282,995 |
| Events in quadrant C | 4,407,383 | 252,752 |
| Events in quadrant D | 2,173,991 | 270,864 |
| Mode SS | |||
|---|---|---|---|
| Quadrant | BADHDUFLAG | Total packets | Discarded packets |
| A | 0 | 78 | 0 |
| B | 0 | 78 | 0 |
| C | 0 | 78 | 0 |
| D | 0 | 78 | 0 |
| Mode M0 | |||
|---|---|---|---|
| Quadrant | BADHDUFLAG | Total packets | Discarded packets |
| A | 0 | 8032 | 1 |
| B | 0 | 11633 | 1 |
| C | 0 | 15428 | 1 |
| D | 0 | 8840 | 1 |
| Mode M9 | |||
|---|---|---|---|
| Quadrant | BADHDUFLAG | Total packets | Discarded packets |
| A | 0 | 8 | 0 |
| B | 0 | 8 | 0 |
| C | 0 | 8 | 0 |
| D | 0 | 8 | 0 |
| Quadrant | Total seconds | Saturated seconds | Saturation percentage |
|---|---|---|---|
| A | 3848 | 44 | 1.143451% |
| B | 3848 | 98 | 2.546778% |
| C | 3847 | 1027 | 26.696127% |
| D | 3847 | 43 | 1.117754% |
Noise dominated data is calculated using 1-second bins in cleaned event files. If a bin has >2000 counts, and if more than 50% of those come from <1% of pixels, then it is considered to be noise-dominated and hence unusable.
| Quadrant | # 1 sec bins | Bins with >0 counts | Bins with >2000 counts | High rate bins dominated by noise | Noise dominated (total time) | Noise dominated (detector-on time) | Marked lightcurve |
|---|---|---|---|---|---|---|---|
| A | 4613 | 3849 | 0 | 0 | 0.00% | 0.00% | 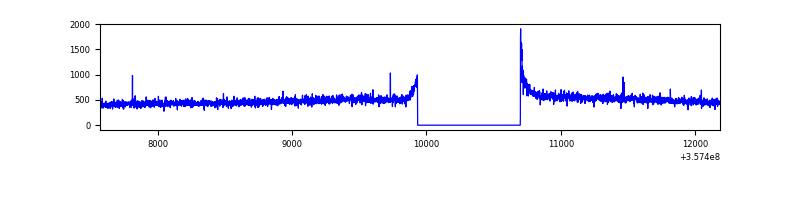 |
| B | 4613 | 3849 | 0 | 0 | 0.00% | 0.00% | 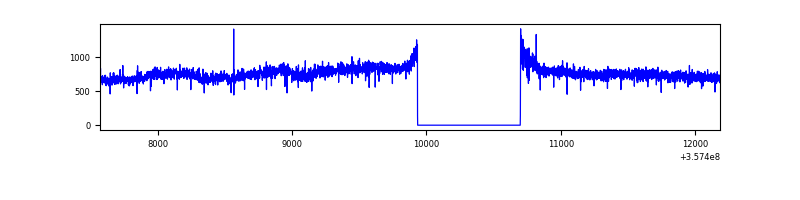 |
| C | 4612 | 3848 | 864 | 864 | 18.73% | 22.45% | 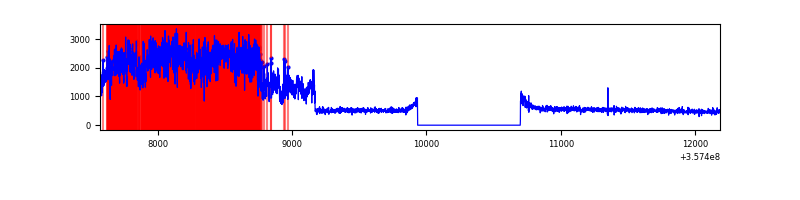 |
| D | 4612 | 3848 | 12 | 12 | 0.26% | 0.31% | 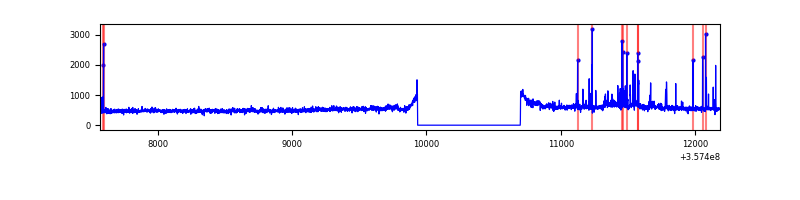 |
Top three noisy pixels from each quadrant. If the there are fewer than three noisy pixels in the level2.evt file, extra rows are filled as -1
| Pixel properties | Quadrant properties | ||||||
|---|---|---|---|---|---|---|---|
| Quadrant | DetID | PixID | Counts | Sigma | Mean | Median | Sigma |
| A | 8 | 192 | 11452 | 109.97 | 488 | 476 | 99.8 |
| A | 13 | 254 | 6746 | 62.82 | 488 | 476 | 99.8 |
| A | 3 | 1 | 6585 | 61.21 | 488 | 476 | 99.8 |
| B | 6 | 159 | 1018815 | 10662.64 | 481 | 467 | 95.5 |
| B | 12 | 111 | 11976 | 120.51 | 481 | 467 | 95.5 |
| B | 11 | 111 | 11233 | 112.73 | 481 | 467 | 95.5 |
| C | 3 | 233 | 2614520 | 24926.55 | 440 | 443 | 104.9 |
| C | 14 | 238 | 69714 | 660.53 | 440 | 443 | 104.9 |
| C | 2 | 114 | 8476 | 76.6 | 440 | 443 | 104.9 |
| D | 8 | 195 | 151984 | 1316.67 | 470 | 459 | 115.1 |
| D | 7 | 223 | 151924 | 1316.15 | 470 | 459 | 115.1 |
| D | 2 | 250 | 52212 | 449.7 | 470 | 459 | 115.1 |
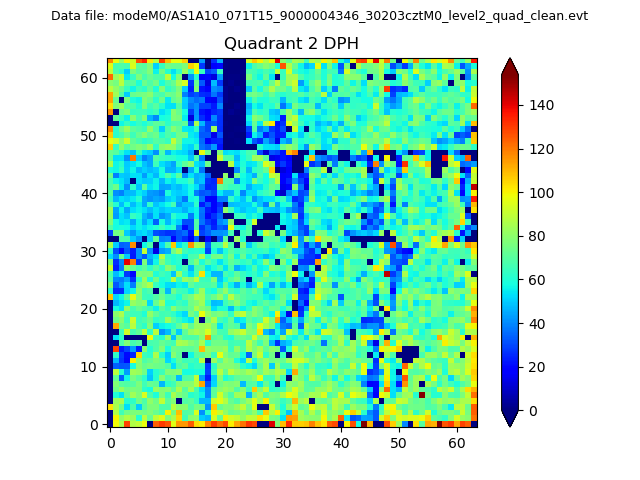
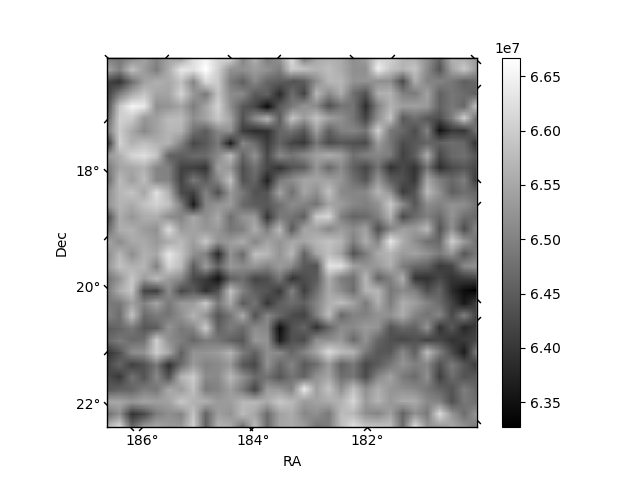
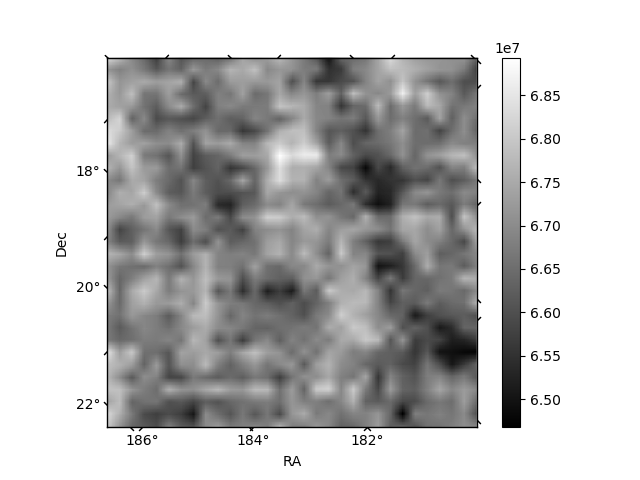
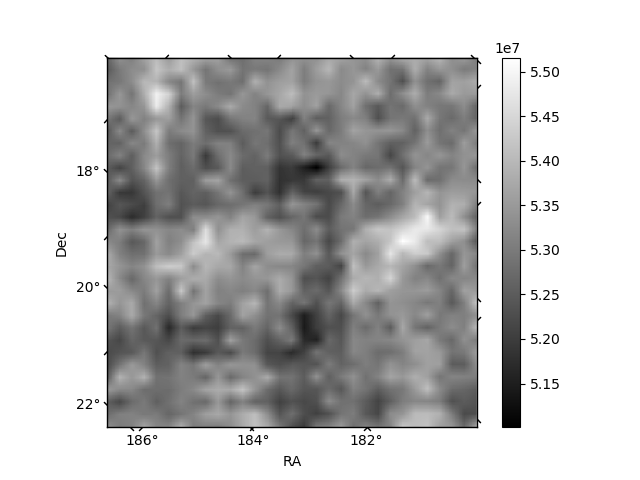
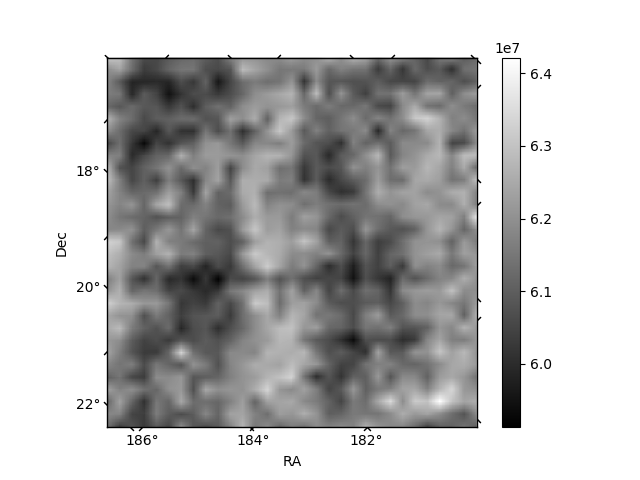
Histogram calculated using DETX and DETY for each event in the final _common_clean file
| Quadrant A | 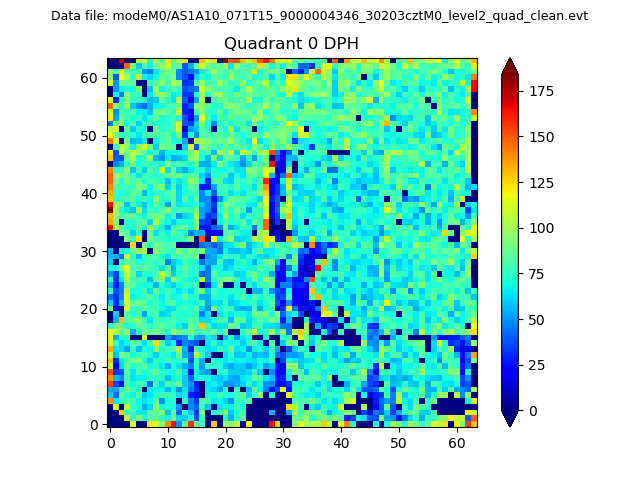 |
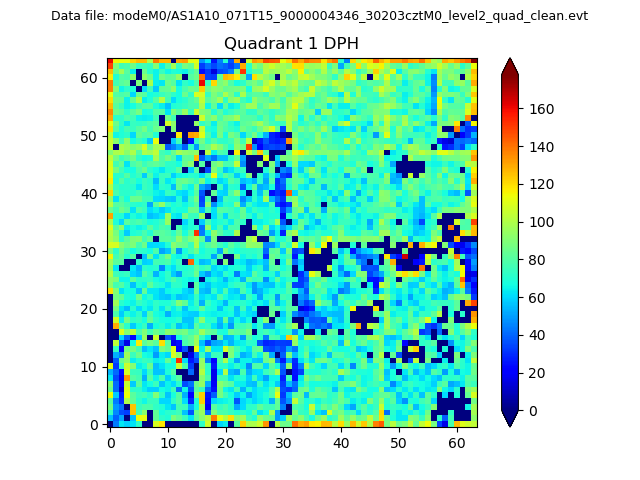 |
Quadrant B |
|---|---|---|---|
| Quadrant D | 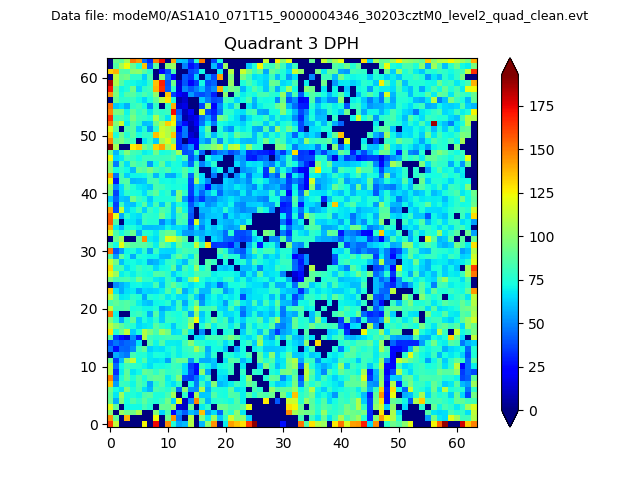 |
 |
Quadrant C |
| Plot type | Count rate plots | Images |
|---|---|---|
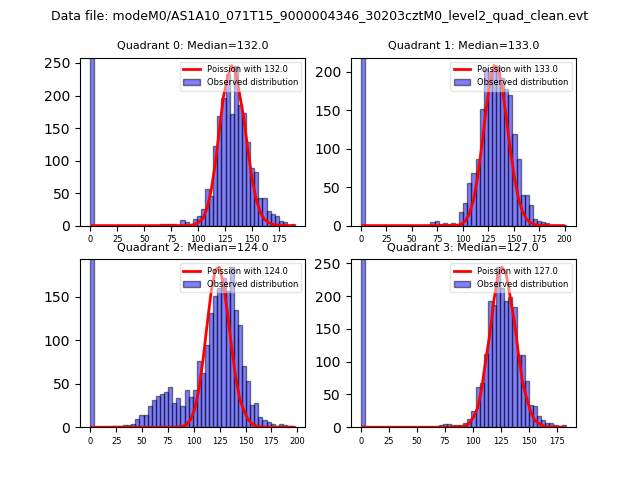
| Comparison with Poisson distribution Blue bars denote a histogram of data divided into 1 sec bins. Red curve is a Poisson curve with rate = median count rate of data. |
 |
 |
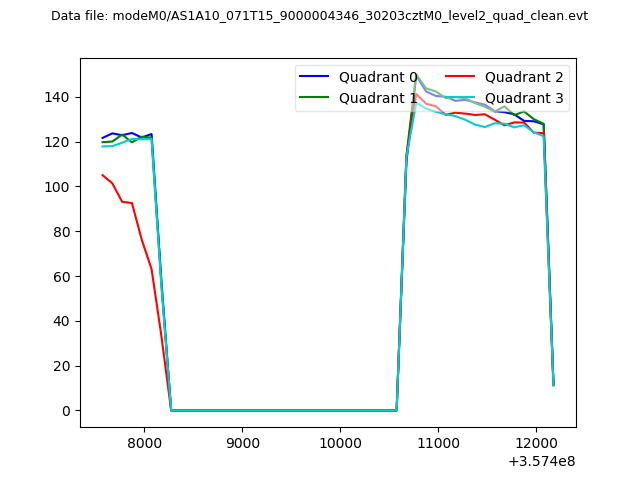
| Quadrant-wise count rates Data is divided into 100 sec bins |
 |
|
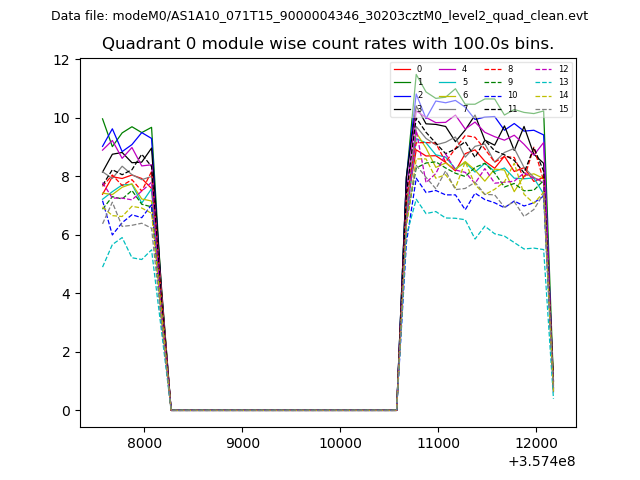
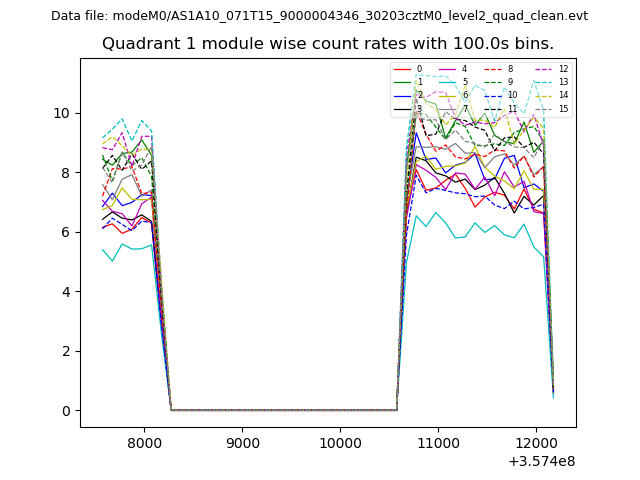
| Module-wise count rates for Quadrant A Data is divided into 100 sec bins |
 |
 |
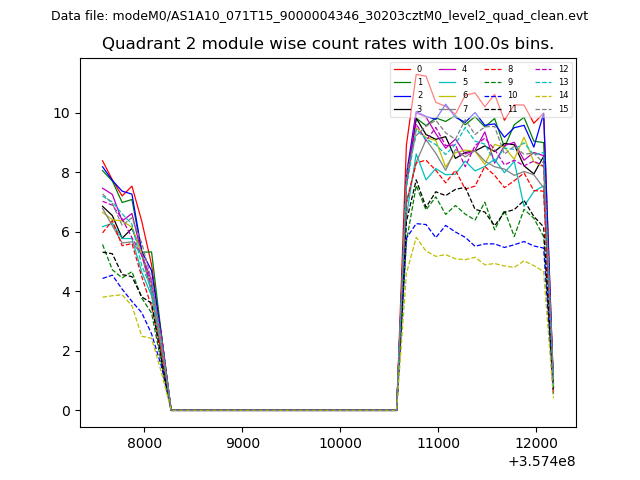
| Module-wise count rates for Quadrant B Data is divided into 100 sec bins |
 |
 |
| Module-wise count rates for Quadrant C Data is divided into 100 sec bins |
 |
 |
| Module-wise count rates for Quadrant D Data is divided into 100 sec bins |
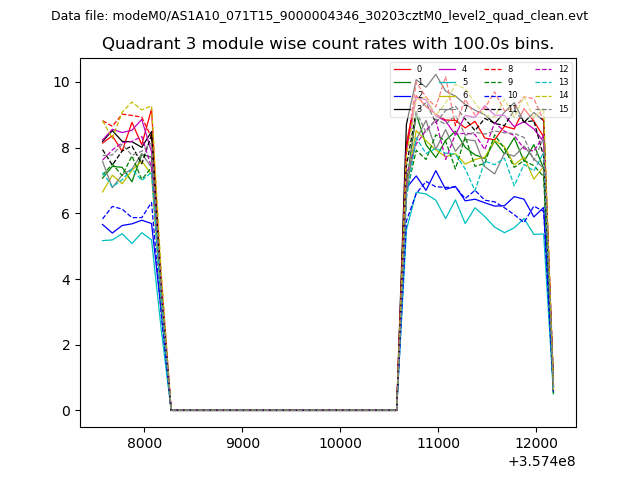 |
 |
| Parameter | Plot |
|---|---|
| CZT HV Monitor | 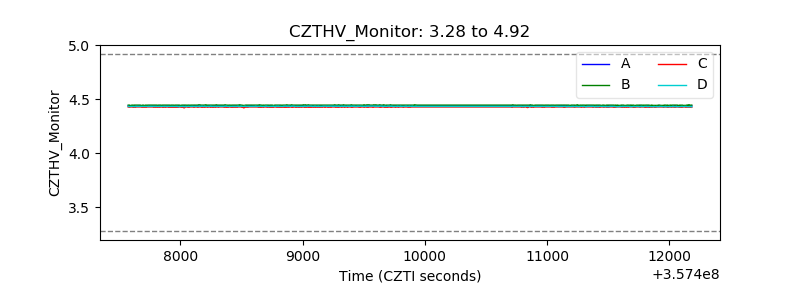 |
| D_VDD | 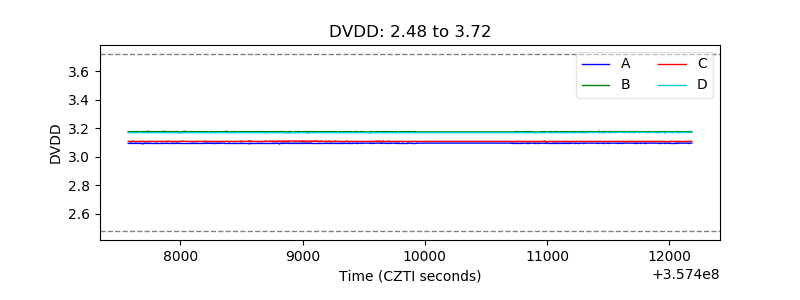 |
| Temperature 1 | 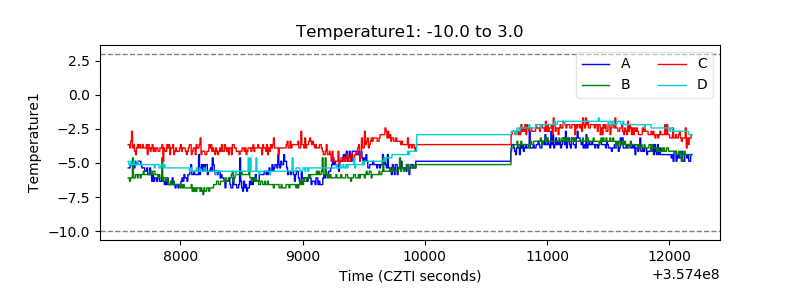 |
| Veto HV Monitor | 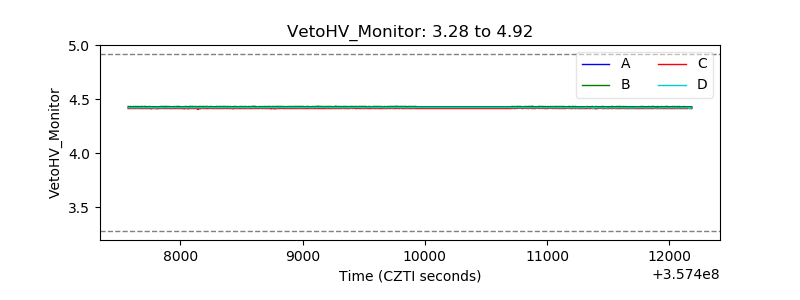 |
| Veto LLD |  |
| Alpha Counter | 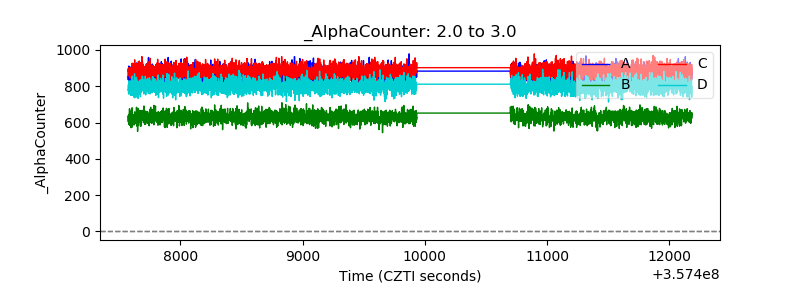 |
| _CPM_Rate | 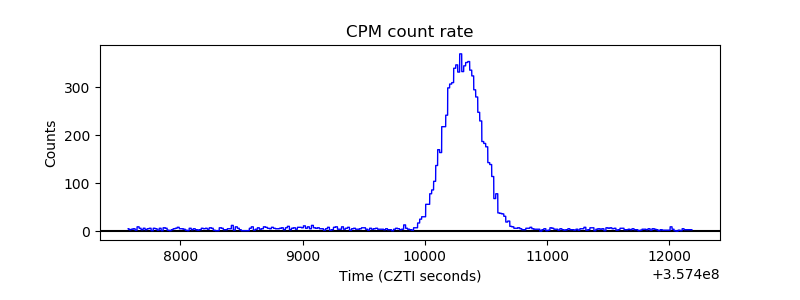 |
| CZT Counter | 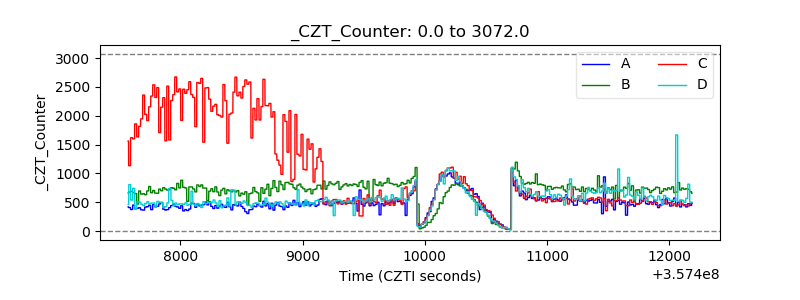 |
| +2.5 Volts monitor |  |
| +5 Volts monitor | 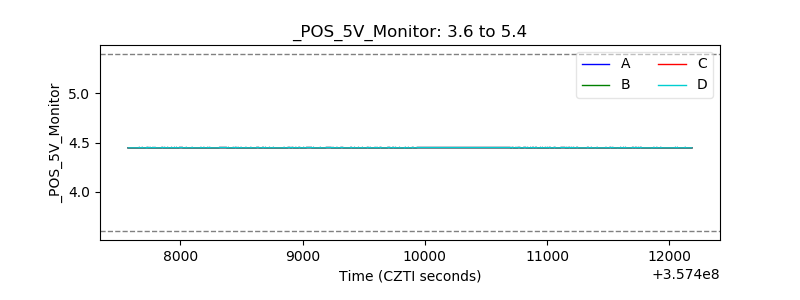 |
| _ROLL_ROT | 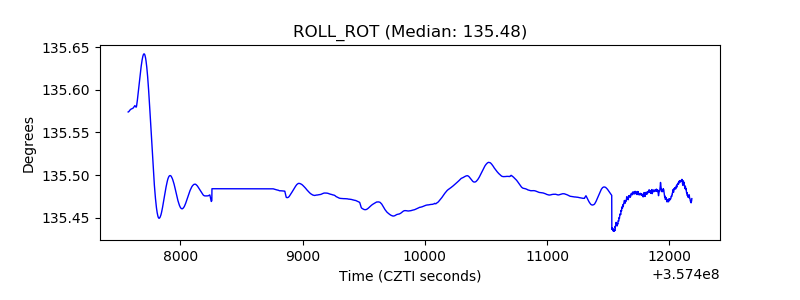 |
| _Roll_DEC | 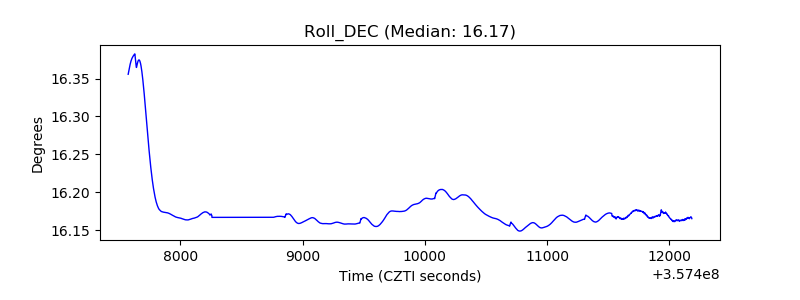 |
| _Roll_RA | 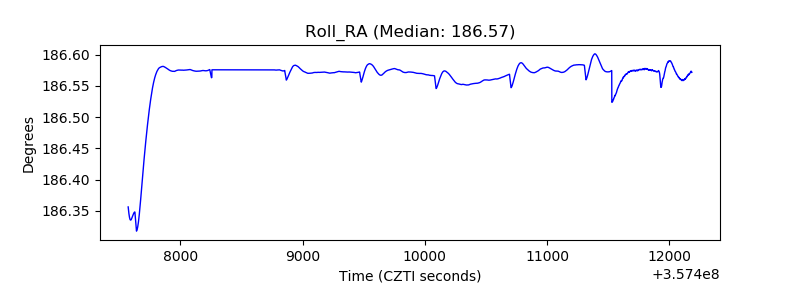 |
| Veto Counter | 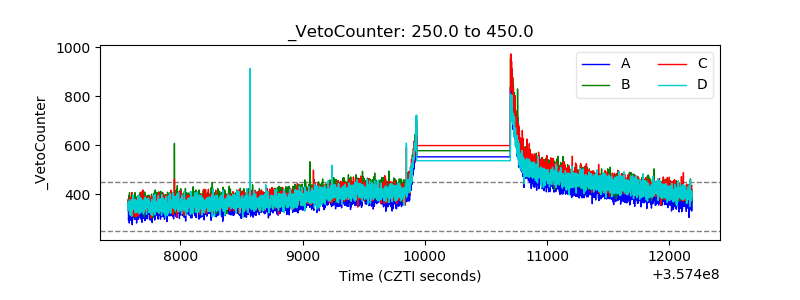 |