| Param | Original file | Final file |
|---|---|---|
| Filename | modeM0/AS1A10_071T15_9000004346_30204cztM0_level2.evt | modeM0/AS1A10_071T15_9000004346_30204cztM0_level2_quad_clean.evt |
| Size (bytes) | 505,330,560 | 91,604,160 |
| Size | 481.9 MB | 87.4 MB |
| Events in quadrant A | 3,087,862 | 592,067 |
| Events in quadrant B | 4,810,699 | 592,482 |
| Events in quadrant C | 3,154,861 | 572,856 |
| Events in quadrant D | 3,810,939 | 564,523 |
| Mode SS | |||
|---|---|---|---|
| Quadrant | BADHDUFLAG | Total packets | Discarded packets |
| A | 0 | 132 | 0 |
| B | 0 | 132 | 0 |
| C | 0 | 132 | 0 |
| D | 0 | 132 | 0 |
| Mode M0 | |||
|---|---|---|---|
| Quadrant | BADHDUFLAG | Total packets | Discarded packets |
| A | 0 | 13404 | 1 |
| B | 0 | 19466 | 2 |
| C | 0 | 13497 | 1 |
| D | 0 | 15419 | 1 |
| Mode M9 | |||
|---|---|---|---|
| Quadrant | BADHDUFLAG | Total packets | Discarded packets |
| A | 0 | 9 | 0 |
| B | 0 | 9 | 0 |
| C | 0 | 9 | 0 |
| D | 0 | 9 | 0 |
| Quadrant | Total seconds | Saturated seconds | Saturation percentage |
|---|---|---|---|
| A | 6482 | 39 | 0.601666% |
| B | 6482 | 84 | 1.295896% |
| C | 6482 | 85 | 1.311324% |
| D | 6482 | 72 | 1.110768% |
Noise dominated data is calculated using 1-second bins in cleaned event files. If a bin has >2000 counts, and if more than 50% of those come from <1% of pixels, then it is considered to be noise-dominated and hence unusable.
| Quadrant | # 1 sec bins | Bins with >0 counts | Bins with >2000 counts | High rate bins dominated by noise | Noise dominated (total time) | Noise dominated (detector-on time) | Marked lightcurve |
|---|---|---|---|---|---|---|---|
| A | 7447 | 6483 | 1 | 1 | 0.01% | 0.02% | 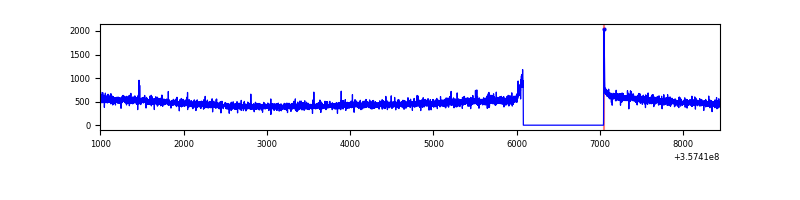 |
| B | 7447 | 6483 | 0 | 0 | 0.00% | 0.00% | 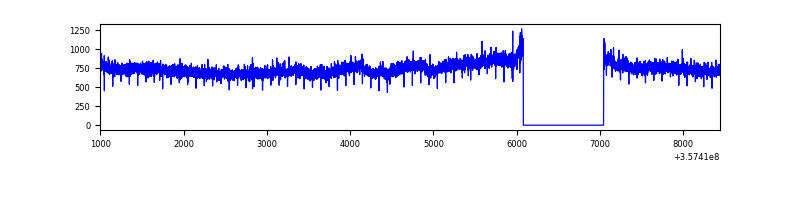 |
| C | 7447 | 6482 | 0 | 0 | 0.00% | 0.00% |  |
| D | 7447 | 6483 | 38 | 38 | 0.51% | 0.59% | 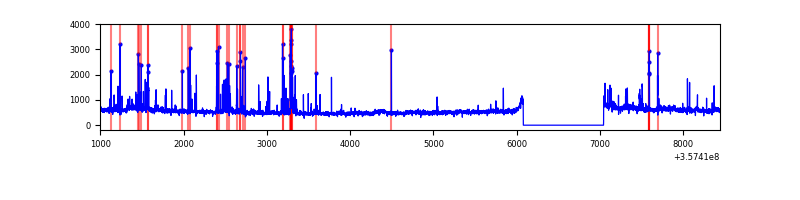 |
Top three noisy pixels from each quadrant. If the there are fewer than three noisy pixels in the level2.evt file, extra rows are filled as -1
| Pixel properties | Quadrant properties | ||||||
|---|---|---|---|---|---|---|---|
| Quadrant | DetID | PixID | Counts | Sigma | Mean | Median | Sigma |
| A | 8 | 192 | 12124 | 69.9 | 794 | 776 | 162.4 |
| A | 13 | 254 | 11714 | 67.37 | 794 | 776 | 162.4 |
| A | 3 | 137 | 8258 | 46.08 | 794 | 776 | 162.4 |
| B | 6 | 159 | 1734554 | 11456.63 | 782 | 761 | 151.3 |
| B | 12 | 111 | 19102 | 121.19 | 782 | 761 | 151.3 |
| B | 11 | 111 | 17648 | 111.59 | 782 | 761 | 151.3 |
| C | 14 | 238 | 122571 | 676.36 | 765 | 770 | 180.1 |
| C | 10 | 22 | 23632 | 126.95 | 765 | 770 | 180.1 |
| C | 2 | 114 | 14797 | 77.89 | 765 | 770 | 180.1 |
| D | 7 | 223 | 293195 | 1524.45 | 768 | 749 | 191.8 |
| D | 8 | 195 | 266107 | 1383.25 | 768 | 749 | 191.8 |
| D | 13 | 104 | 158771 | 823.73 | 768 | 749 | 191.8 |
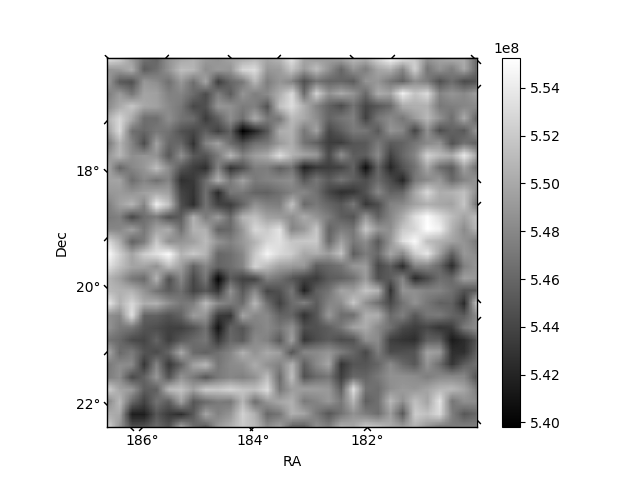
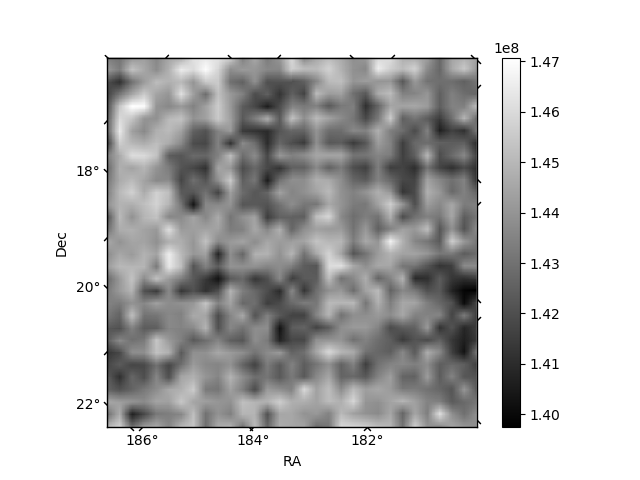
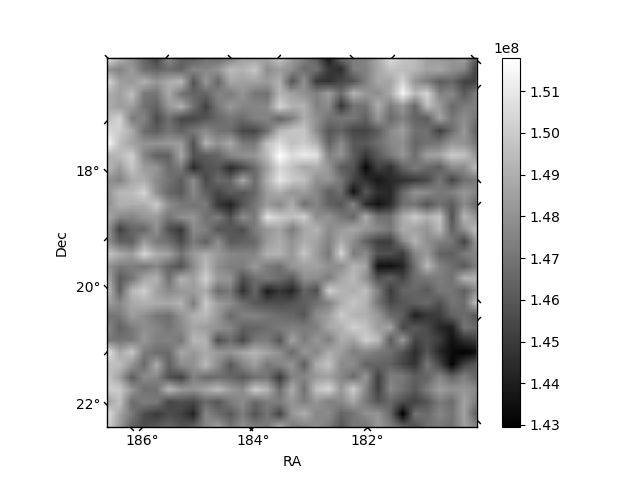
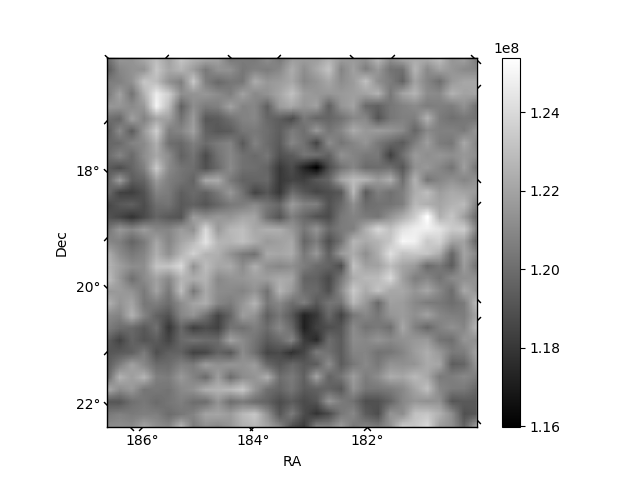
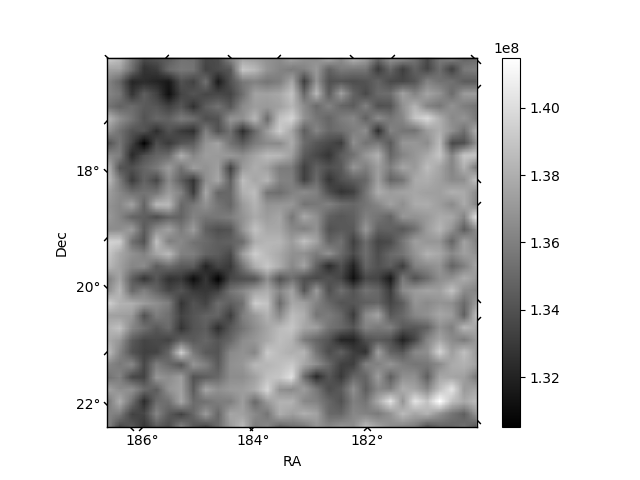
Histogram calculated using DETX and DETY for each event in the final _common_clean file
| Quadrant A | 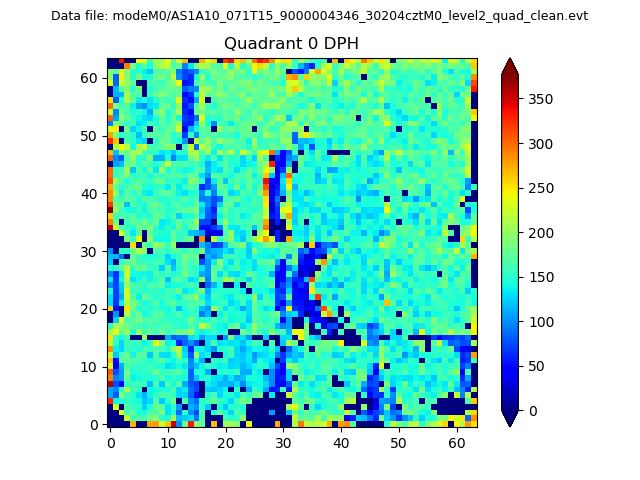 |
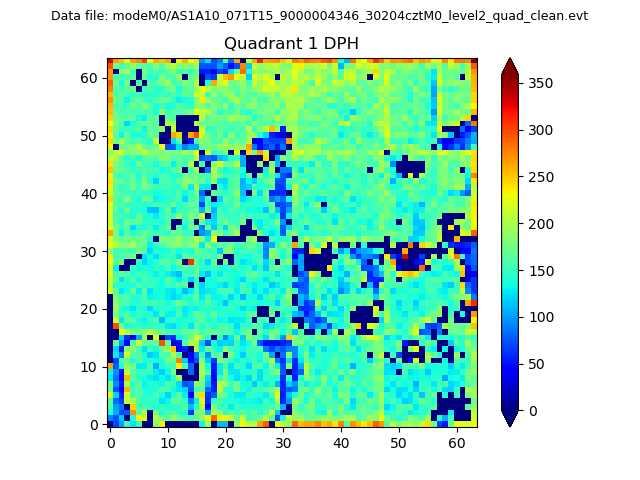 |
Quadrant B |
|---|---|---|---|
| Quadrant D | 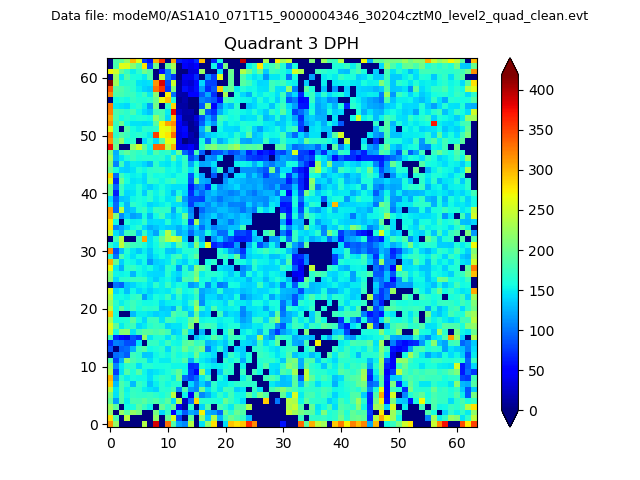 |
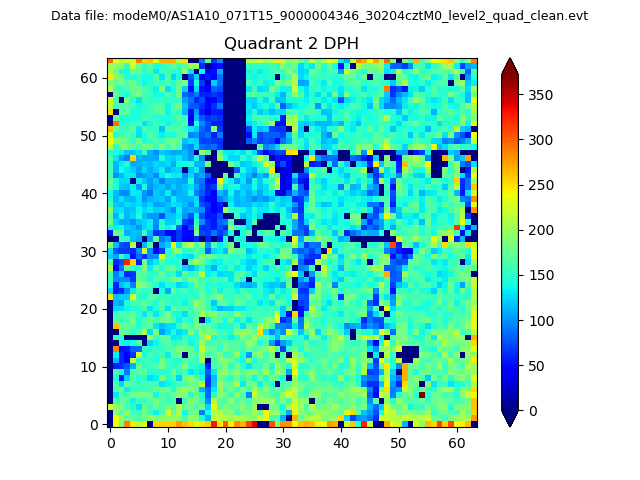 |
Quadrant C |
| Plot type | Count rate plots | Images |
|---|---|---|
| Comparison with Poisson distribution Blue bars denote a histogram of data divided into 1 sec bins. Red curve is a Poisson curve with rate = median count rate of data. |
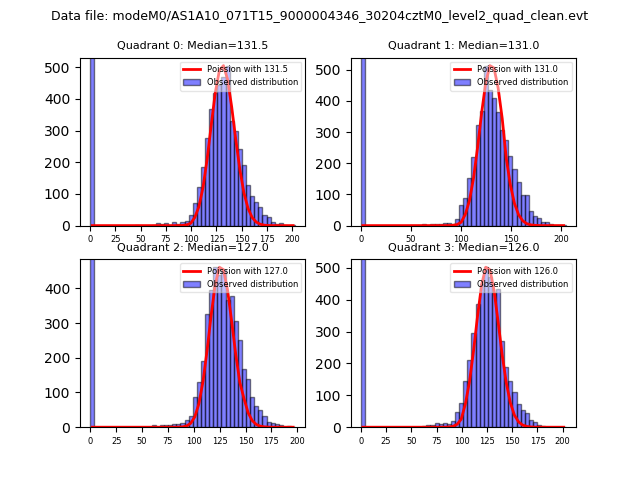 |
 |
| Quadrant-wise count rates Data is divided into 100 sec bins |
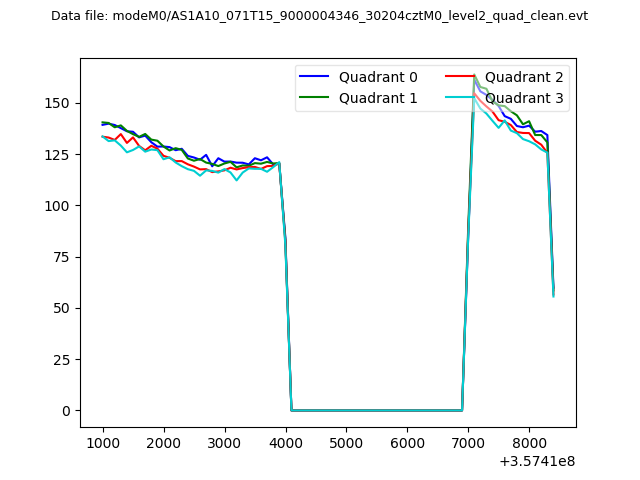 |
|
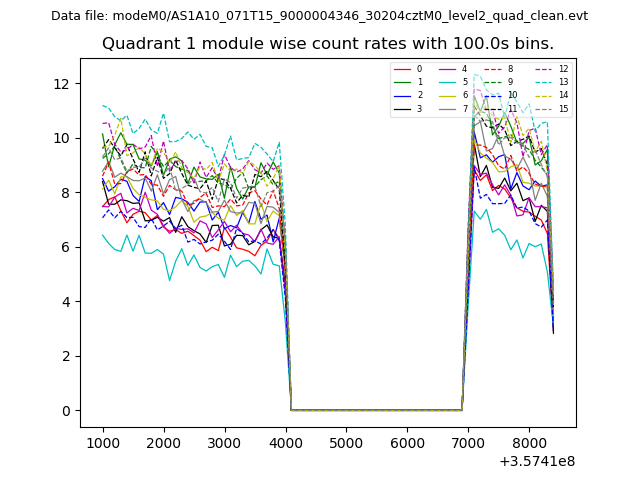
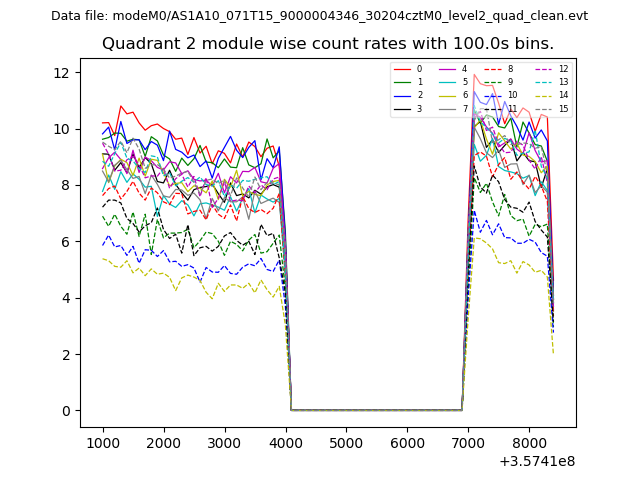
| Module-wise count rates for Quadrant A Data is divided into 100 sec bins |
 |
 |
| Module-wise count rates for Quadrant B Data is divided into 100 sec bins |
 |
 |
| Module-wise count rates for Quadrant C Data is divided into 100 sec bins |
 |
 |
| Module-wise count rates for Quadrant D Data is divided into 100 sec bins |
 |
 |
| Parameter | Plot |
|---|---|
| CZT HV Monitor | 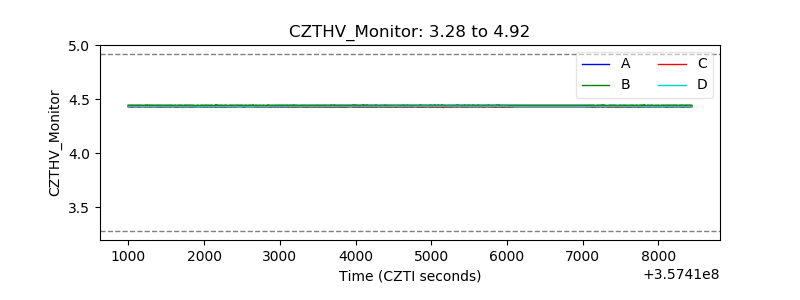 |
| D_VDD | 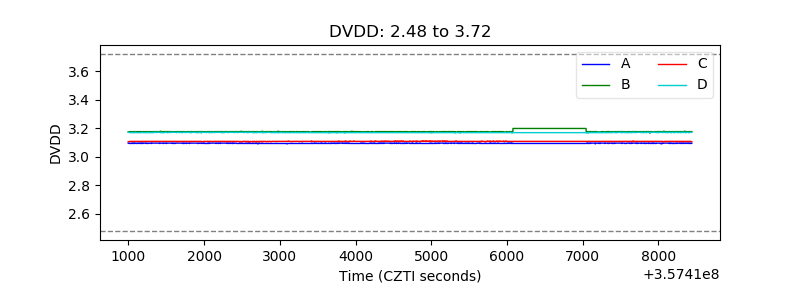 |
| Temperature 1 | 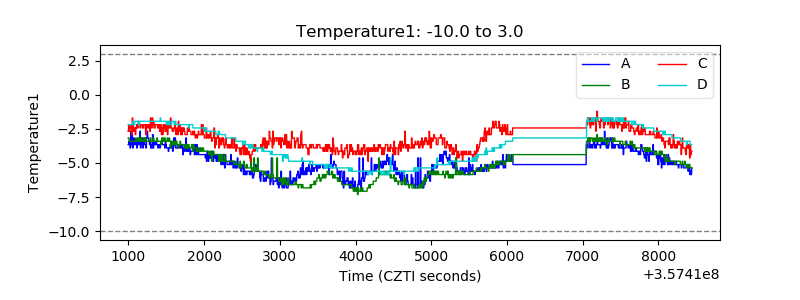 |
| Veto HV Monitor | 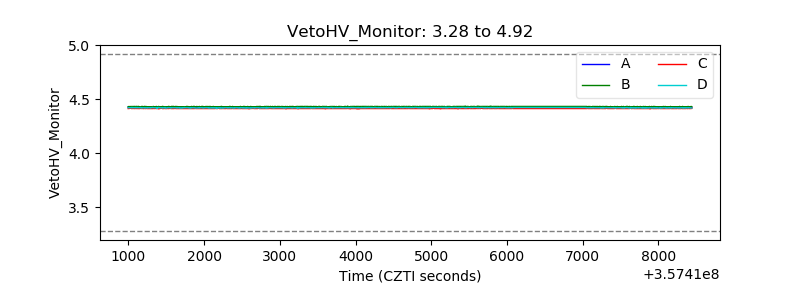 |
| Veto LLD | 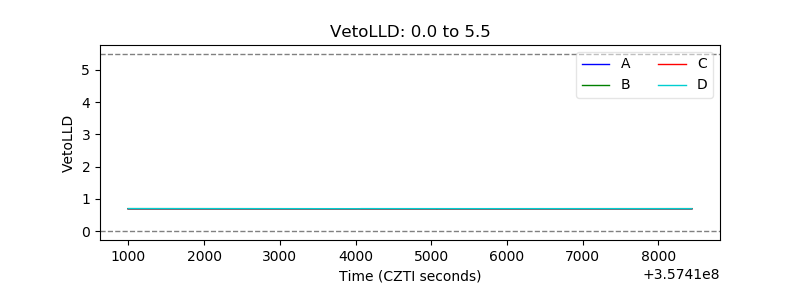 |
| Alpha Counter | 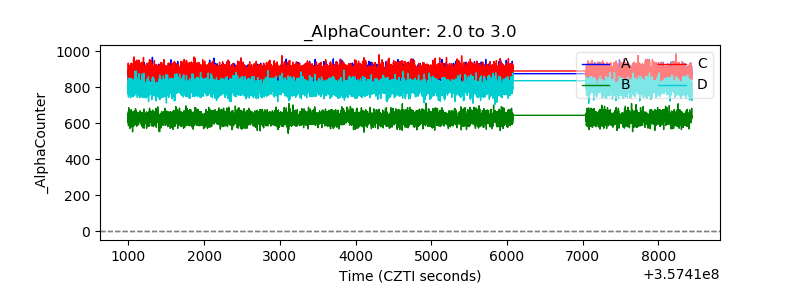 |
| _CPM_Rate | 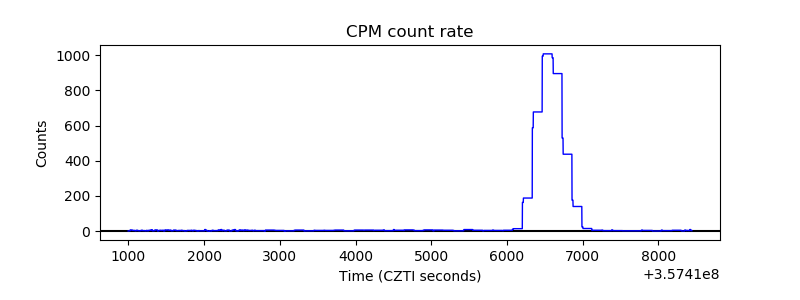 |
| CZT Counter | 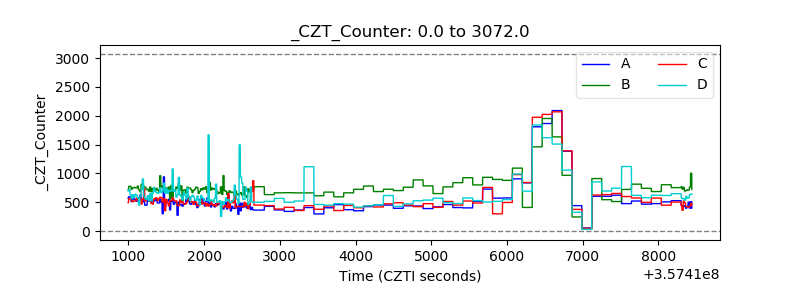 |
| +2.5 Volts monitor | 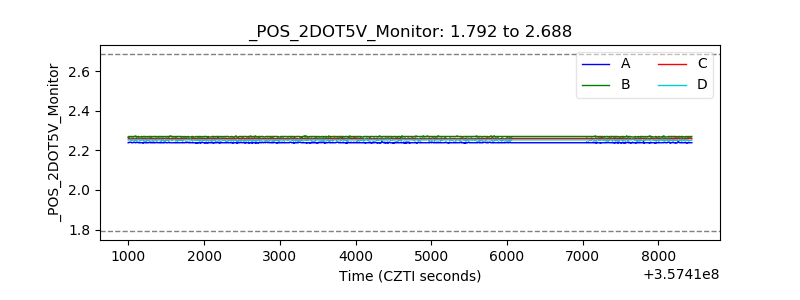 |
| +5 Volts monitor |  |
| _ROLL_ROT | 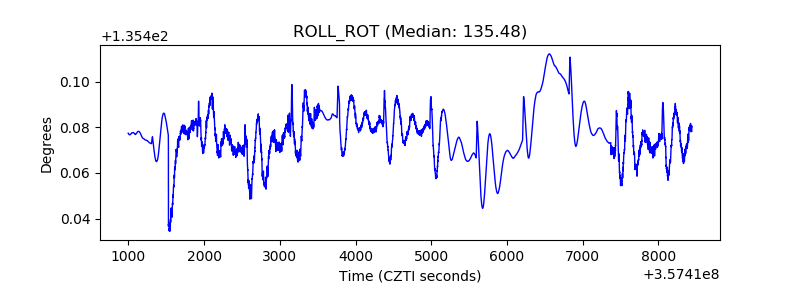 |
| _Roll_DEC | 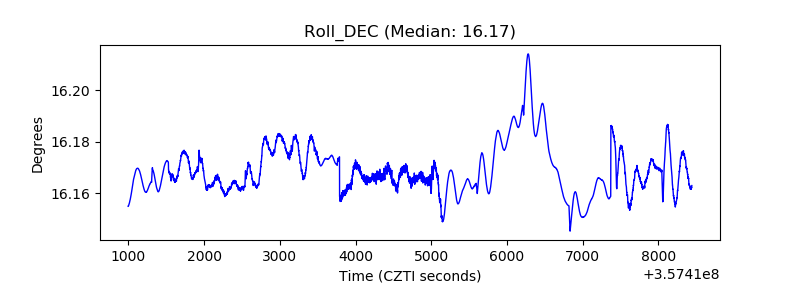 |
| _Roll_RA | 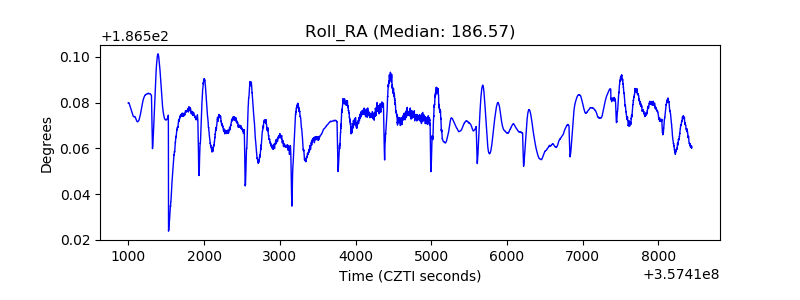 |
| Veto Counter | 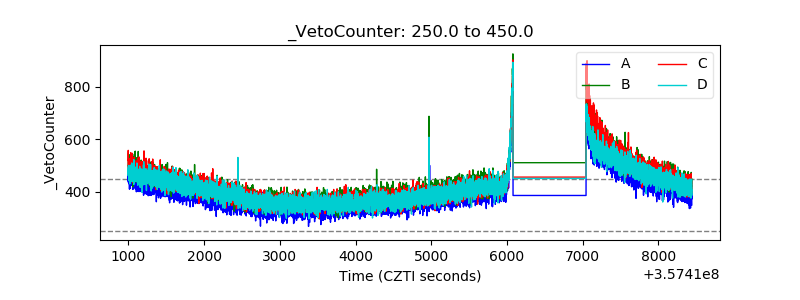 |