| Param | Original file | Final file |
|---|---|---|
| Filename | modeM0/AS1A10_071T15_9000004346_30206cztM0_level2.evt | modeM0/AS1A10_071T15_9000004346_30206cztM0_level2_quad_clean.evt |
| Size (bytes) | 520,107,840 | 92,592,000 |
| Size | 496.0 MB | 88.3 MB |
| Events in quadrant A | 3,163,732 | 599,475 |
| Events in quadrant B | 4,915,361 | 603,880 |
| Events in quadrant C | 3,242,251 | 581,461 |
| Events in quadrant D | 3,991,694 | 567,890 |
| Mode SS | |||
|---|---|---|---|
| Quadrant | BADHDUFLAG | Total packets | Discarded packets |
| A | 0 | 132 | 0 |
| B | 0 | 132 | 0 |
| C | 0 | 132 | 0 |
| D | 0 | 132 | 0 |
| Mode M0 | |||
|---|---|---|---|
| Quadrant | BADHDUFLAG | Total packets | Discarded packets |
| A | 0 | 13633 | 2 |
| B | 0 | 19488 | 2 |
| C | 0 | 13854 | 2 |
| D | 0 | 16271 | 2 |
| Mode M9 | |||
|---|---|---|---|
| Quadrant | BADHDUFLAG | Total packets | Discarded packets |
| A | 0 | 14 | 0 |
| B | 0 | 15 | 0 |
| C | 0 | 15 | 0 |
| D | 0 | 15 | 0 |
| Quadrant | Total seconds | Saturated seconds | Saturation percentage |
|---|---|---|---|
| A | 6469 | 65 | 1.004792% |
| B | 6468 | 78 | 1.205937% |
| C | 6468 | 99 | 1.530612% |
| D | 6468 | 84 | 1.298701% |
Noise dominated data is calculated using 1-second bins in cleaned event files. If a bin has >2000 counts, and if more than 50% of those come from <1% of pixels, then it is considered to be noise-dominated and hence unusable.
| Quadrant | # 1 sec bins | Bins with >0 counts | Bins with >2000 counts | High rate bins dominated by noise | Noise dominated (total time) | Noise dominated (detector-on time) | Marked lightcurve |
|---|---|---|---|---|---|---|---|
| A | 7574 | 6470 | 2 | 2 | 0.03% | 0.03% | 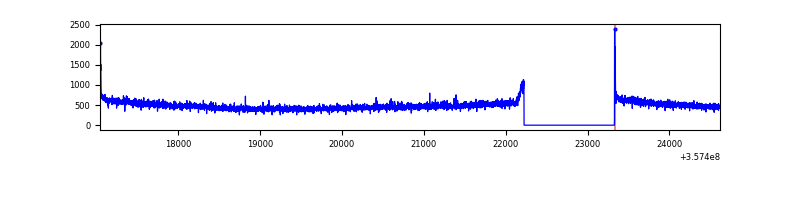 |
| B | 7573 | 6468 | 0 | 0 | 0.00% | 0.00% | 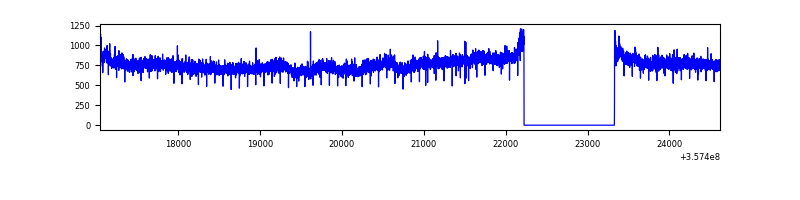 |
| C | 7573 | 6469 | 1 | 1 | 0.01% | 0.02% | 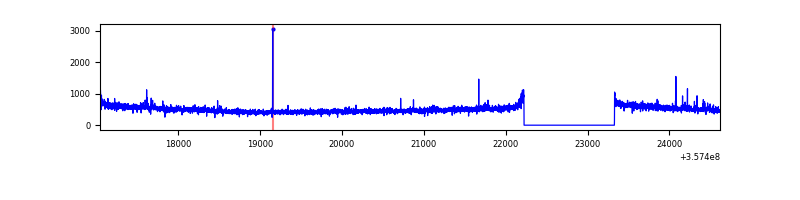 |
| D | 7573 | 6469 | 68 | 68 | 0.90% | 1.05% | 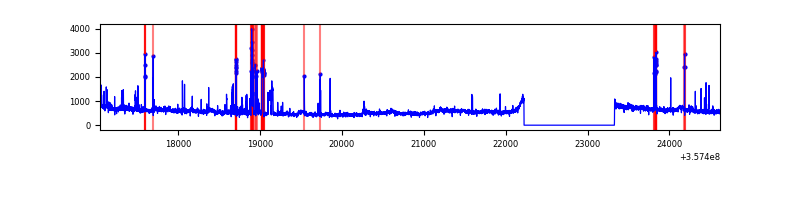 |
Top three noisy pixels from each quadrant. If the there are fewer than three noisy pixels in the level2.evt file, extra rows are filled as -1
| Pixel properties | Quadrant properties | ||||||
|---|---|---|---|---|---|---|---|
| Quadrant | DetID | PixID | Counts | Sigma | Mean | Median | Sigma |
| A | 8 | 192 | 24281 | 143.94 | 812 | 796 | 163.2 |
| A | 13 | 254 | 11163 | 63.54 | 812 | 796 | 163.2 |
| A | 3 | 137 | 8297 | 45.97 | 812 | 796 | 163.2 |
| B | 6 | 159 | 1761116 | 11436.28 | 803 | 783 | 153.9 |
| B | 12 | 111 | 19179 | 119.51 | 803 | 783 | 153.9 |
| B | 11 | 111 | 17546 | 108.9 | 803 | 783 | 153.9 |
| C | 14 | 238 | 129414 | 699.09 | 784 | 789 | 184.0 |
| C | 10 | 22 | 24834 | 130.69 | 784 | 789 | 184.0 |
| C | 2 | 114 | 15171 | 78.17 | 784 | 789 | 184.0 |
| D | 8 | 195 | 333053 | 1700.03 | 784 | 767 | 195.5 |
| D | 7 | 223 | 269800 | 1376.42 | 784 | 767 | 195.5 |
| D | 13 | 104 | 193118 | 984.1 | 784 | 767 | 195.5 |
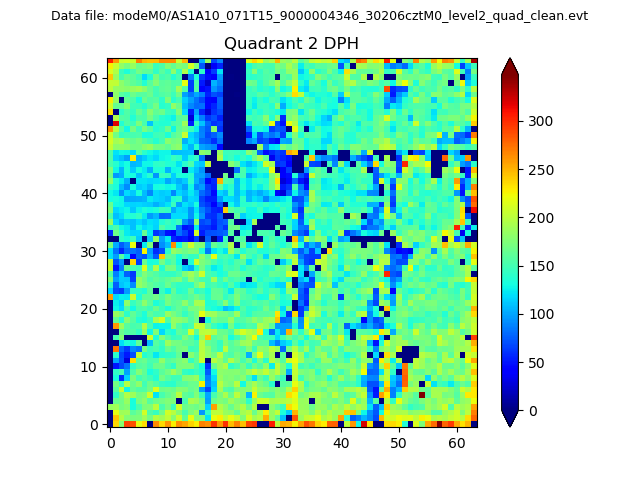
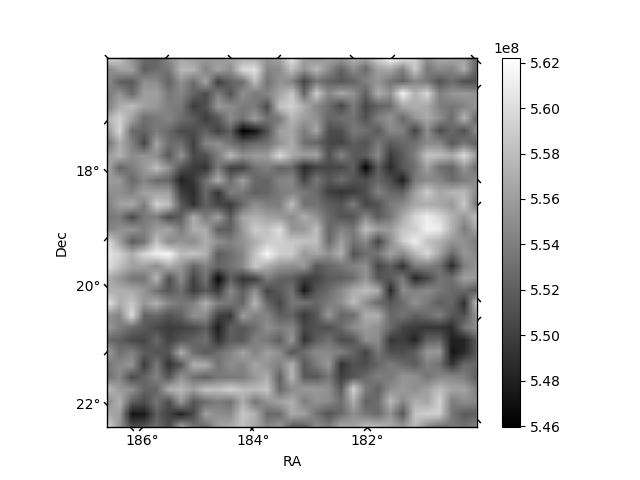
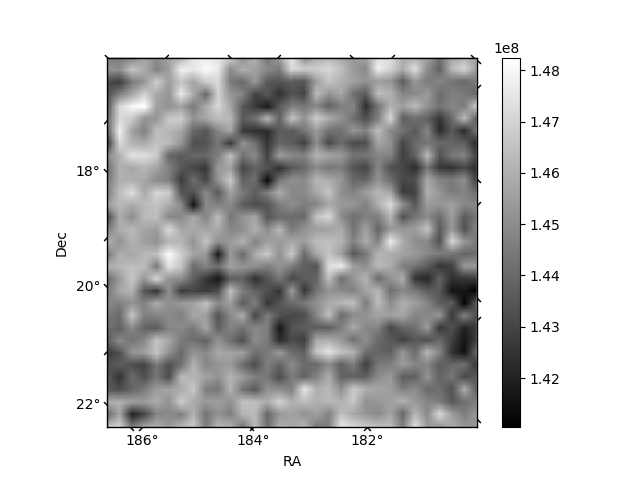
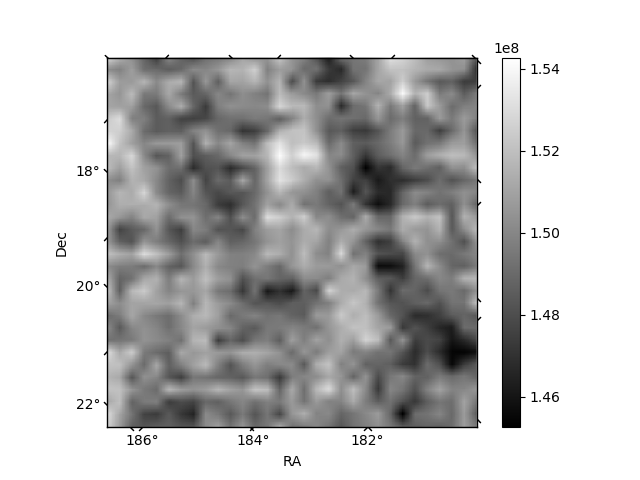
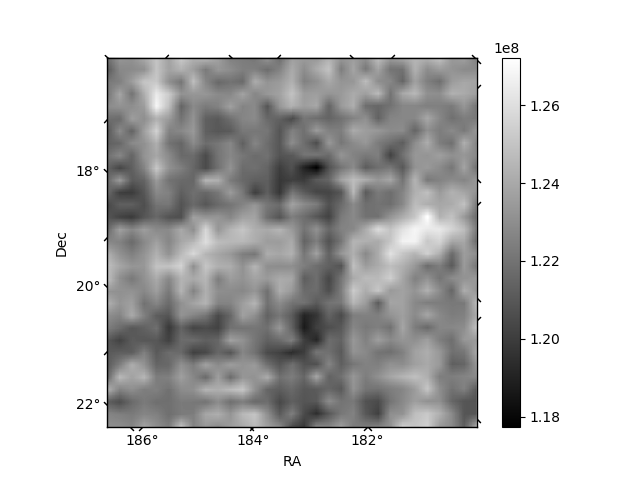
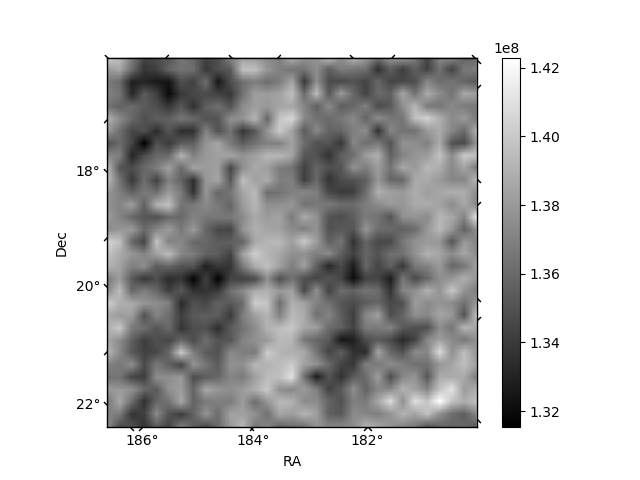
Histogram calculated using DETX and DETY for each event in the final _common_clean file
| Quadrant A | 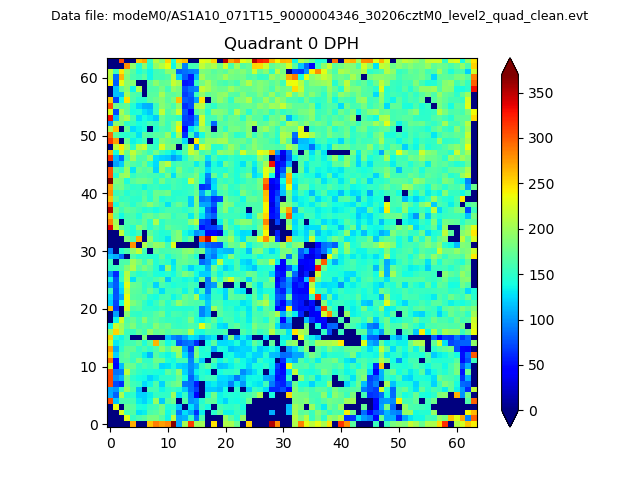 |
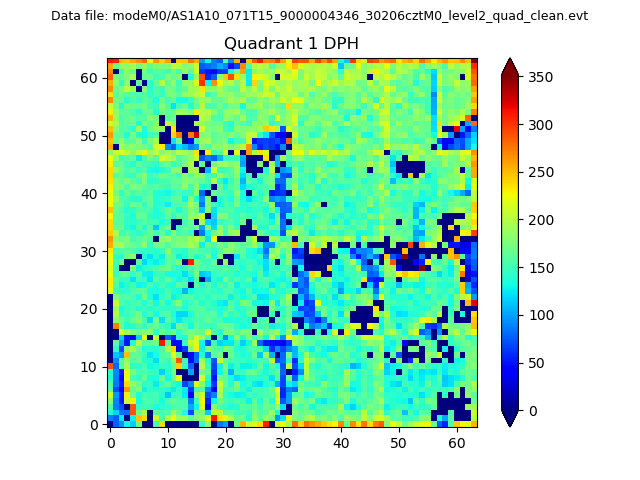 |
Quadrant B |
|---|---|---|---|
| Quadrant D | 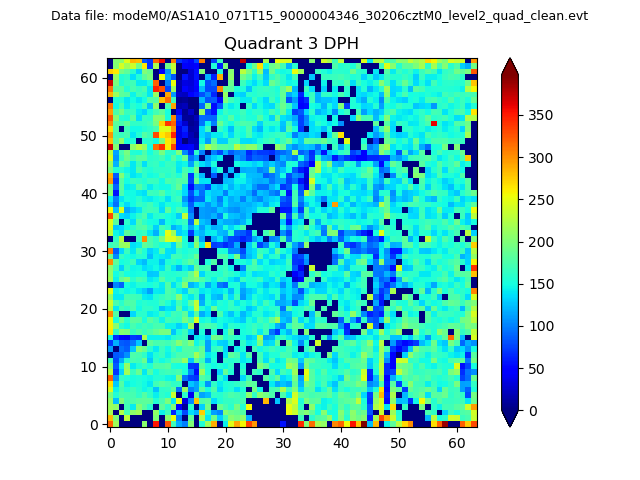 |
 |
Quadrant C |
| Plot type | Count rate plots | Images |
|---|---|---|
| Comparison with Poisson distribution Blue bars denote a histogram of data divided into 1 sec bins. Red curve is a Poisson curve with rate = median count rate of data. |
 |
 |
| Quadrant-wise count rates Data is divided into 100 sec bins |
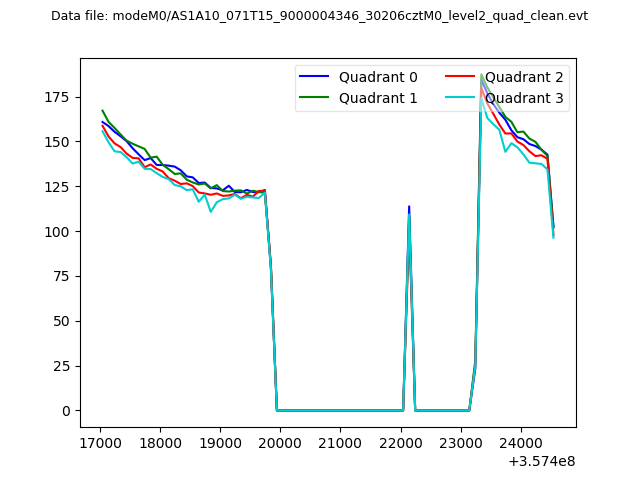 |
|
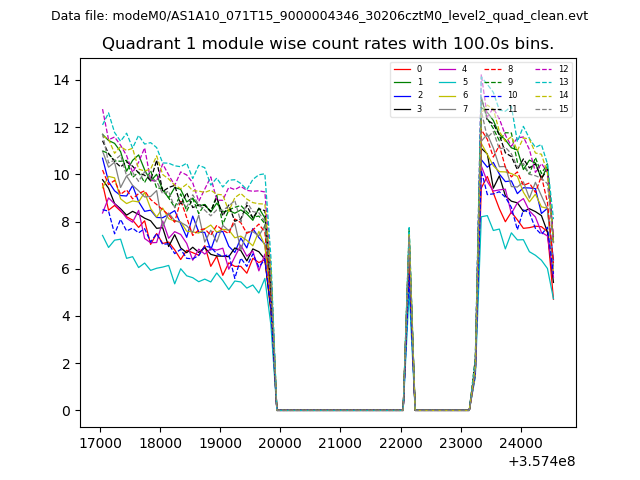
| Module-wise count rates for Quadrant A Data is divided into 100 sec bins |
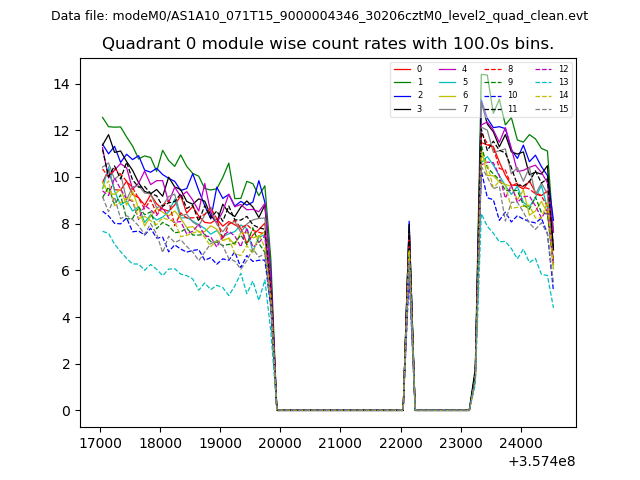 |
 |
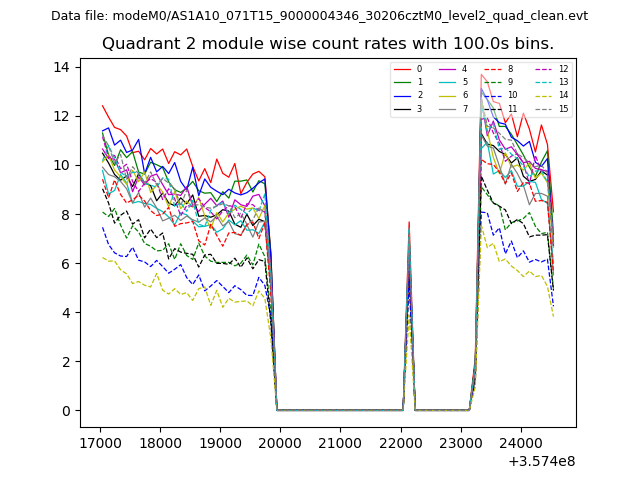
| Module-wise count rates for Quadrant B Data is divided into 100 sec bins |
 |
 |
| Module-wise count rates for Quadrant C Data is divided into 100 sec bins |
 |
 |
| Module-wise count rates for Quadrant D Data is divided into 100 sec bins |
 |
 |
| Parameter | Plot |
|---|---|
| CZT HV Monitor | 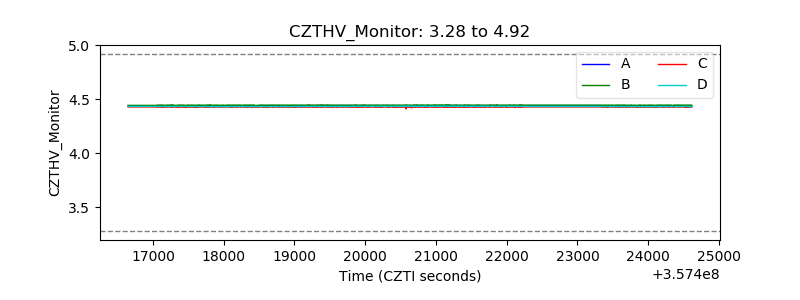 |
| D_VDD | 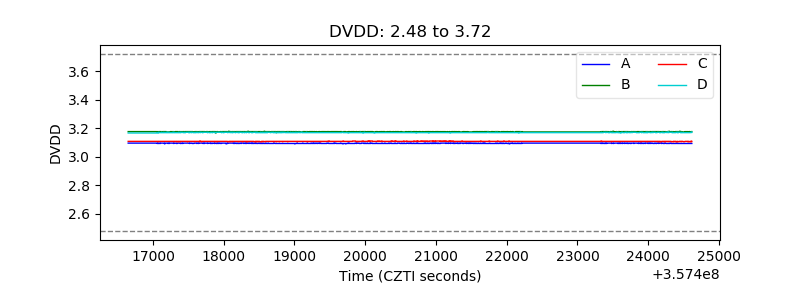 |
| Temperature 1 | 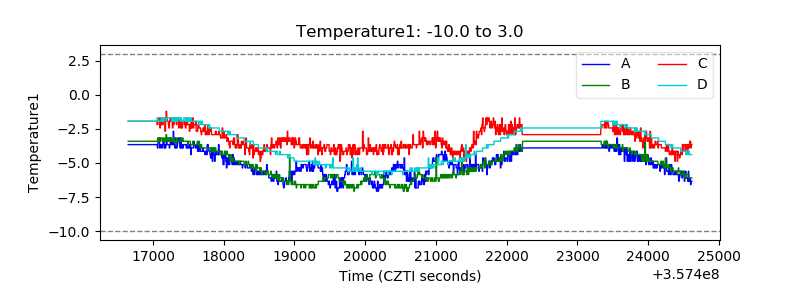 |
| Veto HV Monitor |  |
| Veto LLD | 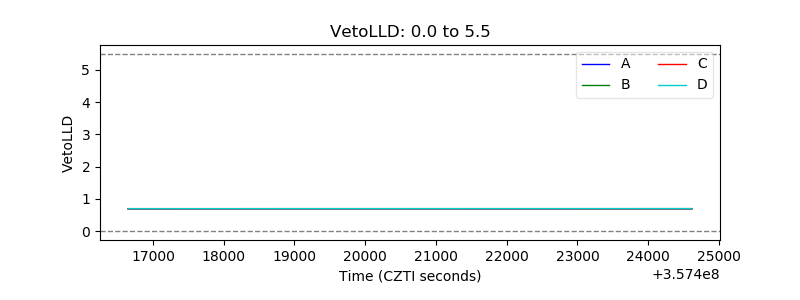 |
| Alpha Counter | 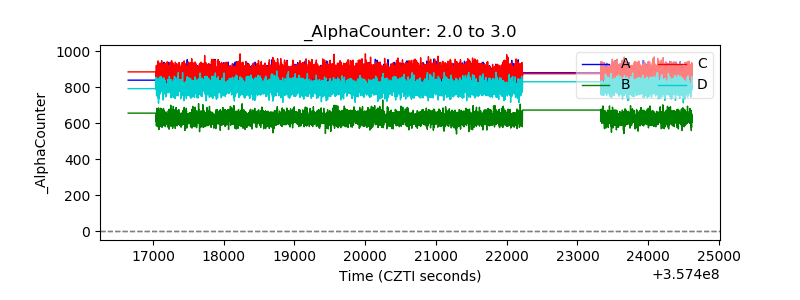 |
| _CPM_Rate | 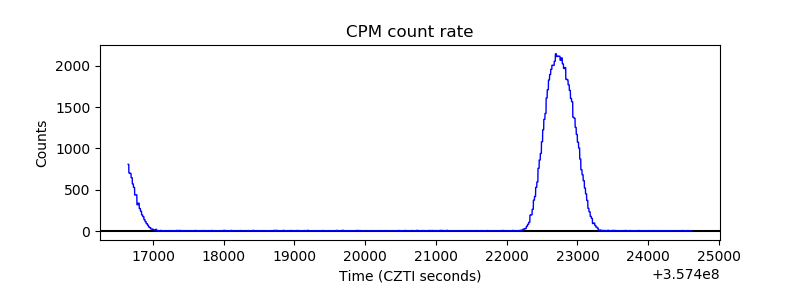 |
| CZT Counter | 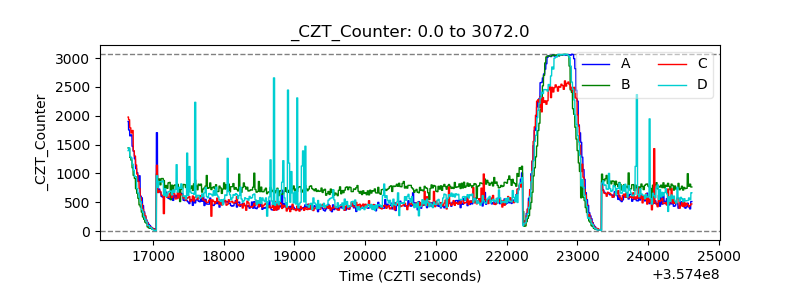 |
| +2.5 Volts monitor |  |
| +5 Volts monitor |  |
| _ROLL_ROT |  |
| _Roll_DEC |  |
| _Roll_RA | 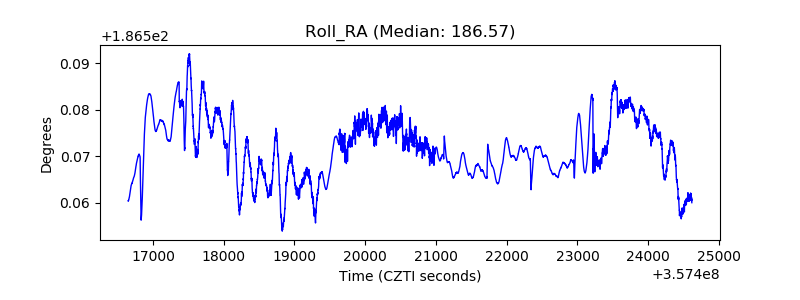 |
| Veto Counter | 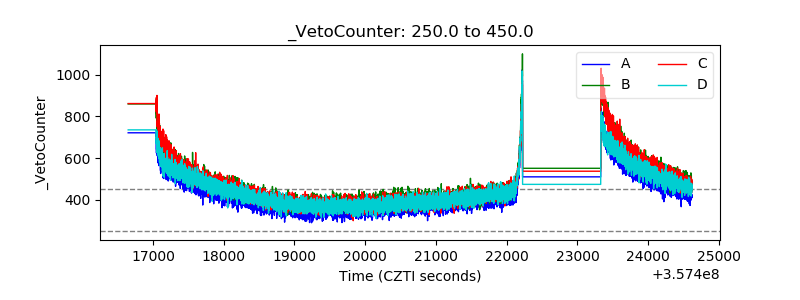 |