| Param | Original file | Final file |
|---|---|---|
| Filename | modeM0/AS1A10_071T15_9000004346_30207cztM0_level2.evt | modeM0/AS1A10_071T15_9000004346_30207cztM0_level2_quad_clean.evt |
| Size (bytes) | 528,001,920 | 96,710,400 |
| Size | 503.5 MB | 92.2 MB |
| Events in quadrant A | 3,196,142 | 632,850 |
| Events in quadrant B | 5,008,155 | 642,956 |
| Events in quadrant C | 3,269,444 | 615,491 |
| Events in quadrant D | 4,084,721 | 592,564 |
| Mode SS | |||
|---|---|---|---|
| Quadrant | BADHDUFLAG | Total packets | Discarded packets |
| A | 0 | 130 | 0 |
| B | 0 | 130 | 0 |
| C | 0 | 130 | 0 |
| D | 0 | 130 | 0 |
| Mode M0 | |||
|---|---|---|---|
| Quadrant | BADHDUFLAG | Total packets | Discarded packets |
| A | 0 | 13578 | 2 |
| B | 0 | 19307 | 2 |
| C | 0 | 13792 | 2 |
| D | 0 | 16233 | 2 |
| Mode M9 | |||
|---|---|---|---|
| Quadrant | BADHDUFLAG | Total packets | Discarded packets |
| A | 0 | 13 | 0 |
| B | 0 | 14 | 0 |
| C | 0 | 14 | 0 |
| D | 0 | 14 | 0 |
| Quadrant | Total seconds | Saturated seconds | Saturation percentage |
|---|---|---|---|
| A | 6375 | 60 | 0.941176% |
| B | 6375 | 94 | 1.474510% |
| C | 6374 | 84 | 1.317854% |
| D | 6374 | 167 | 2.620019% |
Noise dominated data is calculated using 1-second bins in cleaned event files. If a bin has >2000 counts, and if more than 50% of those come from <1% of pixels, then it is considered to be noise-dominated and hence unusable.
| Quadrant | # 1 sec bins | Bins with >0 counts | Bins with >2000 counts | High rate bins dominated by noise | Noise dominated (total time) | Noise dominated (detector-on time) | Marked lightcurve |
|---|---|---|---|---|---|---|---|
| A | 7600 | 6375 | 3 | 3 | 0.04% | 0.05% | 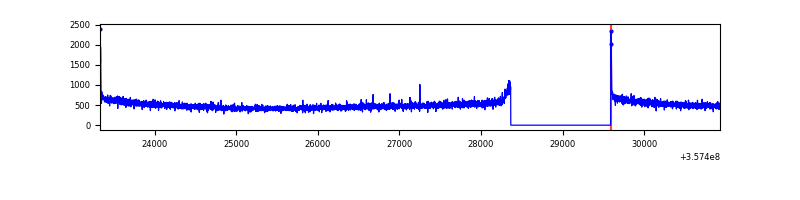 |
| B | 7600 | 6376 | 0 | 0 | 0.00% | 0.00% | 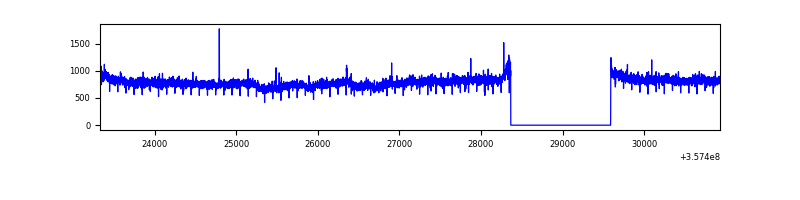 |
| C | 7599 | 6375 | 0 | 0 | 0.00% | 0.00% | 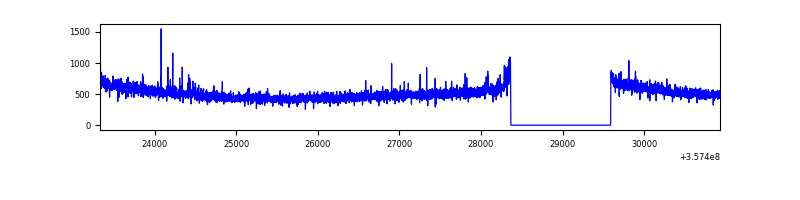 |
| D | 7599 | 6375 | 117 | 117 | 1.54% | 1.84% | 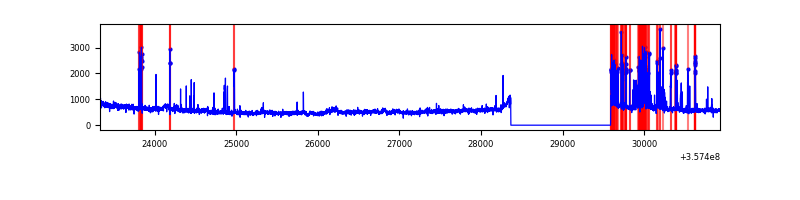 |
Top three noisy pixels from each quadrant. If the there are fewer than three noisy pixels in the level2.evt file, extra rows are filled as -1
| Pixel properties | Quadrant properties | ||||||
|---|---|---|---|---|---|---|---|
| Quadrant | DetID | PixID | Counts | Sigma | Mean | Median | Sigma |
| A | 8 | 192 | 27335 | 161.88 | 821 | 804 | 163.9 |
| A | 13 | 254 | 10925 | 61.76 | 821 | 804 | 163.9 |
| A | 3 | 137 | 8020 | 44.03 | 821 | 804 | 163.9 |
| B | 6 | 159 | 1794299 | 11595.9 | 818 | 798 | 154.7 |
| B | 12 | 111 | 18793 | 116.35 | 818 | 798 | 154.7 |
| B | 11 | 111 | 17302 | 106.71 | 818 | 798 | 154.7 |
| C | 14 | 238 | 130222 | 699.01 | 793 | 800 | 185.2 |
| C | 10 | 22 | 25342 | 132.55 | 793 | 800 | 185.2 |
| C | 2 | 114 | 14804 | 75.64 | 793 | 800 | 185.2 |
| D | 13 | 104 | 370450 | 1961.98 | 786 | 768 | 188.4 |
| D | 7 | 223 | 308758 | 1634.57 | 786 | 768 | 188.4 |
| D | 8 | 195 | 265359 | 1404.24 | 786 | 768 | 188.4 |
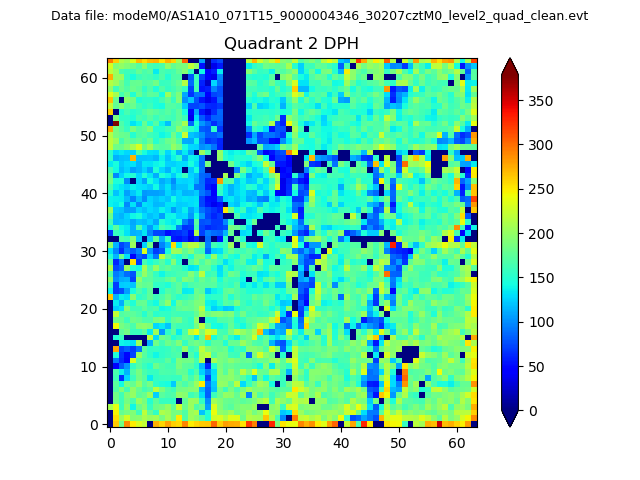
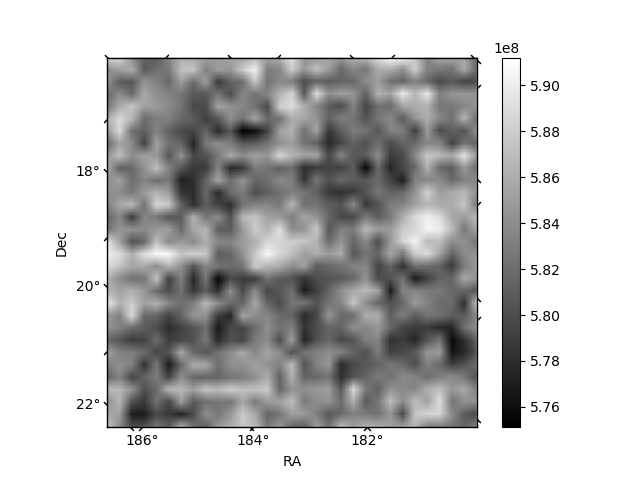
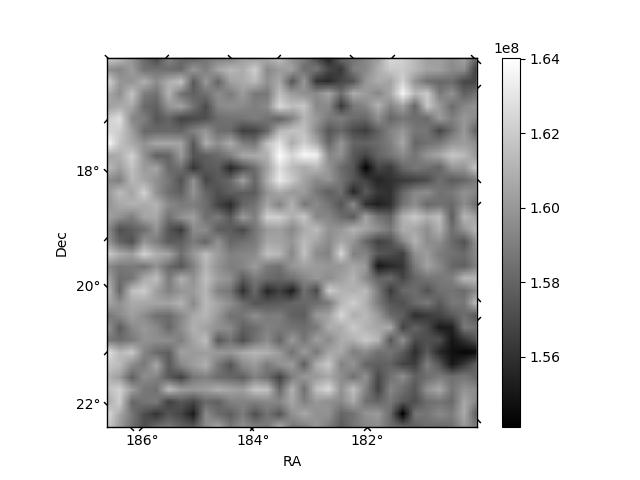
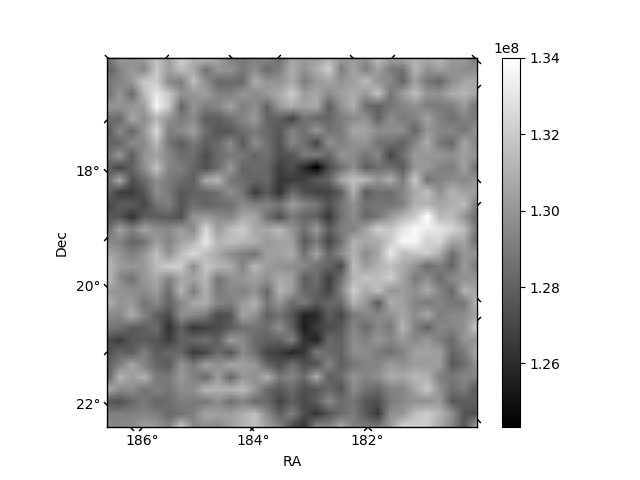
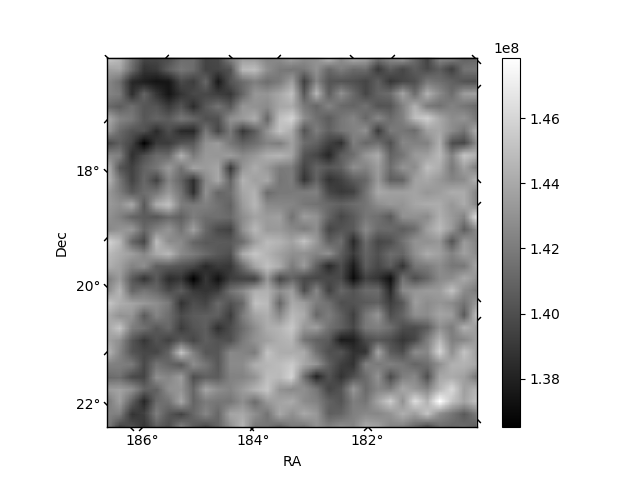
Histogram calculated using DETX and DETY for each event in the final _common_clean file
| Quadrant A | 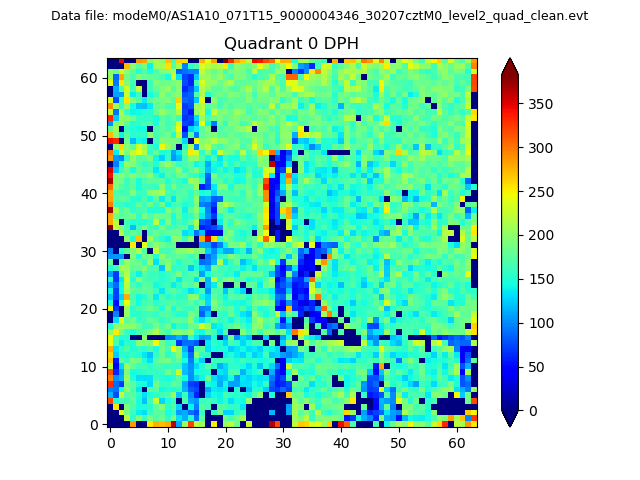 |
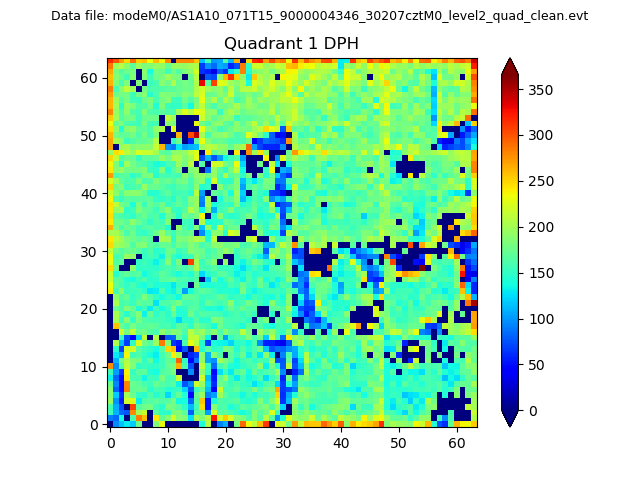 |
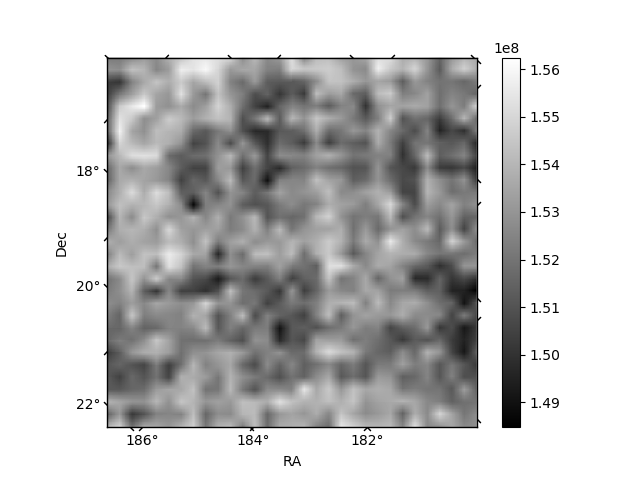
Quadrant B |
|---|---|---|---|
| Quadrant D | 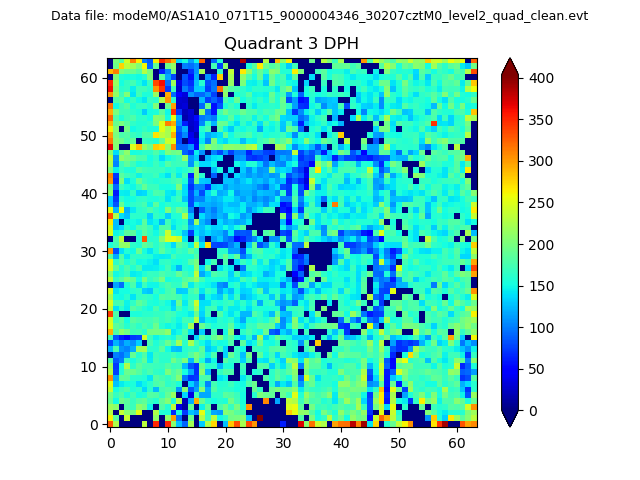 |
 |
Quadrant C |
| Plot type | Count rate plots | Images |
|---|---|---|
| Comparison with Poisson distribution Blue bars denote a histogram of data divided into 1 sec bins. Red curve is a Poisson curve with rate = median count rate of data. |
 |
 |
| Quadrant-wise count rates Data is divided into 100 sec bins |
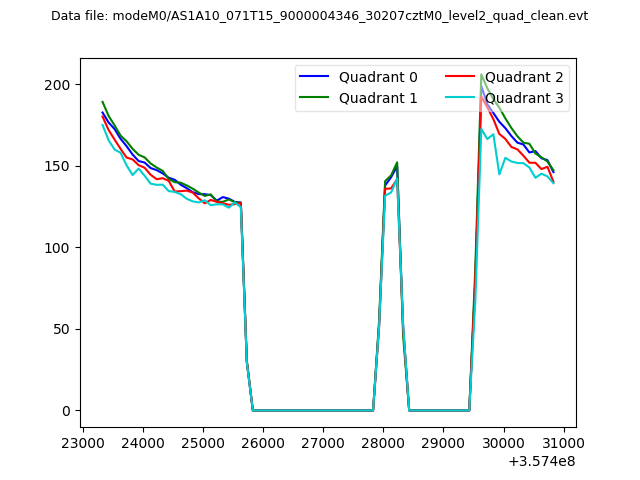 |
|
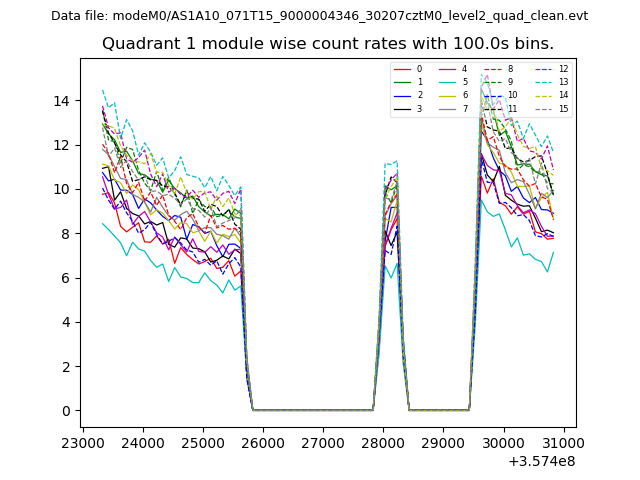
| Module-wise count rates for Quadrant A Data is divided into 100 sec bins |
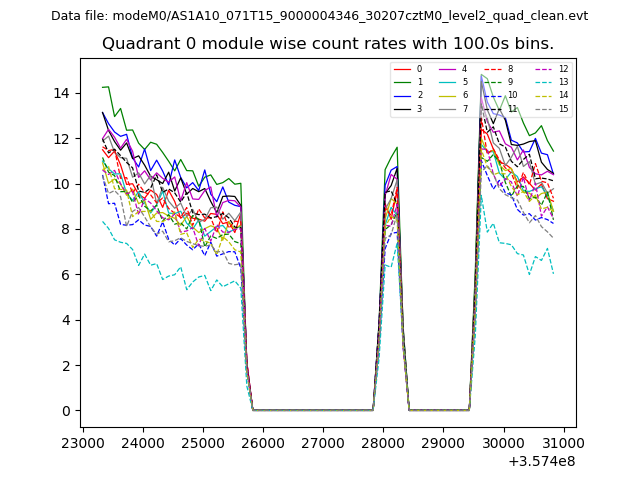 |
 |
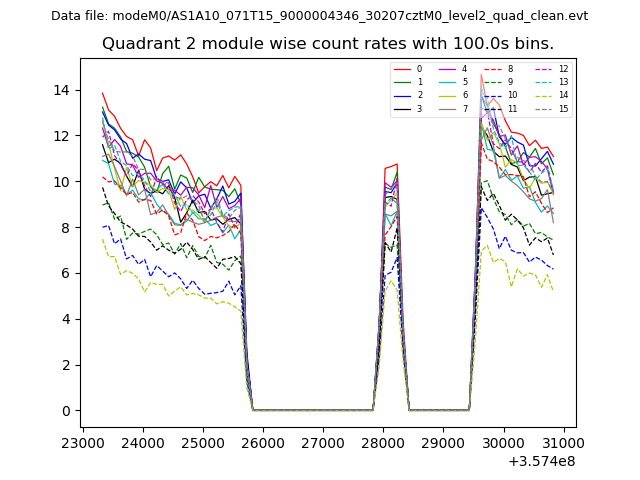
| Module-wise count rates for Quadrant B Data is divided into 100 sec bins |
 |
 |
| Module-wise count rates for Quadrant C Data is divided into 100 sec bins |
 |
 |
| Module-wise count rates for Quadrant D Data is divided into 100 sec bins |
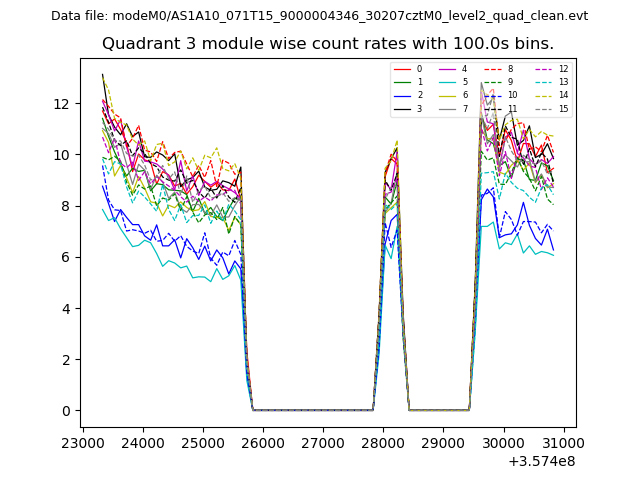 |
 |
| Parameter | Plot |
|---|---|
| CZT HV Monitor | 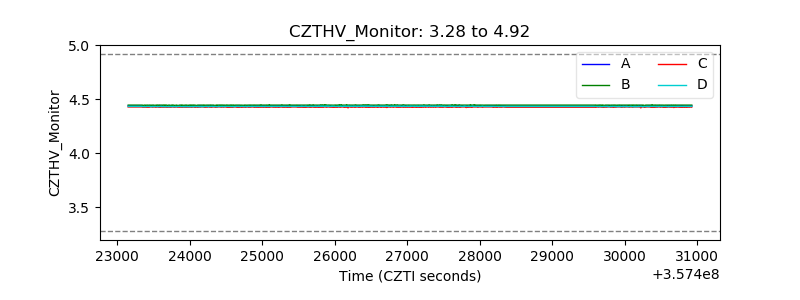 |
| D_VDD | 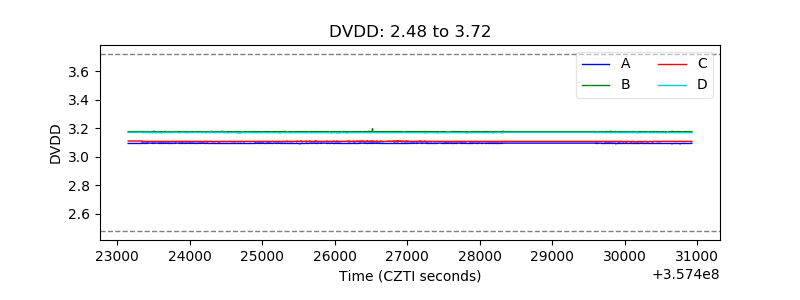 |
| Temperature 1 |  |
| Veto HV Monitor | 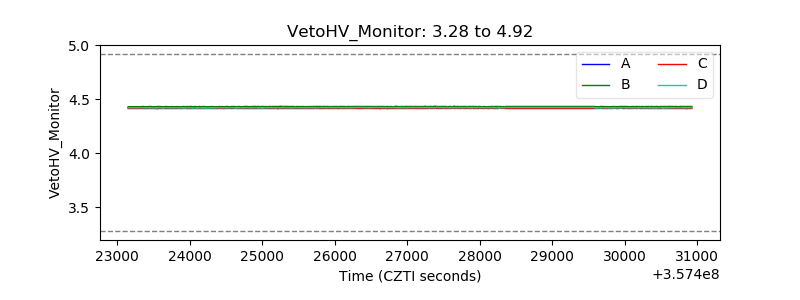 |
| Veto LLD | 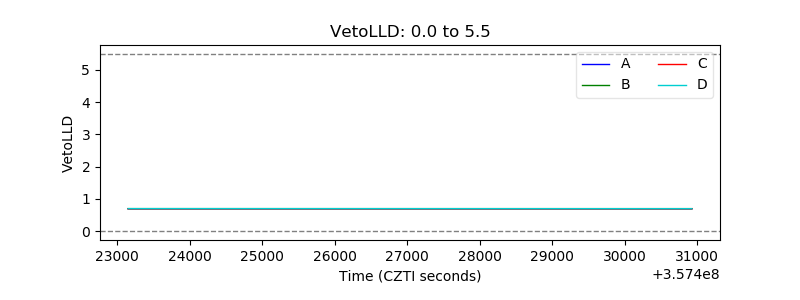 |
| Alpha Counter | 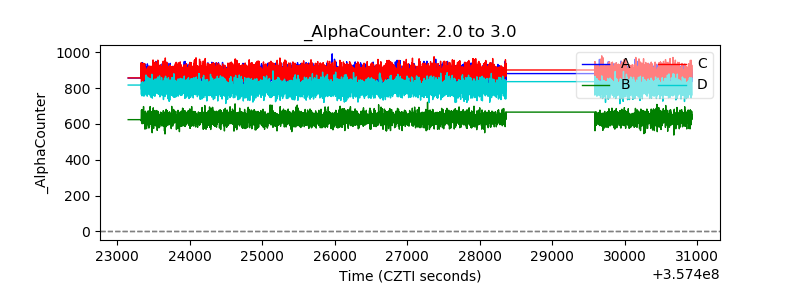 |
| _CPM_Rate | 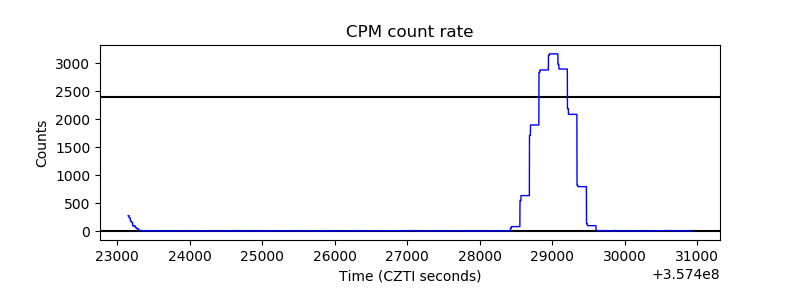 |
| CZT Counter | 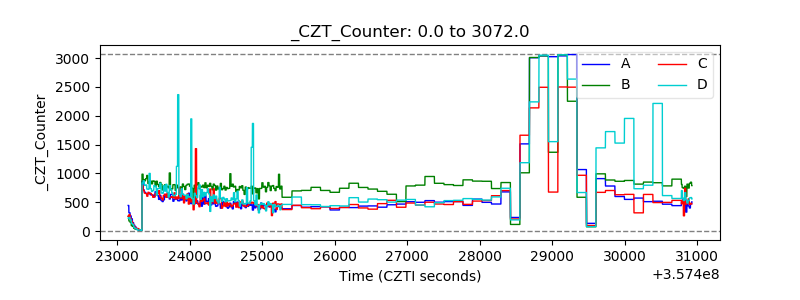 |
| +2.5 Volts monitor |  |
| +5 Volts monitor | 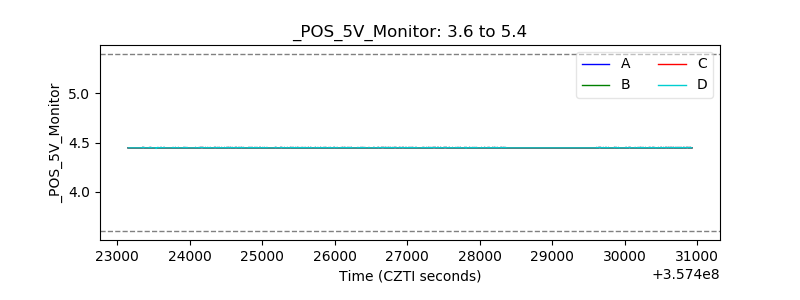 |
| _ROLL_ROT | 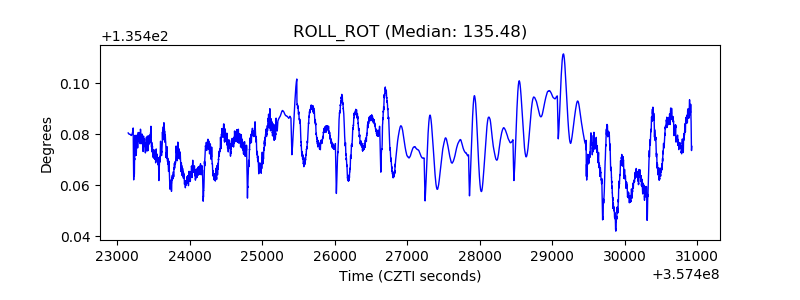 |
| _Roll_DEC | 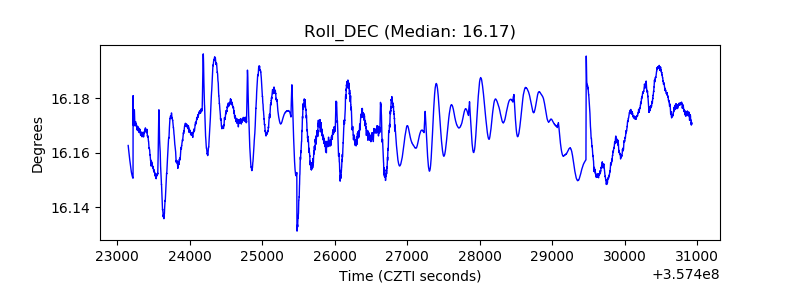 |
| _Roll_RA | 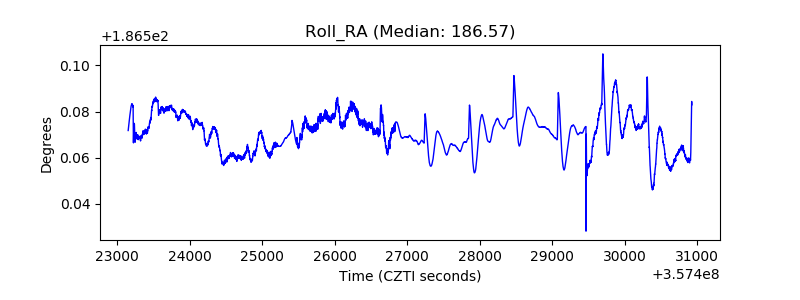 |
| Veto Counter |  |