| Param | Original file | Final file |
|---|---|---|
| Filename | modeM0/AS1A10_071T15_9000004346_30210cztM0_level2.evt | modeM0/AS1A10_071T15_9000004346_30210cztM0_level2_quad_clean.evt |
| Size (bytes) | 513,028,800 | 86,166,720 |
| Size | 489.3 MB | 82.2 MB |
| Events in quadrant A | 3,189,956 | 559,470 |
| Events in quadrant B | 4,897,300 | 571,787 |
| Events in quadrant C | 3,223,984 | 536,175 |
| Events in quadrant D | 3,812,594 | 515,860 |
| Mode SS | |||
|---|---|---|---|
| Quadrant | BADHDUFLAG | Total packets | Discarded packets |
| A | 0 | 124 | 0 |
| B | 0 | 124 | 0 |
| C | 0 | 124 | 0 |
| D | 0 | 124 | 0 |
| Mode M0 | |||
|---|---|---|---|
| Quadrant | BADHDUFLAG | Total packets | Discarded packets |
| A | 0 | 12990 | 2 |
| B | 0 | 18551 | 2 |
| C | 0 | 13103 | 2 |
| D | 0 | 15323 | 3 |
| Mode M9 | |||
|---|---|---|---|
| Quadrant | BADHDUFLAG | Total packets | Discarded packets |
| A | 0 | 23 | 0 |
| B | 0 | 24 | 0 |
| C | 0 | 24 | 0 |
| D | 0 | 24 | 0 |
| Quadrant | Total seconds | Saturated seconds | Saturation percentage |
|---|---|---|---|
| A | 6104 | 38 | 0.622543% |
| B | 6104 | 63 | 1.032110% |
| C | 6104 | 59 | 0.966579% |
| D | 6103 | 80 | 1.310831% |
Noise dominated data is calculated using 1-second bins in cleaned event files. If a bin has >2000 counts, and if more than 50% of those come from <1% of pixels, then it is considered to be noise-dominated and hence unusable.
| Quadrant | # 1 sec bins | Bins with >0 counts | Bins with >2000 counts | High rate bins dominated by noise | Noise dominated (total time) | Noise dominated (detector-on time) | Marked lightcurve |
|---|---|---|---|---|---|---|---|
| A | 7484 | 6105 | 3 | 3 | 0.04% | 0.05% | 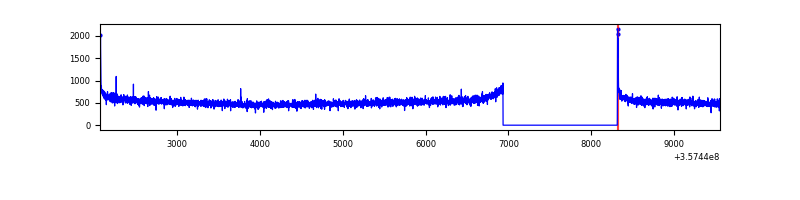 |
| B | 7484 | 6105 | 0 | 0 | 0.00% | 0.00% |  |
| C | 7484 | 6105 | 0 | 0 | 0.00% | 0.00% | 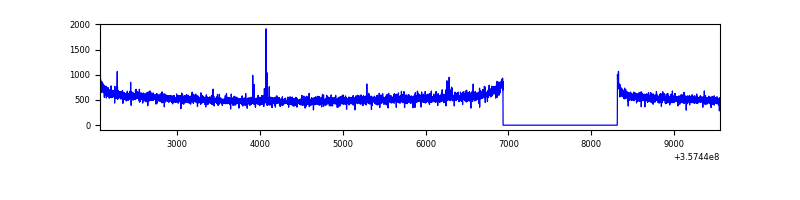 |
| D | 7483 | 6104 | 64 | 64 | 0.86% | 1.05% |  |
Top three noisy pixels from each quadrant. If the there are fewer than three noisy pixels in the level2.evt file, extra rows are filled as -1
| Pixel properties | Quadrant properties | ||||||
|---|---|---|---|---|---|---|---|
| Quadrant | DetID | PixID | Counts | Sigma | Mean | Median | Sigma |
| A | 8 | 192 | 24958 | 147.4 | 821 | 808 | 163.8 |
| A | 13 | 254 | 10036 | 56.32 | 821 | 808 | 163.8 |
| A | 3 | 137 | 7673 | 41.9 | 821 | 808 | 163.8 |
| B | 6 | 159 | 1676114 | 10798.07 | 820 | 802 | 155.1 |
| B | 12 | 111 | 18733 | 115.57 | 820 | 802 | 155.1 |
| B | 11 | 111 | 17114 | 105.14 | 820 | 802 | 155.1 |
| C | 14 | 238 | 127658 | 693.86 | 785 | 792 | 182.8 |
| C | 3 | 233 | 20173 | 106.0 | 785 | 792 | 182.8 |
| C | 2 | 114 | 14261 | 73.66 | 785 | 792 | 182.8 |
| D | 8 | 195 | 320897 | 1740.34 | 772 | 756 | 184.0 |
| D | 7 | 223 | 247494 | 1341.31 | 772 | 756 | 184.0 |
| D | 13 | 104 | 145474 | 786.71 | 772 | 756 | 184.0 |
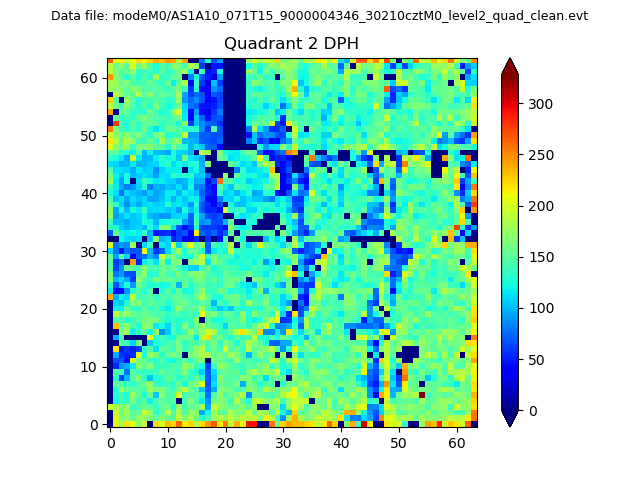
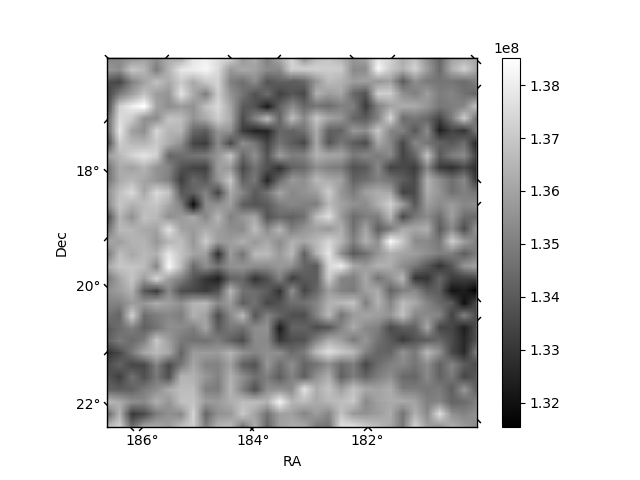
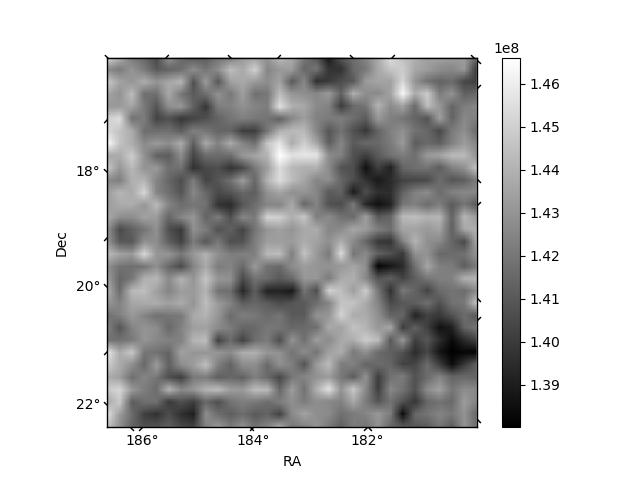
Histogram calculated using DETX and DETY for each event in the final _common_clean file
| Quadrant A | 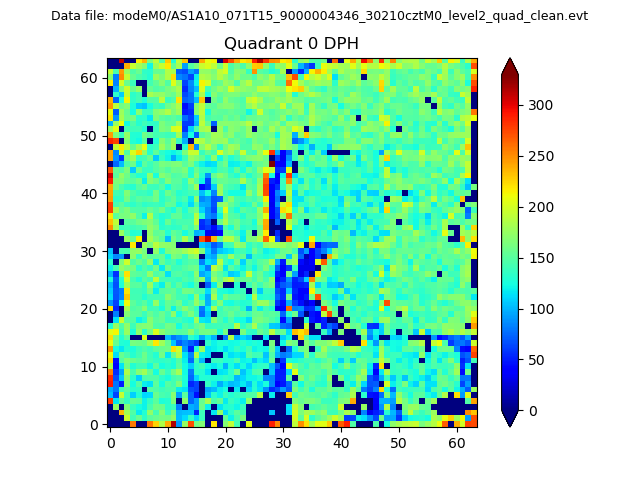 |
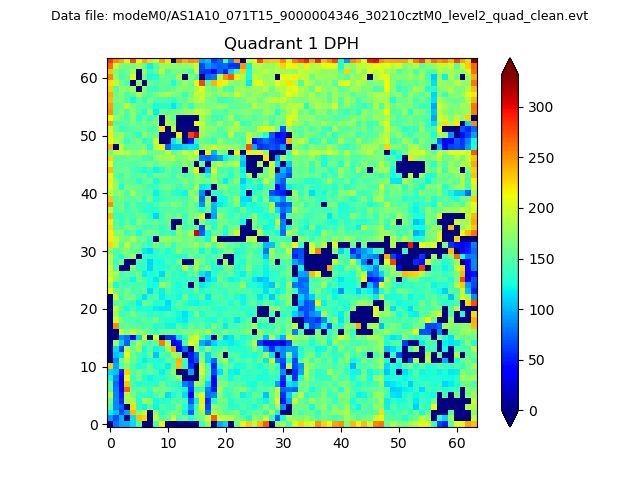 |
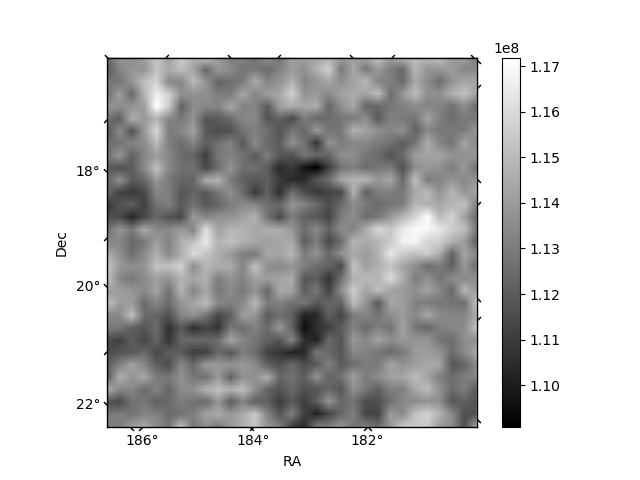
Quadrant B |
|---|---|---|---|
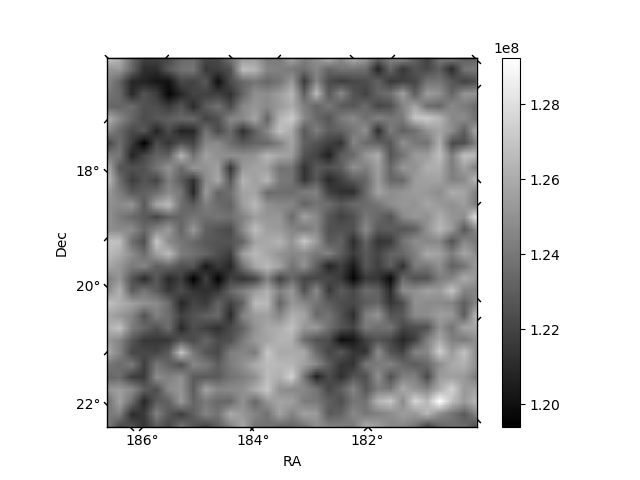
| Quadrant D | 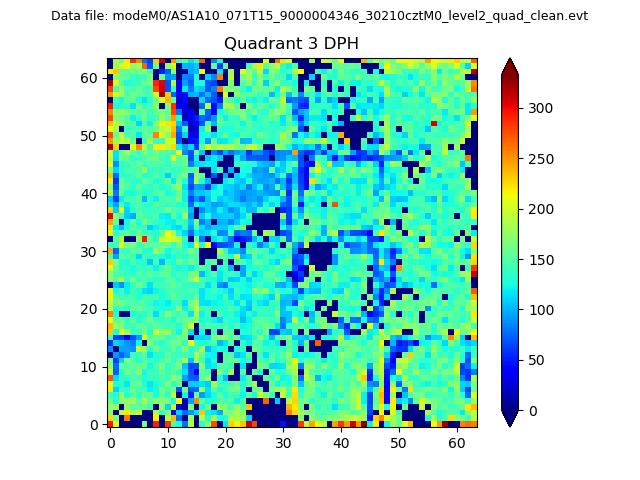 |
 |
Quadrant C |
| Plot type | Count rate plots | Images |
|---|---|---|
| Comparison with Poisson distribution Blue bars denote a histogram of data divided into 1 sec bins. Red curve is a Poisson curve with rate = median count rate of data. |
 |
 |
| Quadrant-wise count rates Data is divided into 100 sec bins |
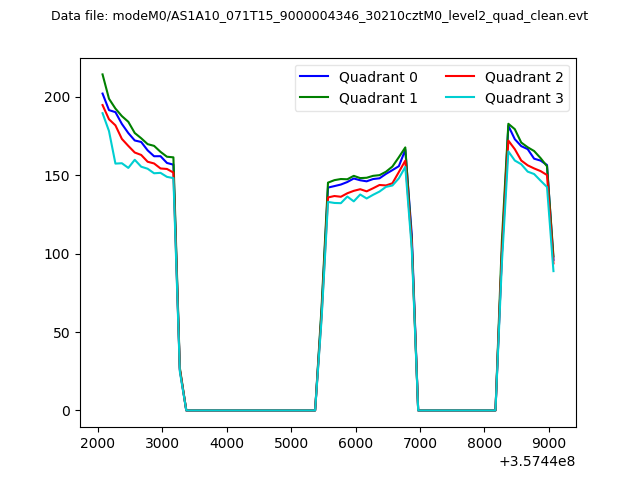 |
|
| Module-wise count rates for Quadrant A Data is divided into 100 sec bins |
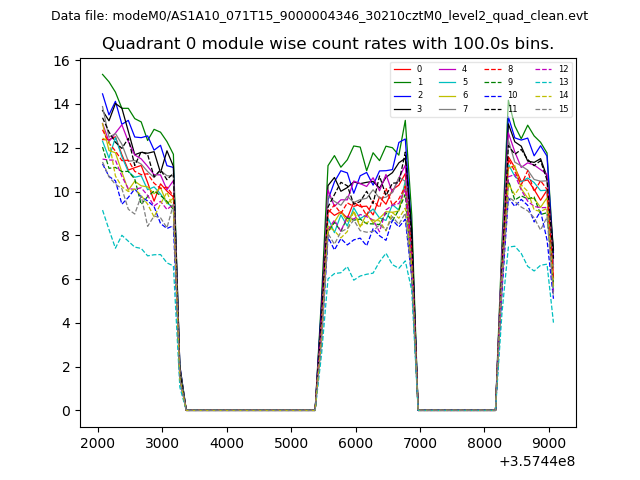 |
 |
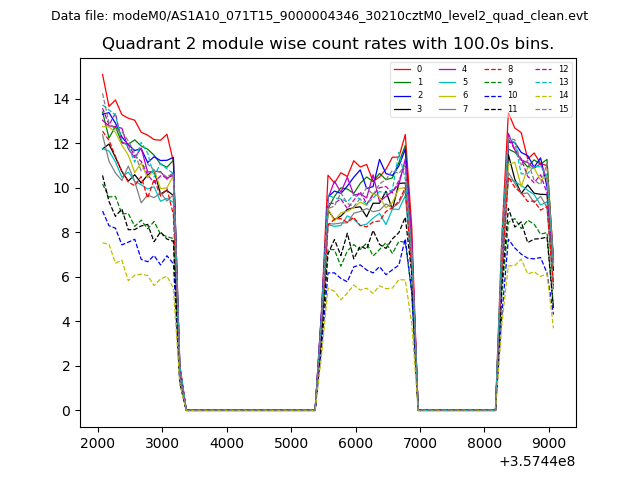
| Module-wise count rates for Quadrant B Data is divided into 100 sec bins |
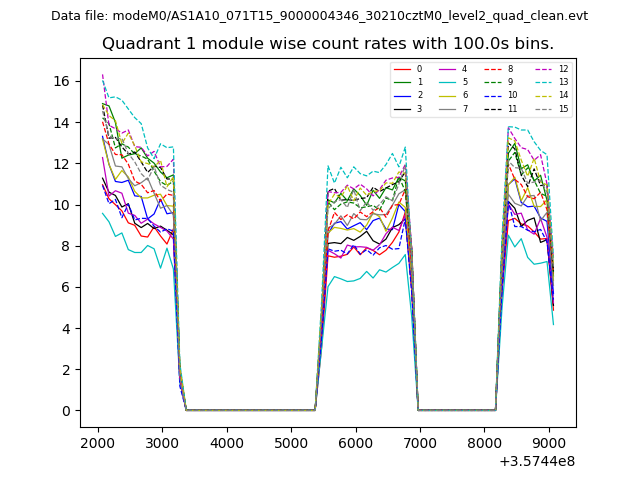 |
 |
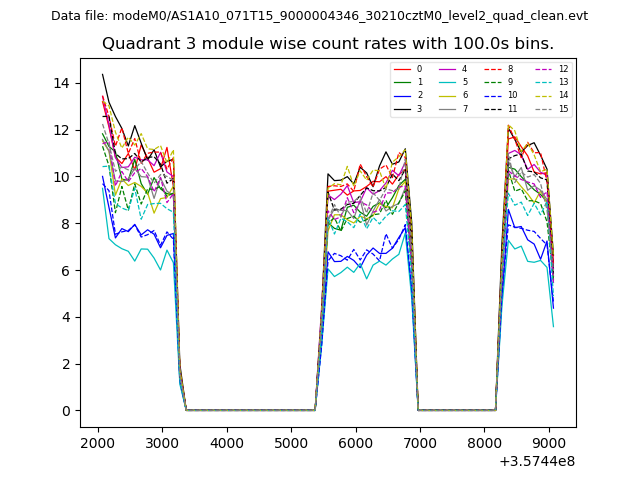
| Module-wise count rates for Quadrant C Data is divided into 100 sec bins |
 |
 |
| Module-wise count rates for Quadrant D Data is divided into 100 sec bins |
 |
 |
| Parameter | Plot |
|---|---|
| CZT HV Monitor | 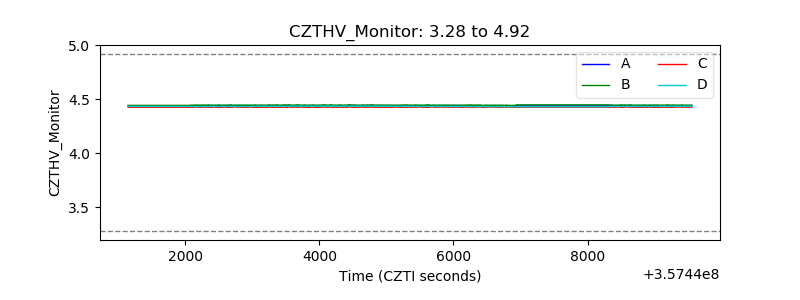 |
| D_VDD | 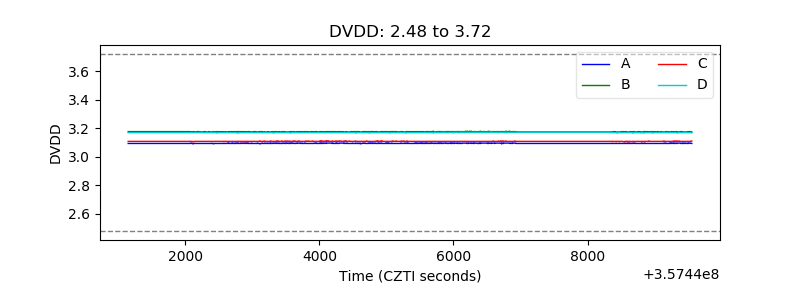 |
| Temperature 1 | 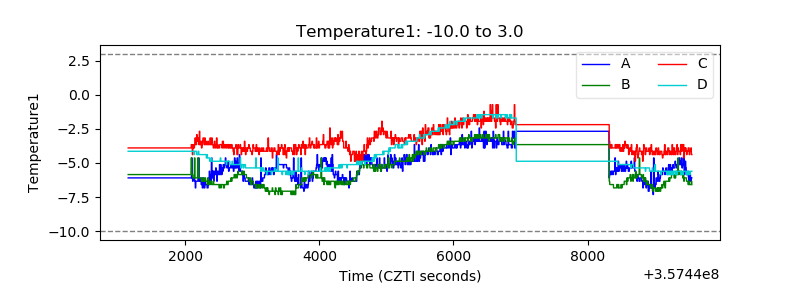 |
| Veto HV Monitor | 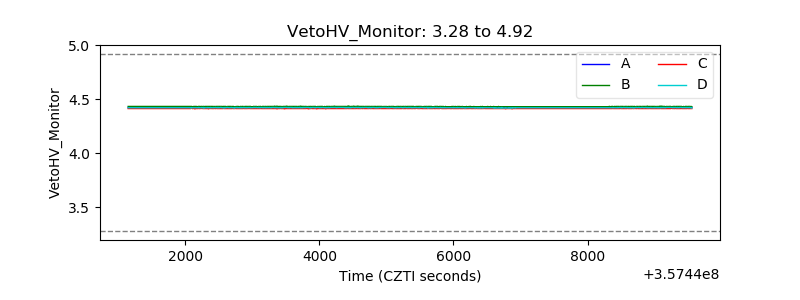 |
| Veto LLD | 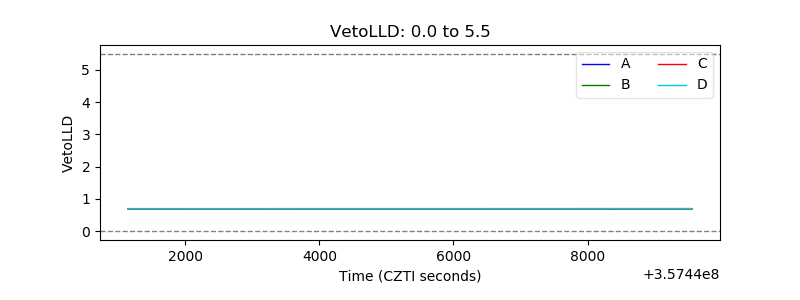 |
| Alpha Counter | 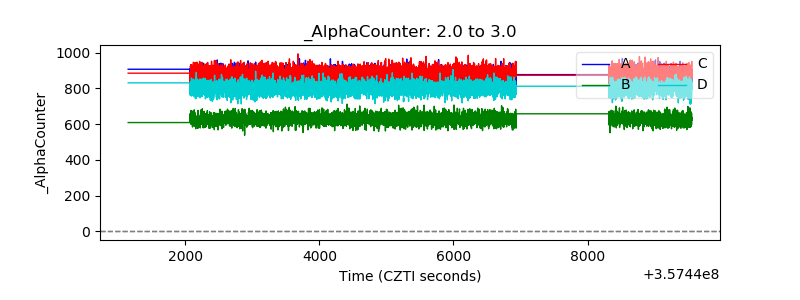 |
| _CPM_Rate | 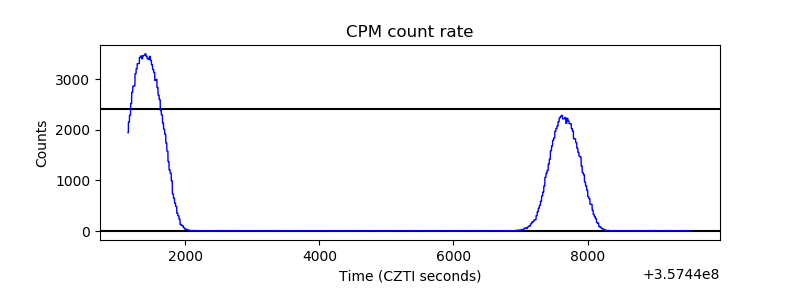 |
| CZT Counter | 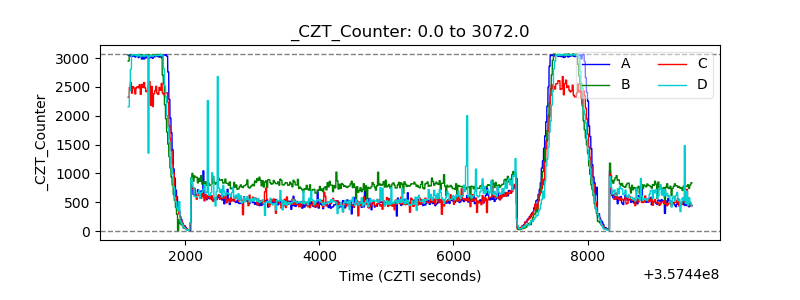 |
| +2.5 Volts monitor | 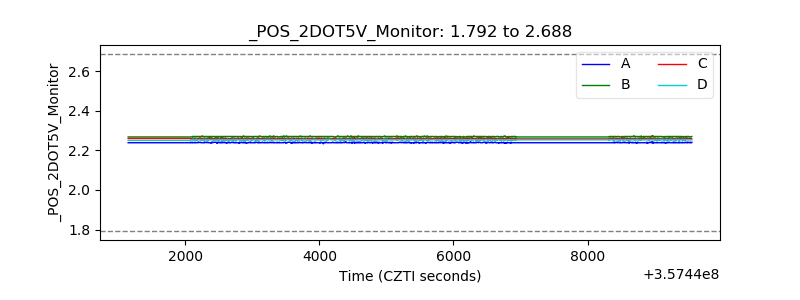 |
| +5 Volts monitor |  |
| _ROLL_ROT | 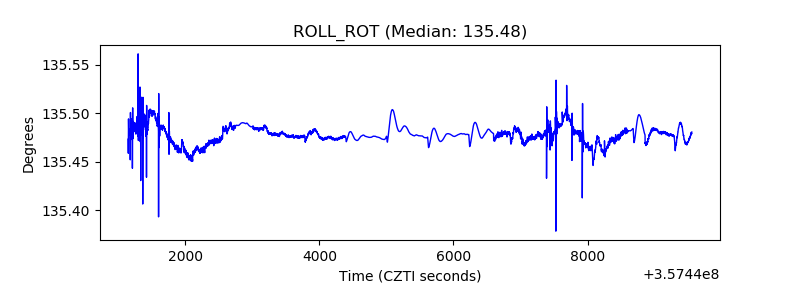 |
| _Roll_DEC |  |
| _Roll_RA | 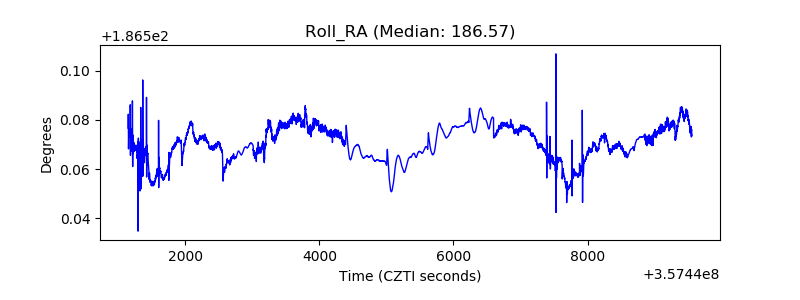 |
| Veto Counter | 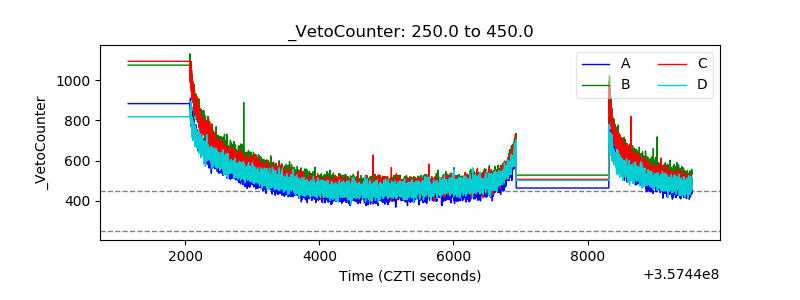 |